Bitcoin’s drop to $56,500 crushed bullish traders’ sentiment and took a heavy toll on altcoin prices but are generational buying opportunities emerging?
Cryptocurrency Financial News
Bitcoin’s drop to $56,500 crushed bullish traders’ sentiment and took a heavy toll on altcoin prices but are generational buying opportunities emerging?
In a significant development for the crypto industry, Changpeng Zhao, commonly known as CZ, the founder of Binance, the world’s largest cryptocurrency exchange, has been imprisoned for four months.
The sentencing follows his guilty plea to charges related to enabling money laundering activities within his crypto exchange. The verdict was delivered in Seattle federal court and marks the culmination of US authorities’ multiyear investigation into Binance.
The sentence handed down to Zhao was notably less severe than the three-year prison term sought by federal prosecutors. In contrast, the defense had requested five months of probation, ultimately given the outcome wanted.
Under the terms of a settlement reached in November of 2023, Zhao agreed to step down as CEO of Binance, as part of an agreement to resolve the investigation.
The probe primarily focused on allegations that Binance failed to implement an effective anti-money laundering program, as the Bank Secrecy Act required.
Zhao was also accused of knowingly allowing Binance to process transactions involving funds derived from unlawful activities, including transactions between US citizens and individuals residing in sanctioned jurisdictions.
As part of the resolution, Binance was ordered to pay an imposing $4.3 billion fines and forfeiture. Additionally, Changpeng Zhao personally agreed to pay a substantial $50 million fine, underscoring the severity of the charges and the commitment to accountability.
The legal challenges for Binance do not end there. The company faces separate lawsuits from the US Securities and Exchange Commission (SEC) and the Commodity Futures Trading Commission (CFTC) for alleged mishandling of customer assets and operating an illegal, unregistered exchange within the United States.
As of this writing, the exchange’s native token, Binance Coin (BNB), is trading at $573, down over 3% in the last 24 hours and 7% in the last seven days.
Featured image from Bloomberg, chart from TradingView.com

Bitcoin and altcoins are falling toward strong support levels, which appear likely to hold in the short term.

Arkham Research notified DeFi wallet owners to look at the addresses and try to retrieve their funds, which have been stuck for months in bridge contracts.

Bitcoin and altcoins could be en route to retest their recent strong support levels as bears try to extend the correction.

Bitcoin and altcoins continue to be rocked by macroeconomic and geopolitical uncertainty, but data shows bulls continue to buy each dip.
BNB price is attempting a fresh increase from the $550 zone. The price cleared the $600 resistance and might extend its increase above $630.
After forming a base above the $520 level, BNB price started a fresh increase. There was a steady increase above the $550 and $565 resistance levels, like Ethereum and Bitcoin.
The bulls pushed the price above the $580 pivot level and the 61.8% Fib retracement level of the downward wave from the $630 swing high to the $512 low. More importantly, the price is now trading above $580 and the 100 simple moving average (4 hours).
It is consolidating just above the 76.4% Fib retracement level of the downward wave from the $630 swing high to the $512 low. There is also a key bullish trend line forming with support at $592 on the 4-hour chart of the BNB/USD pair.
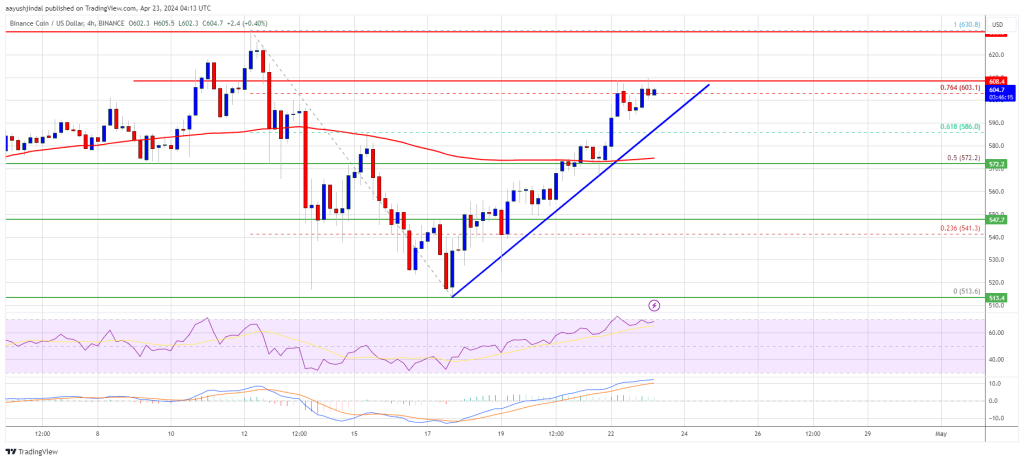
Source: BNBUSD on TradingView.com
Immediate resistance is near the $608 level. The next resistance sits near the $630 level. A clear move above the $630 zone could send the price further higher. In the stated case, BNB price could test $650. A close above the $650 resistance might set the pace for a larger increase toward the $680 resistance. Any more gains might call for a test of the $720 level in the coming days.
If BNB fails to clear the $608 resistance, it could start a downside correction. Initial support on the downside is near the $592 level and the trend line.
The next major support is near the $585 level. The main support sits at $570. If there is a downside break below the $570 support, the price could drop toward the $550 support. Any more losses could initiate a larger decline toward the $532 level.
Technical Indicators
4-Hours MACD – The MACD for BNB/USD is gaining pace in the bullish zone.
4-Hours RSI (Relative Strength Index) – The RSI for BNB/USD is currently above the 50 level.
Major Support Levels – $592, $585, and $570.
Major Resistance Levels – $608, $630, and $650.
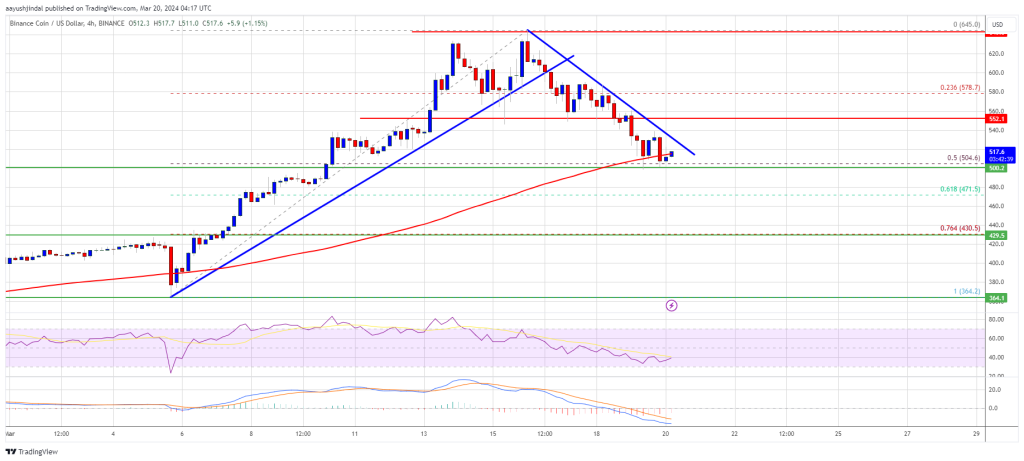
BNB price is attempting a fresh increase from the $515 zone. The price could gain bullish momentum if it clears the $572 resistance zone.
After a downside correction below $550, BNB price found support near the $515 zone. A low was formed at $513.6 and the price started a recovery wave, like Ethereum and Bitcoin.
There was a move above the $525 and $530 resistance levels. The bulls pushed the price above the $540 pivot level and the 23.6% Fib retracement level of the downward move from the $630 swing high to the $513 low. There was also a break above a key bearish trend line with resistance at $540 on the 4-hour chart of the BNB/USD pair.
The price is still trading below $550 and the 100 simple moving average (4 hours). Immediate resistance is near the $555 level. The next resistance sits near the $572 level or the 50% Fib retracement level of the downward move from the $630 swing high to the $513 low.
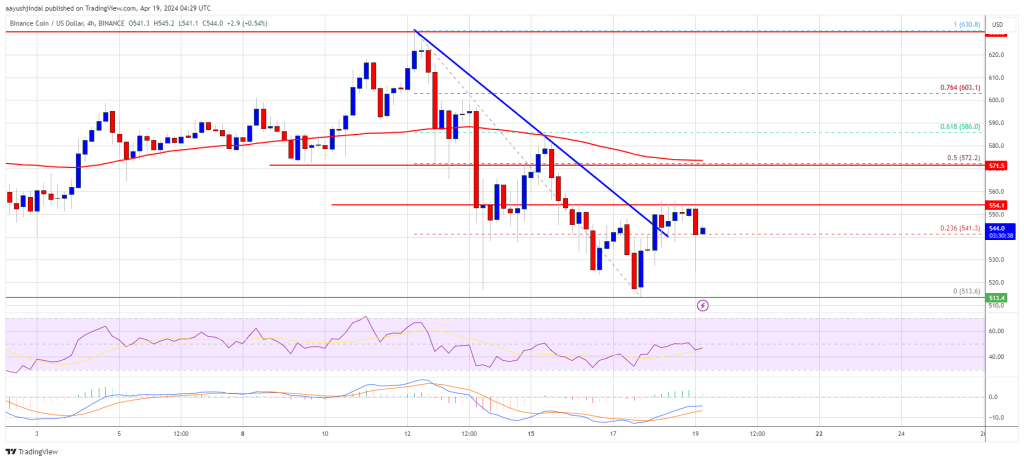
Source: BNBUSD on TradingView.com
A clear move above the $572 zone could send the price further higher. In the stated case, BNB price could test $600. A close above the $600 resistance might set the pace for a larger increase toward the $630 resistance. Any more gains might call for a test of the $650 level in the coming days.
If BNB fails to clear the $572 resistance, it could start another decline. Initial support on the downside is near the $532 level.
The next major support is near the $520 level. The main support sits at $515. If there is a downside break below the $515 support, the price could drop toward the $500 support. Any more losses could initiate a larger decline toward the $465 level.
Technical Indicators
4-Hours MACD – The MACD for BNB/USD is losing pace in the bullish zone.
4-Hours RSI (Relative Strength Index) – The RSI for BNB/USD is currently below the 50 level.
Major Support Levels – $532, $520, and $515.
Major Resistance Levels – $555, $572, and $600.
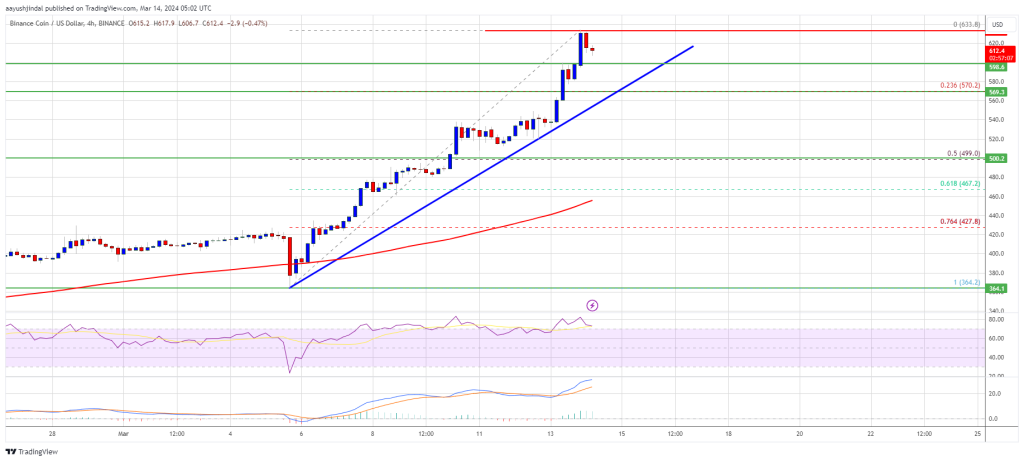
BNB price is attempting a fresh increase from the $575 zone. The price is up over 5% and the bulls seem to be aiming for a move above $620.
After a downside correction below $600, BNB price found support near the $575 zone. A low was formed at $572.8 and the price started a fresh increase, unlike Ethereum and Bitcoin.
There was a move above the $595 and $600 resistance levels. The bulls pushed the price above the $605 pivot level. It is up over 5% and showing many positive signs above the 23.6% Fib retracement level of the recent increase from the $572.8 swing low to the $618.0 high.
The price is now trading above $600 and the 100 simple moving average (4 hours). There is also a key bullish trend line forming with support at $587 on the 4-hour chart of the BNB/USD pair.
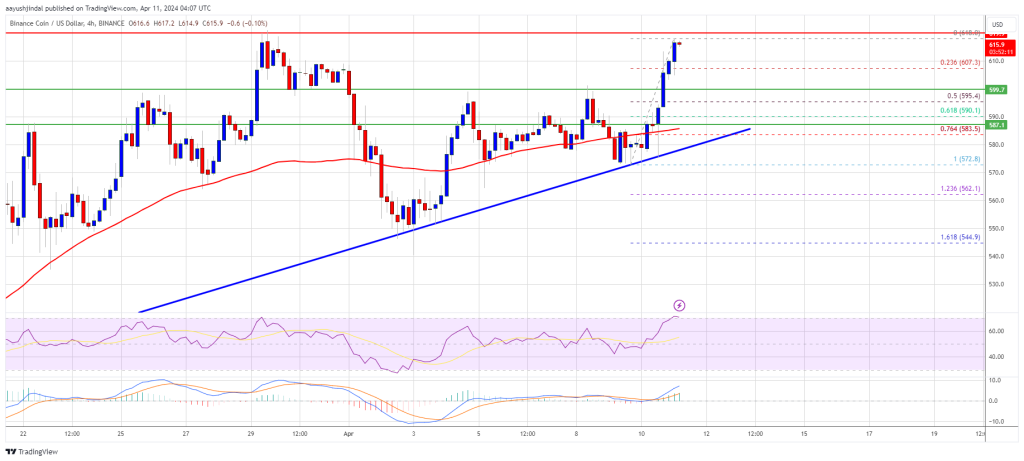
Source: BNBUSD on TradingView.com
Immediate resistance is near the $618 level. The next resistance sits near the $620 level. A clear move above the $620 zone could send the price further higher. In the stated case, BNB price could test $632. A close above the $632 resistance might set the pace for a larger increase toward the $650 resistance. Any more gains might call for a test of the $700 level in the coming days.
If BNB fails to clear the $620 resistance, it could start a downside correction. Initial support on the downside is near the $600 level.
The next major support is near the $590 level and the trend line or the 61.8% Fib retracement level of the recent increase from the $572.8 swing low to the $618.0 high. The main support sits at $575. If there is a downside break below the $575 support, the price could drop toward the $562 support. Any more losses could initiate a larger decline toward the $550 level.
Technical Indicators
4-Hours MACD – The MACD for BNB/USD is gaining pace in the bullish zone.
4-Hours RSI (Relative Strength Index) – The RSI for BNB/USD is currently above the 50 level.
Major Support Levels – $600, $585, and $575.
Major Resistance Levels – $620, $632, and $650.
The outlook for Binance Coin (BNB) has turned cloudy, with both futures market data and technical indicators flashing bearish signals. Based on our analysis of Coinglass data, negative funding rates and declining open interest in BNB futures contracts paint a picture of growing pessimism among traders.
A negative funding rate suggests that more traders are holding short positions, anticipating a decline in the price of the asset. This sentiment was confirmed on April 1st, when BNB’s funding rate dipped into negative territory at -0.012%.
Further fueling the bearish narrative, BNB’s futures open interest has also witnessed a slight decline of 0.15%. Open interest reflects the total amount of outstanding futures contracts that haven’t been settled yet.
A decrease in open interest suggests traders are exiting their positions without opening new ones, potentially signaling waning confidence in the market.
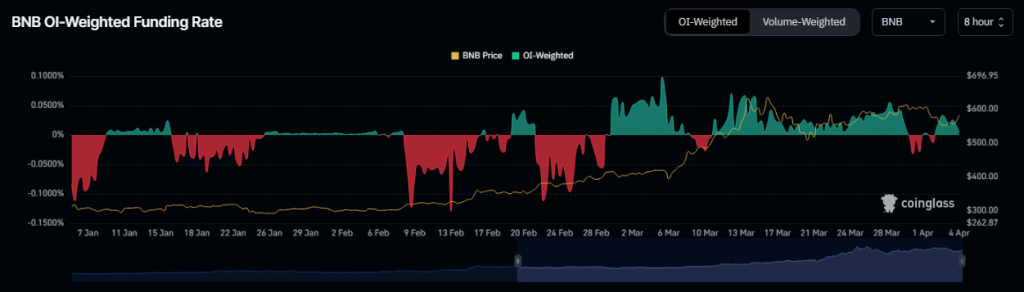
Funding rates are a crucial mechanism in perpetual futures contracts that keep the contract price aligned with the spot price. When the contract price trades higher than the spot price, long position holders pay a fee to shorts, resulting in positive funding rates.
Conversely, negative funding rates materialize when the contract price dips below the spot price, indicating that short sellers are currently paying fees to longs.
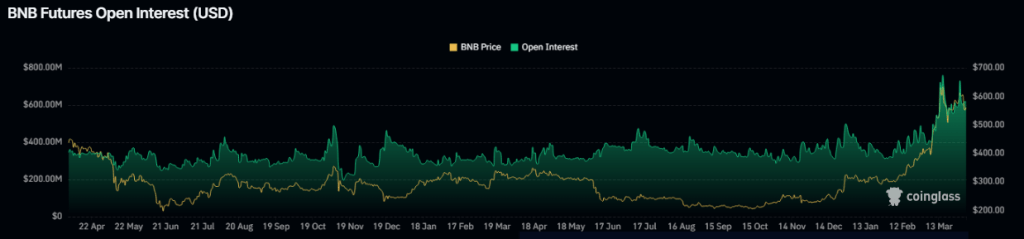
As negative sentiments mount, this open interest is expected to plummet further. This would imply that more traders are closing their positions and not opening new ones, suggesting a potential price drop for BNB.
The bearish sentiment isn’t confined to the futures market. The Moving Average Convergence Divergence (MACD), another technical indicator, is suggesting a possible resurgence in selling pressure.
There’s an indication that the MACD line might cross below the signal line, typically interpreted as a bearish sign signaling the return of sellers to the market. It’s noteworthy that since March 18th, the MACD lines for BNB have been positioned for a downtrend.
BNB Price Retreat In The Offing?
Considering both the futures market and technical analysis, there’s a potential for a short-term decline in BNB’s price. However, it’s important to acknowledge that market sentiment can shift rapidly, and technical indicators aren’t infallible predictors of future price movements.
At the time of writing, BNB was trading at $587, up 6% in the last 24 hours, data from CoinMarketCap shows.
Meanwhile, a closer look at BNB’s technical indicators on the 24-hour chart reveals another trend.
The Directional Movement Index (DMI), used to gauge trend strength, displayed a bearish crossover where the negative directional index sits above the positive directional index. This positioning suggests that bearish momentum is currently dominating the market.
Analysts commonly interpret this particular crossover as an imperative signal prompting traders to consider exiting long positions and initiating short positions.
This strategic move aligns with the prevailing trend indicated by the DMI, reinforcing the notion of a prevailing bearish sentiment within the market ecosystem.
Featured image from Pexels, chart from TradingView
BNB price is attempting a fresh increase from the $545 zone. The price could gain bullish momentum if it clears the $585 and $590 resistance levels.
After a downside correction from $620, BNB price found support near the $545 zone. A low was formed at $546.1 and the price started a fresh increase, unlike Ethereum and Bitcoin.
There was a move above the $560 and $565 resistance levels. The bulls pushed the price above the 23.6% Fib retracement level of the downward move from the $619 swing high to the $546 low. The price is now trading above $560 and the 100 simple moving average (4 hours).
Immediate resistance is near the $585 level. There is also a key contracting triangle forming with resistance near $585 on the 4-hour chart of the BNB/USD pair. It is close to the 50% Fib retracement level of the downward move from the $619 swing high to the $546 low.
Source: BNBUSD on TradingView.com
The next resistance sits near the $590 level. A clear move above the $590 zone could send the price further higher. In the stated case, BNB price could test $620. A close above the $620 resistance might set the pace for a larger increase toward the $640 resistance. Any more gains might call for a test of the $700 level in the coming days.
If BNB fails to clear the $590 resistance, it could start another decline. Initial support on the downside is near the $555 level and the trend line.
The next major support is near the $545 level. The main support sits at $532. If there is a downside break below the $532 support, the price could drop toward the $500 support. Any more losses could initiate a larger decline toward the $465 level.
Technical Indicators
4-Hours MACD – The MACD for BNB/USD is gaining pace in the bullish zone.
4-Hours RSI (Relative Strength Index) – The RSI for BNB/USD is currently above the 50 level.
Major Support Levels – $555, $545, and $532.
Major Resistance Levels – $585, $590, and $620.
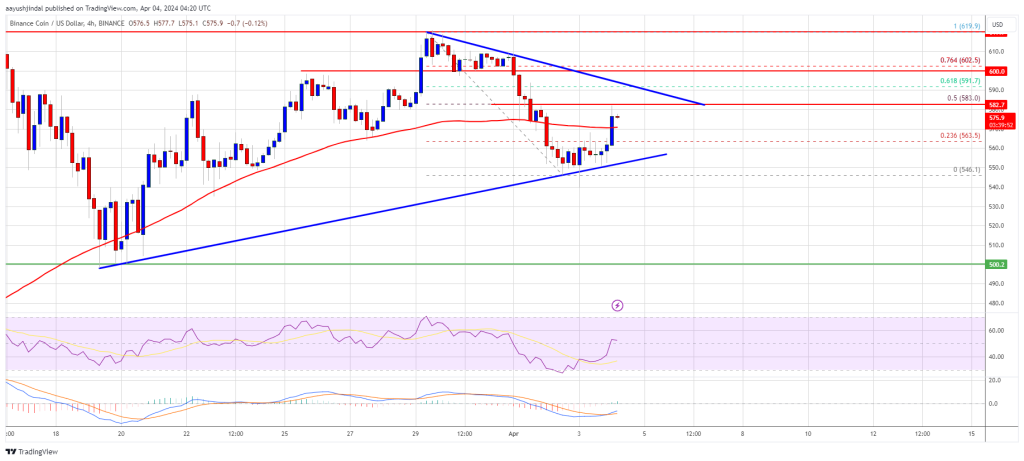
BNB price is attempting a fresh increase from the $500 zone. The price could gain bullish momentum if it clears the $588 and $610 resistance levels.
After a downside correction from $645, BNB price found support near the $500 zone. A low was formed at $498 and the price started a fresh increase, like Ethereum and Bitcoin.
There was a move above the $520 and $550 resistance levels. The bulls pushed the price above the 50% Fib retracement level of the downward move from the $645 swing high to the $498 low. The price is now trading above $575 and the 100 simple moving average (4 hours).
There is also a key bullish trend line forming with support near $580 on the 4-hour chart of the BNB/USD pair. Immediate resistance is near the $588 level. It is close to the 61.8% Fib retracement level of the downward move from the $645 swing high to the $498 low.
Source: BNBUSD on TradingView.com
The next resistance sits near the $610 level. A clear move above the $610 zone could send the price further higher. In the stated case, BNB price could test $645. A close above the $645 resistance might set the pace for a larger increase toward the $680 resistance. Any more gains might call for a test of the $700 level in the coming days.
If BNB fails to clear the $610 resistance, it could start another decline. Initial support on the downside is near the $580 level and the trend line.
The next major support is near the $560 level. The main support sits at $540. If there is a downside break below the $540 support, the price could drop toward the $500 support. Any more losses could initiate a larger decline toward the $450 level.
Technical Indicators
4-Hours MACD – The MACD for BNB/USD is gaining pace in the bullish zone.
4-Hours RSI (Relative Strength Index) – The RSI for BNB/USD is currently above the 50 level.
Major Support Levels – $580, $560, and $540.
Major Resistance Levels – $598, $610, and $640.
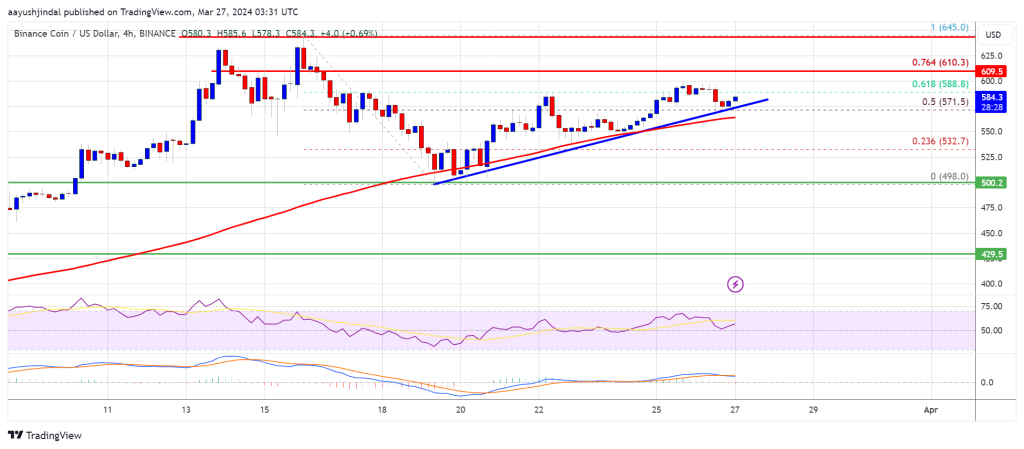
BNB price rallied further above $600 before it faced sellers. The price corrected gains and now testing an important support at $500.
In the last BNB price prediction, we discussed the chances of more gains above the $550 resistance zone. The price continued to rise and broke many hurdles near the $580 level.
BNB even outperformed Bitcoin and Ethereum with a move above the $600 resistance. Finally, it faced resistance near the $645 zone. A high was formed near $645 and the price recently started a downside correction. There was a move below the $600 level.
The price declined below the 23.6% Fib retracement level of the upward move from the $365 swing low to the $645 high. The price is now trading near $515 and the 100 simple moving average (4 hours). Immediate resistance is near the $520 level.
There is also a key bearish trend line forming with resistance near $520 on the 4-hour chart of the BNB/USD pair. The next resistance sits near the $550 level. A clear move above the $550 zone could send the price further higher.
Source: BNBUSD on TradingView.com
In the stated case, BNB price could test $580. A close above the $580 resistance might set the pace for a larger increase toward the $600 resistance. Any more gains might call for a test of the $645 level in the coming days.
If BNB fails to clear the $520 resistance, it could continue to move down. Initial support on the downside is near the $500 level or the 50% Fib retracement level of the upward move from the $365 swing low to the $645 high.
The next major support is near the $470 level. The main support sits at $430. If there is a downside break below the $430 support, the price could drop toward the $400 support. Any more losses could initiate a larger decline toward the $350 level.
Technical Indicators
4-Hours MACD – The MACD for BNB/USD is gaining pace in the bearish zone.
4-Hours RSI (Relative Strength Index) – The RSI for BNB/USD is currently below the 50 level.
Major Support Levels – $500, $470, and $430.
Major Resistance Levels – $520, $550, and $580.
BNB price is gaining bullish momentum above the $550 resistance. The price is showing positive signs and might extend its rally above $650.
In the last BNB price prediction, we discussed the chances of more gains above the $500 resistance zone. The price continued to rise and broke many hurdles near the $550 level.
BNB is now outperforming Bitcoin and Ethereum with a move above the $580 resistance. It is up over 10% today and trading above $600. A high was formed near $633 and the price is now consolidating gains. It is trading above the 23.6% Fib retracement level of the upward move from the $364 swing low to the $633 high.
The price is now trading above $600 and the 100 simple moving average (4 hours). Immediate resistance is near the $625 level. The next resistance sits near the $635 level. A clear move above the $635 zone could send the price further higher.
Source: BNBUSD on TradingView.com
In the stated case, BNB price could test $650. A close above the $650 resistance might set the pace for a larger increase toward the $700 resistance. Any more gains might call for a test of the $780 level in the coming days.
If BNB fails to clear the $635 resistance, it could start a downside correction. Initial support on the downside is near the $600 level and the trend line.
The next major support is near the $570 level. The main support sits at $500 or the 50% Fib retracement level of the upward move from the $364 swing low to the $633 high. If there is a downside break below the $500 support, the price could drop toward the $450 support. Any more losses could initiate a larger decline toward the $420 level.
Technical Indicators
4-Hours MACD – The MACD for BNB/USD is gaining pace in the bullish zone.
4-Hours RSI (Relative Strength Index) – The RSI for BNB/USD is currently above the 50 level.
Major Support Levels – $600, $570, and $500.
Major Resistance Levels – $635, $650, and $700.
Bitcoin, the world’s largest cryptocurrency asset, has finally entered a new price threshold, surpassing its previous all-time high (ATH) of $69,000, accomplished nearly three ago.
Following the latest milestone, crypto enthusiasts and experts are very bullish on the digital asset, predicting further upward movement to unprecedented heights in the upcoming months.
Cryptocurrency analyst Doctor Profit has shared a positive forecast for BTC with the crypto community on the social media platform X. His analysis, tagged “Big Sunday Report,” delves into the next step that BTC is expected to take amid the general market optimism.
Doctor Profit’s projection is based on Technical Analysis (TA), Life-Cycle-Assessment (LCA), and Psychological analysis. Drawing attention to a previous forecast, Doctor Profit stated that a breakout above $48,500 would send the price “all the way to the old ATH very quickly.”
Interestingly, this took place in a matter of weeks, at a swift pace. He highlighted that the breakout, which sent Bitcoin to exactly $60,000 as predicted weeks earlier, signaled the start of the “Golden bull phase.”
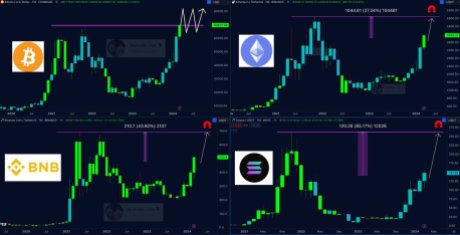
According to the analyst, any movement in the range of “$48,500 to $70,000” right now is considered to be in the golden bull market. Meanwhile, “anything above $72,000” marks the beginning of the “Super Cycle Phase,” indicated by “significant green candle returns and surges.”
The expert is confident that before the asset goes higher, it will maintain a “movement inside the golden bull and super cycle.” Specifically, these sideways movements will go on for a while, primarily between “$60,000 (Golden Bull area) and $80,000 (Super Cycle area).”
Doctor Profit noted that the movement is not because Bitcoin seems weak or needs to be corrected. Instead, its rally was very swift making it difficult for big market cap altcoins to keep up with the crypto asset.
Despite Bitcoin reaching a new peak, major altcoins like ETH, BNB, or SOL still have not been able to record significant inflows, suggesting a pending activation of a robust altcoin market.
So far, Doctor Profit expects Bitcoin to move in four distinct phases in this upcoming bull run. The experts underlined the first aspect, “signifying the conclusion of the bear market,” was between $16,000 and $25,000.
He explains that the next phase, the “pre-bull market,” comprises two aspects. According to the analyst, the initial pre-bull step opened up “between $25,000 and $38,500,” while the second stretched between “$38,000 to $48,000.”
Meanwhile, from “$48,000 to $70,000 is when the golden bull phase began.” This, he expects, to lead to the Super Cycle area that will “last from $72,500 to unprecedented levels.”
Currently, the price of Bitcoin has increased by over 3% in the last 24 hours, trading at $72,139. Its trading volume and market cap are also showing strength, rising by 78% and 3% respectively.
BNB price is gaining bullish momentum above the $450 resistance. The price is signaling a strong uptrend and might soon surpass the $500 resistance.
In the last BNB price prediction, we discussed the chances of more gains above the $400 resistance zone. The bulls did remain active and were able to push the price above the $400 level.
BNB is now outperforming Bitcoin and Ethereum with a move above the $450 resistance. There was a break above a connecting trend line with resistance at $430 on the 4-hour chart of the BNB/USD pair. It is up over 10% today and trading above $470.
A high was formed near $478 and the price is now consolidating gains. It is trading above the 23.6% Fib retracement level of the upward move from the $364 swing low to the $478 high.
The price is now trading above $465 and the 100 simple moving average (4 hours). Immediate resistance is near the $475 level. The next resistance sits near the $488 level. A clear move above the $488 zone could send the price further higher.
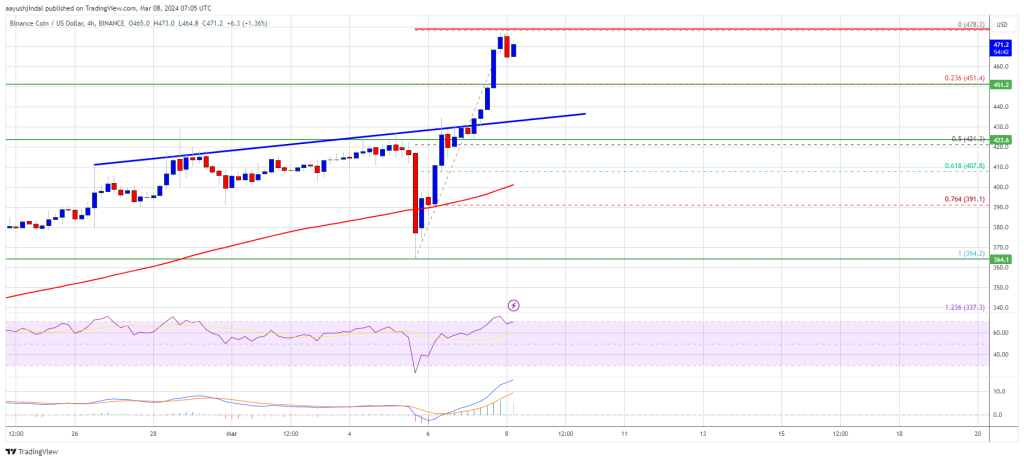
Source: BNBUSD on TradingView.com
In the stated case, BNB price could test $500. A close above the $500 resistance might set the pace for a larger increase toward the $520 resistance. Any more gains might call for a test of the $542 level in the coming days.
If BNB fails to clear the $475 resistance, it could start a downside correction. Initial support on the downside is near the $4620 level.
The next major support is near the $450 level. The main support sits at $420 or the 50% Fib retracement level of the upward move from the $364 swing low to the $478 high. If there is a downside break below the $420 support, the price could drop toward the $400 support. Any more losses could initiate a larger decline toward the $380 level.
Technical Indicators
4-Hours MACD – The MACD for BNB/USD is gaining pace in the bullish zone.
4-Hours RSI (Relative Strength Index) – The RSI for BNB/USD is currently above the 50 level.
Major Support Levels – $460, $450, and $420.
Major Resistance Levels – $475, $500, and $520.
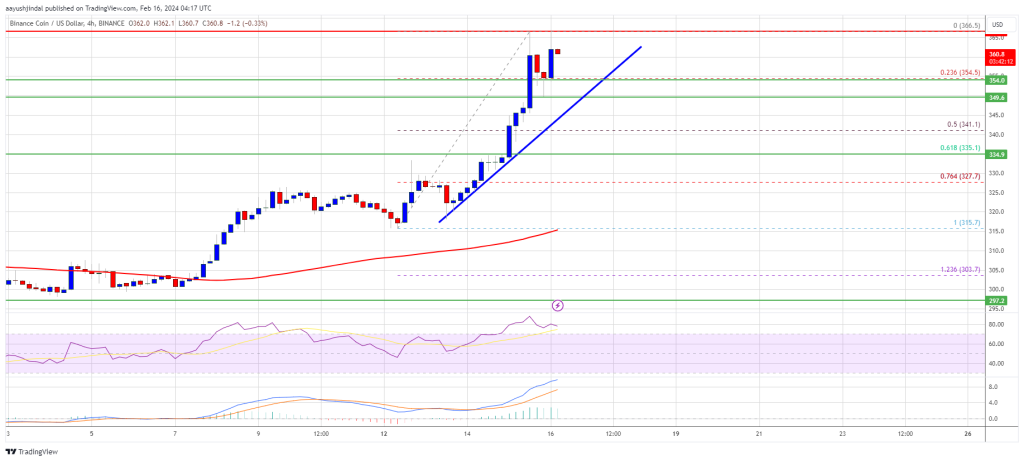
BNB price is gaining bullish momentum above the $350 resistance. The price looks set for more gains above the $400 resistance in the near term.
In the last BNB price prediction, we discussed the chances of more gains above the $365 resistance zone. The bulls did remain active and were able to push the price above the $375 level.
BNB outperformed Bitcoin and Ethereum with a move above the $380 resistance. A high was formed near $390 and the price is now consolidating gains. It is trading above the 23.6% Fib retracement level of the upward move from the $345 swing low to the $390 high.
The price is now trading above $375 and the 100 simple moving average (4 hours). There is also a key bullish trend line forming with support at $380 on the 4-hour chart of the BNB/USD pair.
Source: BNBUSD on TradingView.com
Immediate resistance is near the $390 level. The next resistance sits near the $392 level. A clear move above the $392 zone could send the price further higher. In the stated case, BNB price could test $400. A close above the $400 resistance might set the pace for a larger increase toward the $422 resistance. Any more gains might call for a test of the $500 level in the coming weeks.
If BNB fails to clear the $390 resistance, it could start a downside correction. Initial support on the downside is near the $380 level and the trend line.
The next major support is near the $362 level or the 61.8% Fib retracement level of the upward move from the $345 swing low to the $390 high. The main support sits at $350. If there is a downside break below the $350 support, the price could drop toward the $335 support. Any more losses could initiate a larger decline toward the $315 level.
Technical Indicators
4-Hours MACD – The MACD for BNB/USD is gaining pace in the bullish zone.
4-Hours RSI (Relative Strength Index) – The RSI for BNB/USD is currently above the 50 level.
Major Support Levels – $380, $362, and $350.
Major Resistance Levels – $390, $400, and $422.
In a significant development for the Binance Smart Chain (BSC) ecosystem, Aave (AAVE), one of the largest decentralized finance (DeFi) market protocols, has announced its integration with BNB Smart Chain. Aave joins prominent projects such as Uniswap, Ambit Finance, PancakeSwap, and Lista DAO.
According to the announcement, this latest development opens up new opportunities for BNB Chain users, giving them access to what the protocol calls “top-tier lending platforms” and enhanced liquidity.
With the launch of First Digital USD (FDUSD), users can now leverage “robust” liquidity, allowing them to explore different applications and opportunities in the Binance ecosystem.
On the other hand, Aave users can now benefit from BNB Chain’s fees and the ability to integrate with one of the largest DeFi ecosystems, fostering increased collaboration between the two communities. The announcement also noted the following about the Aave integration:
This not only complements but strategically aligns with BNB Chain’s 2024 outlook. Focused on mass adoption, high-frequency DeFi applications, and network efficiency improvements, the ecosystem is set for an exciting evolution.
Looking ahead, BNB Chain has set numerous goals for 2024. The introduction of opBNB – the Layer 2 (L2) scaling solution for the BNB Smart Chain – aims to achieve a transaction processing capacity of 10,000 transactions per second (TPS) by doubling the gas limit to 200 M/s.
Enhanced security measures accompany this increase in capacity through multi-proof mechanisms. In addition, implementing Ethereum’s EIP4844 and Greenfield’s data availability upgrades will reduce gas fees by 5-10 times, providing users with a more cost-effective experience.
In a move called “BNB Chain Fusion,” the BNB Beacon Chain will be merged with the BSC, further enhancing the efficiency and security of the network. The expansion of the number of validators, which will increase from 40 to 100 by 2024, is also expected to contribute to the stability of the network.
Market Cap And Token Holders On The Rise
According to Token Terminal data, the BNB chain has experienced significant growth, evidenced by several key metrics.
One notable metric is the fully diluted market cap, which stands at $75.71 billion, representing a significant increase of 23.9% over the past 30 days, highlighting the confidence in the protocol.
The circulating market cap, another crucial indicator, currently sits at $54.73 billion, showing a solid 11.6% growth over the same 30-day period.
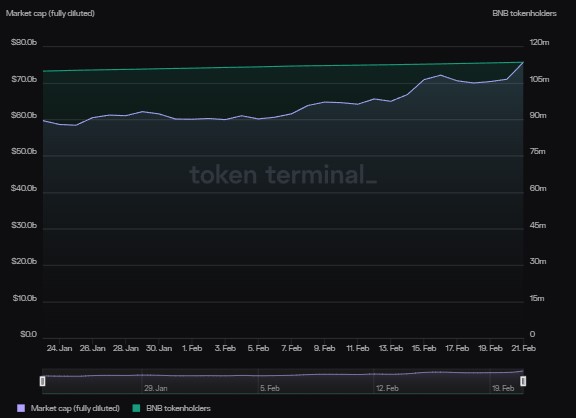
On the other hand, the number of BNB token holders has shown a positive trend, reaching 113.51 million, with a significant increase of 3.5% in the last 30 days, demonstrating interest in the ecosystem.
Featured image from Shutterstock, chart from TradingView.com
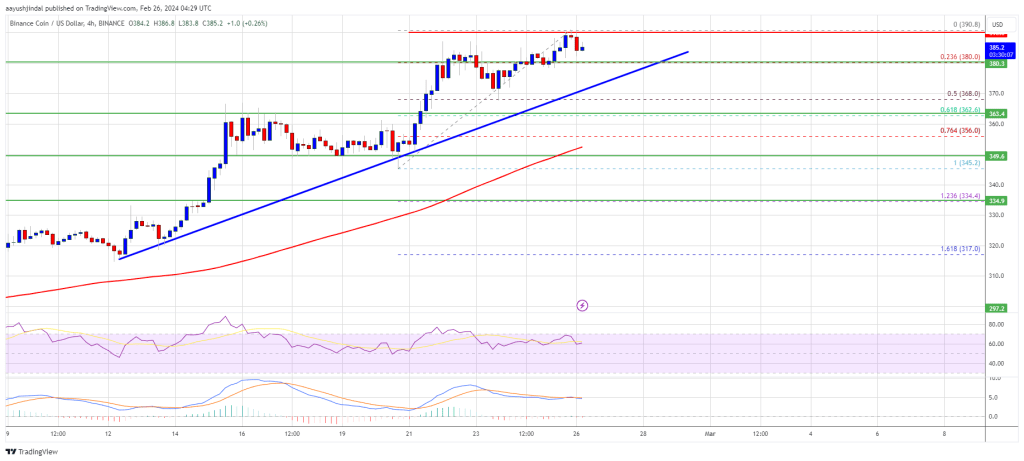
BNB price is gaining bullish momentum from the $315 support zone. The price could extend its rally above $375 and rise toward the $400 level in the near term.
In the past few days, BNB price started a decent increase and cleared the $335 resistance zone. There was a move above the $350 level to move into a positive zone, like Bitcoin and Ethereum.
The price even spiked above $365. A high was formed near $366 and the price is now consolidating gains above the 23.6% Fib retracement level of the upward move from the $315 swing low to the $366 high. BNB is now trading above $355 and the 100 simple moving average (4 hours).
There is also a key bullish trend line forming with support at $354 on the 4-hour chart of the BNB/USD pair. Immediate resistance is near the $365 level.
Source: BNBUSD on TradingView.com
The next resistance sits near the $375 level. A clear move above the $375 zone could send the price further higher. In the stated case, BNB price could test $388. A close above the $388 resistance might set the pace for a larger increase toward the $400 resistance. Any more gains might call for a test of the $420 level.
If BNB fails to clear the $365 resistance, it could start a downside correction. Initial support on the downside is near the $355 level and the trend line.
The next major support is near the $342 level or the 50% Fib retracement level of the upward move from the $315 swing low to the $366 high. The main support sits at $335. If there is a downside break below the $335 support, the price could drop toward the $322 support. Any more losses could initiate a larger decline toward the $315 level.
Technical Indicators
4-Hours MACD – The MACD for BNB/USD is gaining pace in the bullish zone.
4-Hours RSI (Relative Strength Index) – The RSI for BNB/USD is currently above the 50 level.
Major Support Levels – $355, $342, and $335.
Major Resistance Levels – $365, $375, and $388.
BNB price is attempting a fresh increase from the $288 zone. The price could start a fresh rally if there is a clear move above the $310 resistance.
In the past few days, BNB price started a decent increase and cleared the $300 resistance zone, unlike Bitcoin and Ethereum. There was a move above the $305 level before the bears appeared.
A high was formed near $313 and the price recently started a downside correction. There was a move below the $308 level. The price declined below the 50% Fib retracement level of the upward move from the $287 swing low to the $313 high.
BNB is now consolidating near $305 and the 100 simple moving average (4 hours). Immediate resistance is near the $308 level. There is also a key bearish trend line forming with resistance near $306 on the 4-hour chart of the BNB/USD pair.
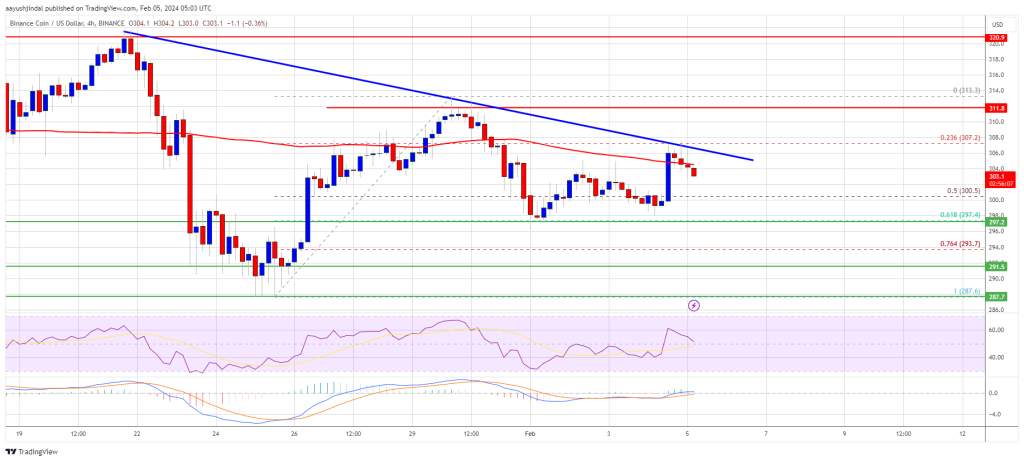
Source: BNBUSD on TradingView.com
The next resistance sits near the $310 level. A clear move above the $310 zone could send the price further higher. In the stated case, BNB price could test $320. A close above the $320 resistance might set the pace for a larger increase toward the $335 resistance. Any more gains might call for a test of the $350 level.
If BNB fails to clear the $310 resistance, it could continue to move down. Initial support on the downside is near the $300 level. The next major support is near the $292 level or the 76.4% Fib retracement level of the upward move from the $287 swing low to the $313 high.
The main support sits at $288. If there is a downside break below the $288 support, the price could drop toward the $275 support. Any more losses could initiate a larger decline toward the $262 level.
Technical Indicators
4-Hours MACD – The MACD for BNB/USD is losing pace in the bullish zone.
4-Hours RSI (Relative Strength Index) – The RSI for BNB/USD is currently above the 50 level.
Major Support Levels – $300, $292, and $288.
Major Resistance Levels – $308, $310, and $320.


