BNB price is attempting a fresh increase from the $545 zone. The price could gain bullish momentum if it clears the $585 and $590 resistance levels.
- BNB price started a fresh increase after it found support near the $545 zone.
- The price is now trading above $560 and the 100 simple moving average (4 hours).
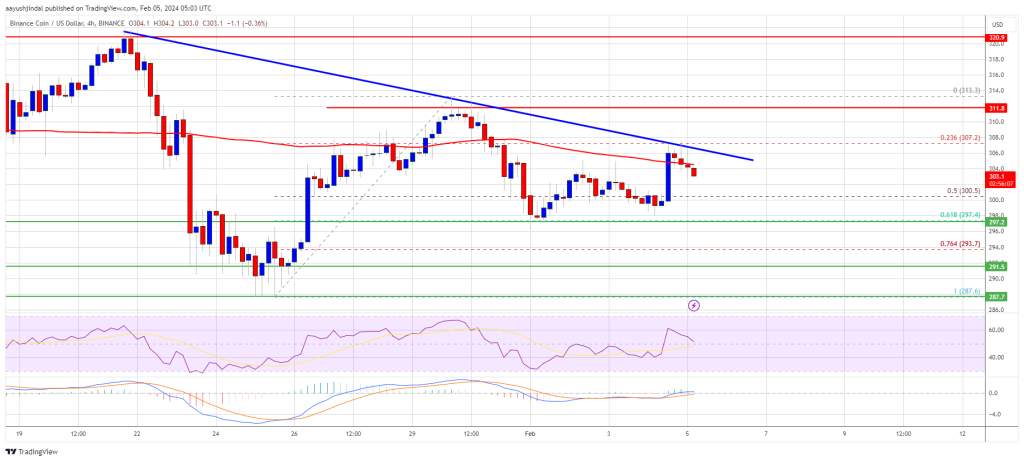
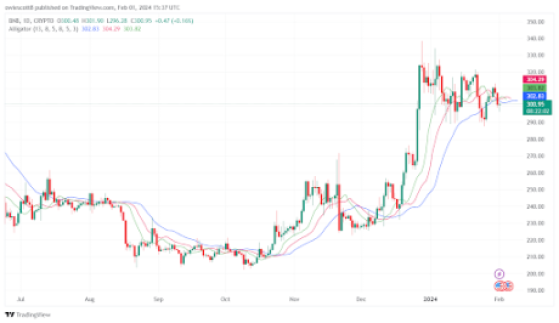
- There is a key contracting triangle forming with resistance near $585 on the 4-hour chart of the BNB/USD pair (data source from Binance).
- The pair could attempt a fresh rally if it clears the $590 resistance zone.
BNB Price Eyes Fresh Surge
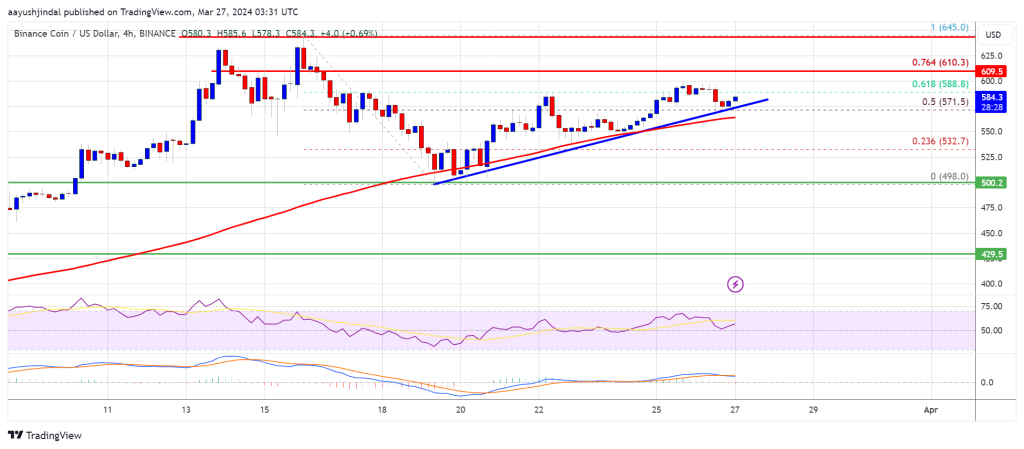
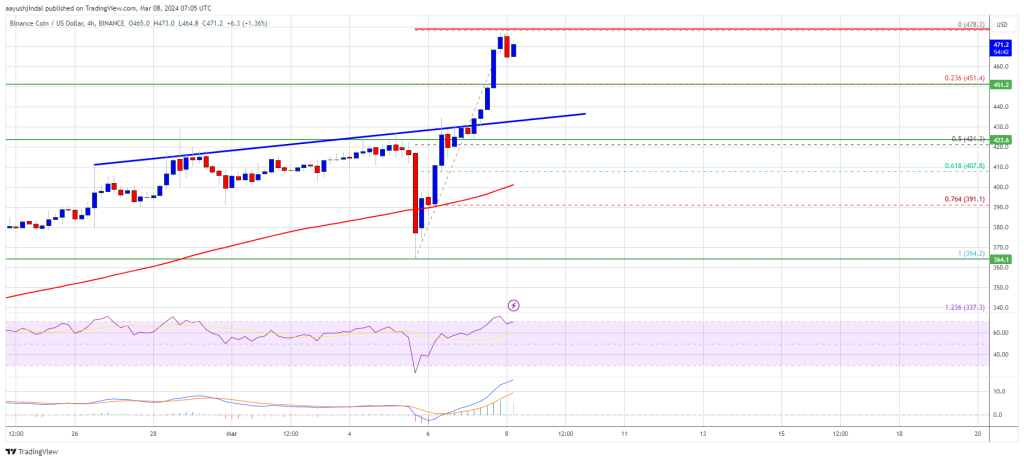
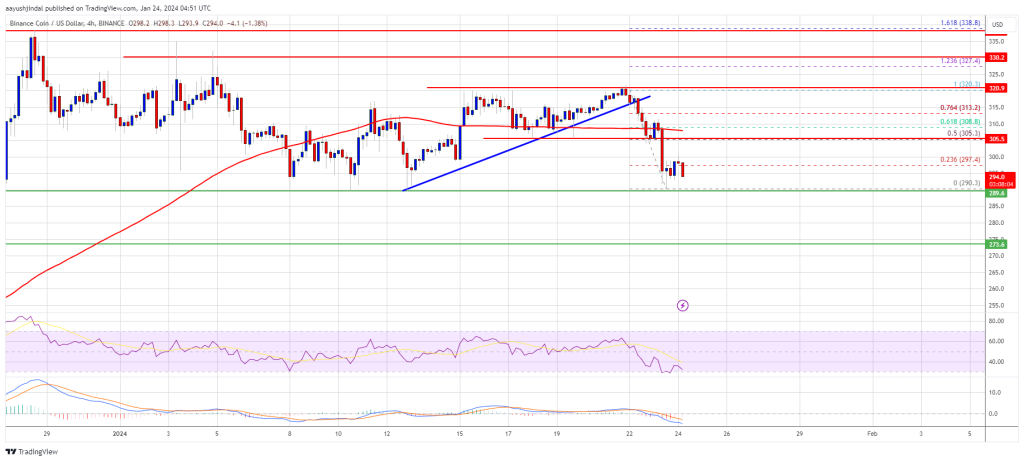
After a downside correction from $620, BNB price found support near the $545 zone. A low was formed at $546.1 and the price started a fresh increase, unlike Ethereum and Bitcoin.
There was a move above the $560 and $565 resistance levels. The bulls pushed the price above the 23.6% Fib retracement level of the downward move from the $619 swing high to the $546 low. The price is now trading above $560 and the 100 simple moving average (4 hours).
Immediate resistance is near the $585 level. There is also a key contracting triangle forming with resistance near $585 on the 4-hour chart of the BNB/USD pair. It is close to the 50% Fib retracement level of the downward move from the $619 swing high to the $546 low.
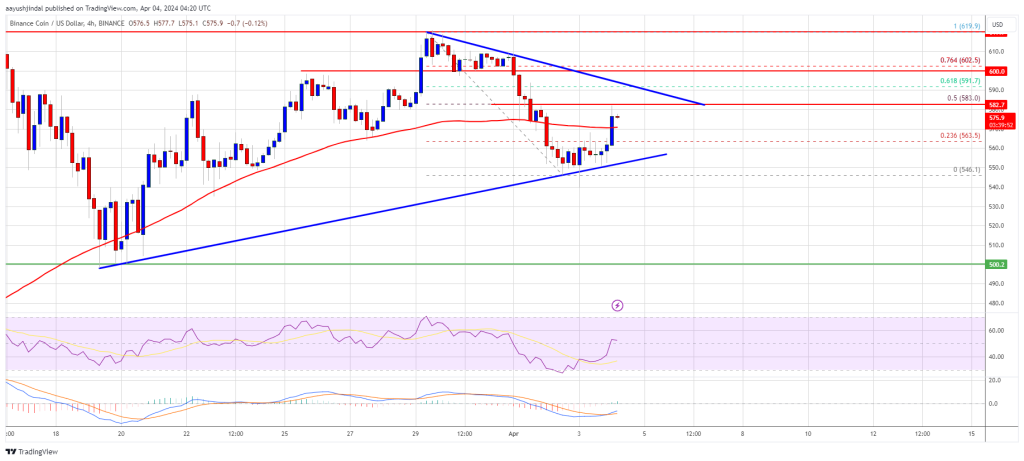
Source: BNBUSD on TradingView.com
The next resistance sits near the $590 level. A clear move above the $590 zone could send the price further higher. In the stated case, BNB price could test $620. A close above the $620 resistance might set the pace for a larger increase toward the $640 resistance. Any more gains might call for a test of the $700 level in the coming days.
Another Decline?
If BNB fails to clear the $590 resistance, it could start another decline. Initial support on the downside is near the $555 level and the trend line.
The next major support is near the $545 level. The main support sits at $532. If there is a downside break below the $532 support, the price could drop toward the $500 support. Any more losses could initiate a larger decline toward the $465 level.
Technical Indicators
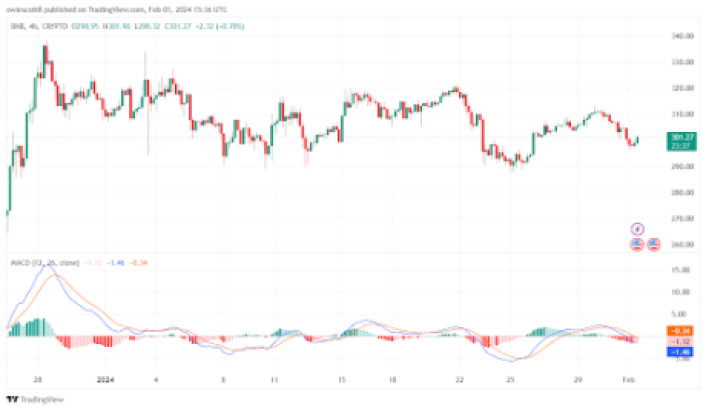
4-Hours MACD – The MACD for BNB/USD is gaining pace in the bullish zone.
4-Hours RSI (Relative Strength Index) – The RSI for BNB/USD is currently above the 50 level.
Major Support Levels – $555, $545, and $532.
Major Resistance Levels – $585, $590, and $620.