Newbie Bitcoin Whales Buying 200,000 BTC Per Week, Data Shows

On-chain data suggests demand for Bitcoin remains significant as newcomer whales in the sector have been scooping up 200,000 BTC every week.

Short-Term Holder Bitcoin Whales Have Continued To Accumulate Recently

As explained by CryptoQuant author Axel Adler Jr in a post on X, the demand among the short-term holder whales has decreased since the all-time high, although it still continues to remain strong.

The “short-term holders” (STHs) refer to the Bitcoin investors who have been holding onto their coins since less than 155 days ago. This cohort includes the new investors in the market, as well as the fickle-minded traders who make moves often and don’t tend to HODL.

The investors who make it past the 155-day threshold are put inside the “long-term holders” (LTHs), which is a group that’s generally considered to reflect the resolute side of the sector.

In the context of the current discussion, the investors of interest aren’t the ordinary STHs, but rather the humongous entities called whales. Formally, these investors are defined as those holding more than 1,000 BTC in their wallets.

At the current exchange rate, this lower limit is worth $61.5 million, which is massive indeed. Whales can be influential beings on the network because of these large holdings, so their behavior can be something worth keeping an eye on.

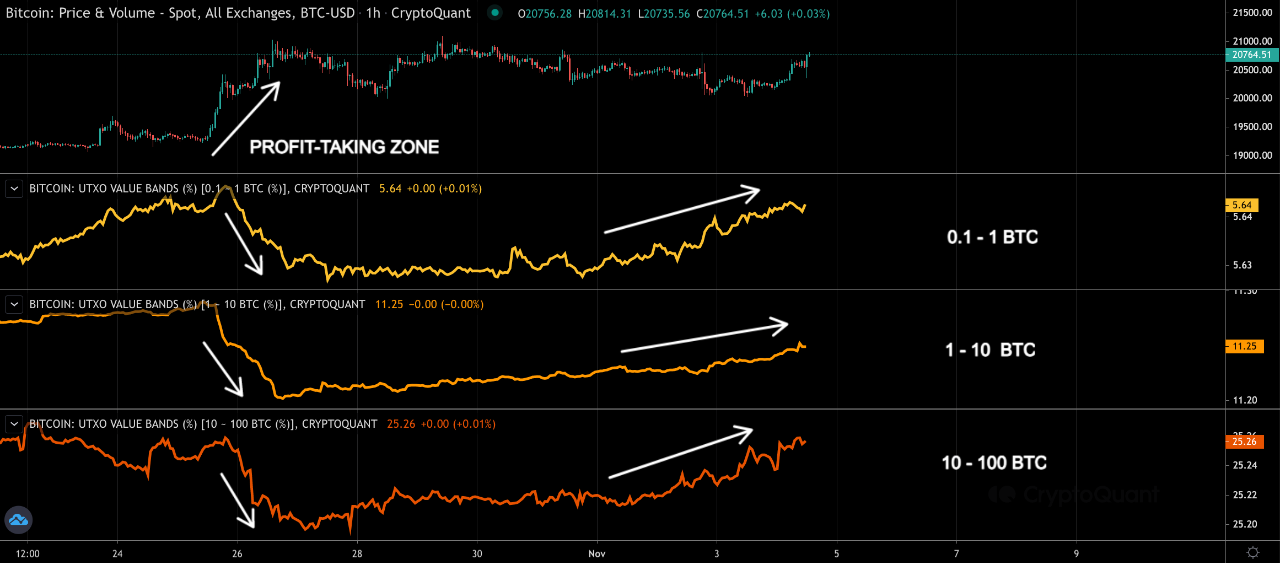
The STH whales would naturally correspond to the large holders who only bought within the past five months. Here is a chart that shows the trend in the exchange outflows being made by these new whales in the Bitcoin market over the last few years:

Bitcoin STH Whale

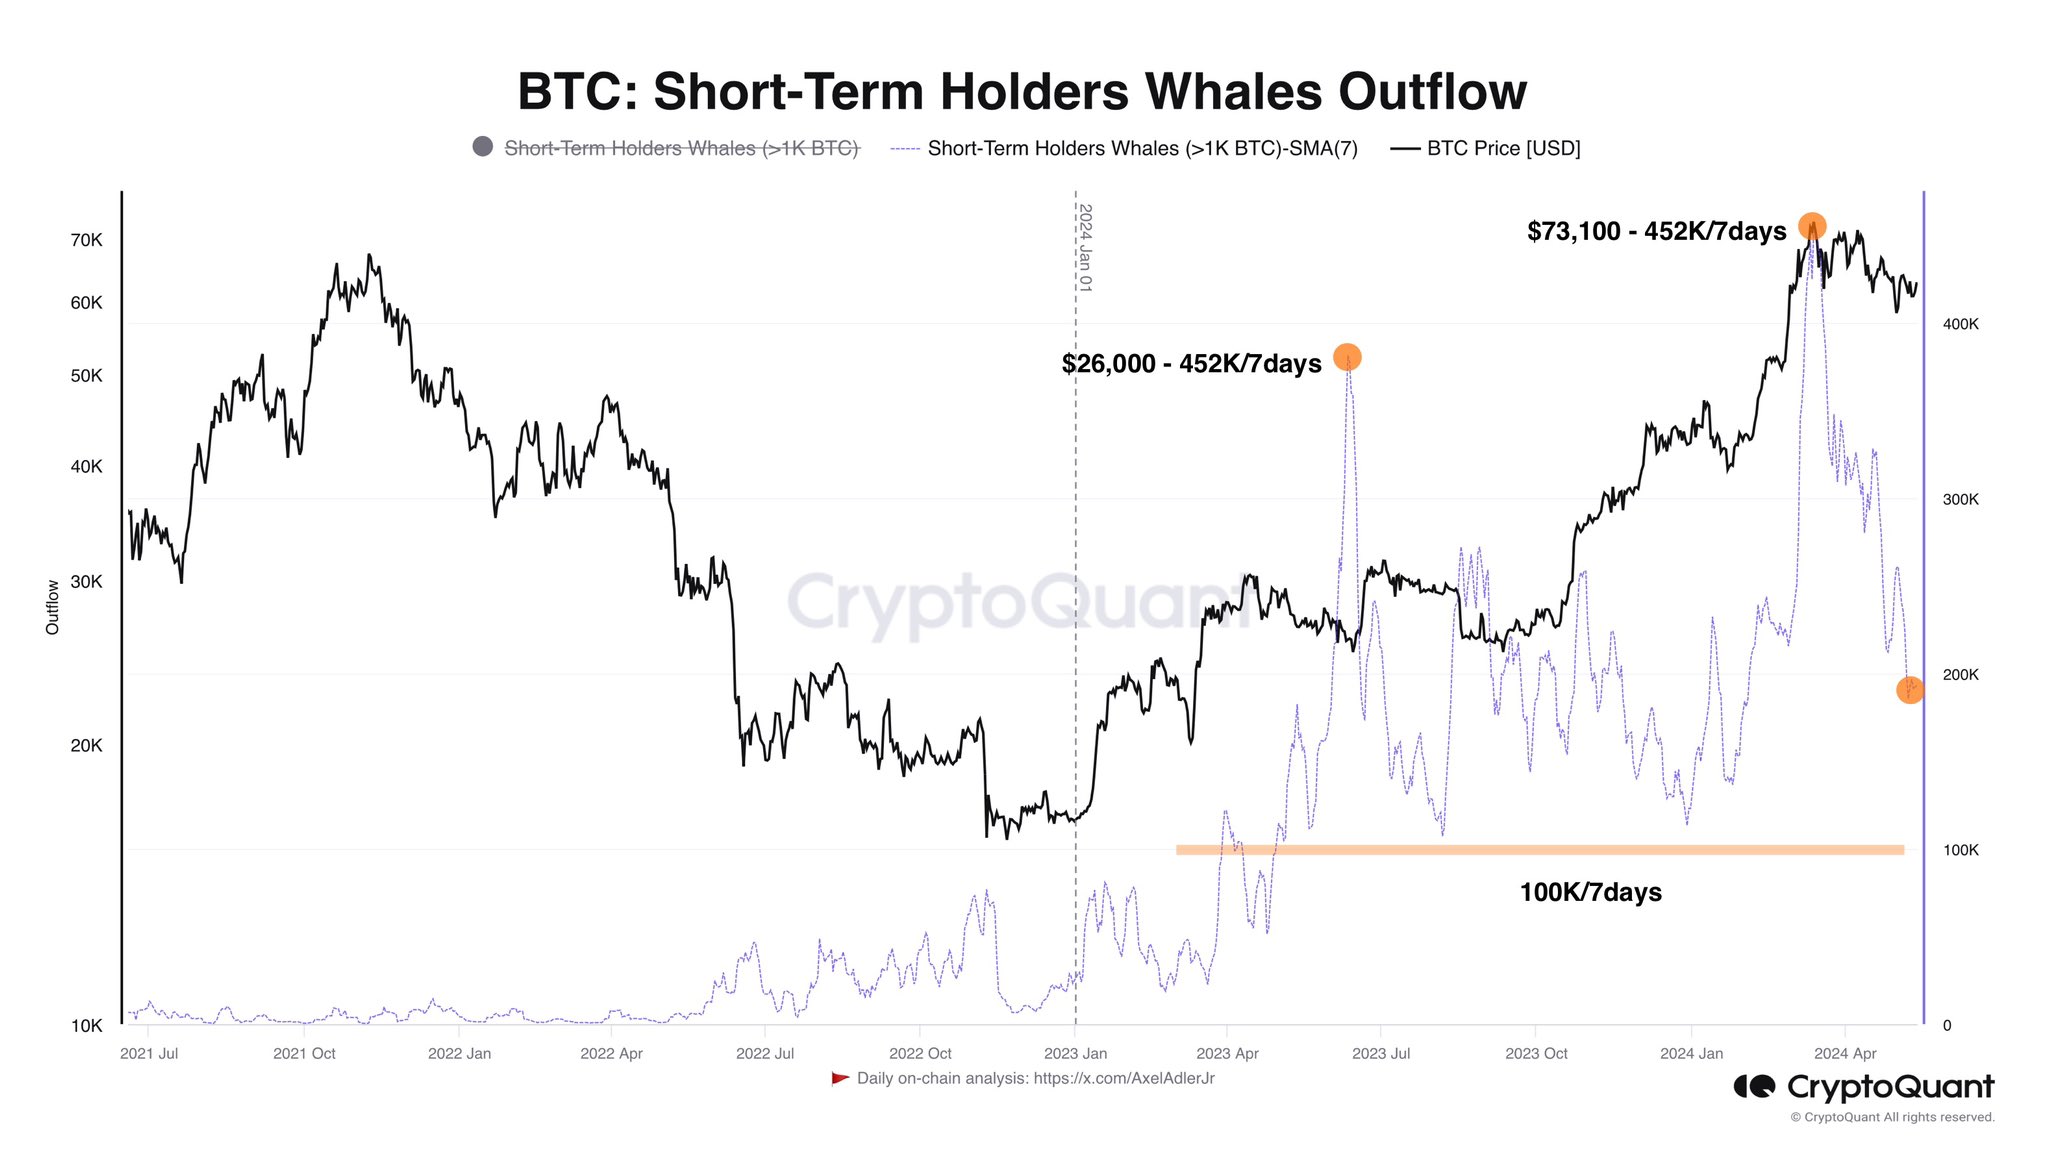
As displayed in the above graph, the 7-day simple moving average (SMA) of the Bitcoin STH whale exchange outflows had spiked to pretty high levels earlier in the year, when the rally towards the new all-time high (ATH) price had taken place.

Naturally, this spike would suggest demand for buying the cryptocurrency was high from new whale investors entering the space. At the peak, the indicator implied accumulation was occurring at the rate of a whopping 452,000 BTC per week.

A part of this buying would correspond to the demand coming in from the spot exchange-traded funds (ETFs) – new investment vehicles for Bitcoin only approved at the start of this year that provide for an indirect way to invest into the asset in a format that may be preferrable for the more traditional investors.

From the chart, it’s visible that the demand from the new whales has seen a clear decline in the period since the ATH, but accumulation nonetheless remains substantial as the STH whales are still potentially buying at a rate of around 200,000 BTC per week.

BTC Price

Bitcoin has continued to be stagnant recently as its price is trading around $61,600 right now, still very much inside the range.

Bitcoin Price Chart

Bitcoin Whales Continue Buying, Now Hold 25.16% Of All Supply

On-chain data shows that the Bitcoin whales’ holdings have grown to 25.16% of the entire supply, and their net accumulation has continued recently.

Bitcoin Investors With 1,000 To 10,000 BTC Have Continued To Buy Recently

According to data from the on-chain analytics firm Santiment, the BTC whales have accumulated more than 266,000 BTC since the start of the year. The indicator of interest here is the “Supply Distribution,” which keeps track of the percentage of the total circulating Bitcoin supply that the various wallet groups are holding right now.

The addresses are divided into these cohorts based on the number of coins they currently have in their balance. The 10 to 100 coins group, for example, includes all wallets that own at least 10 and, at most, 100 BTC.

The Supply Distribution sums up the amount that investors belonging to a particular group as a whole are carrying and calculates what percentage of the supply they contribute.

The 1,000 to 10,000 BTC cohort is of interest in the current discussion. At the current exchange rate, the lower limit for this cohort is $65 million, while the upper one is $650 million.

Clearly, the investors belonging to the group are quite massive, and as such, they are popularly known as “whales.” As the whales can quickly move large amounts, they have the potential to influence the market. Due to this, their behavior can be worth watching.

There are whales beyond this cohort’s 10,000 BTC upper limit as well, but at such massive scales, entities like exchanges also start coming into play, who aren’t exactly normal investors.

Now, here is a chart that shows the trend in the Bitcoin Supply Distribution for the 1,000 to 10,000 coins group over the last few months:

Bitcoin Whale & Sentiment

As displayed in the above graph, the Bitcoin Supply Distribution for this key investor group has observed a net rise over the year 2024 so far. The whales have bought 266,000 BTC ($17.2 billion) over this period.

However, this accumulation hasn’t been consistent. As is visible in the chart, the whales sold into the rally that would eventually lead to the asset’s new all-time high, and they bought back in once the drawdown was over.

As BTC has consolidated, so has its supply. Still, the latest change in the metric has been towards the upside, implying that these humongous holders are perhaps backing the current recovery push.

Following the latest accumulation, the 1,000 to 10,000 coins group holds 25.16% of the supply, which means that more than a quarter of all Bitcoin in circulation is sitting in the wallets of these large investors.

While whale buying is bullish, the current investor sentiment may not be so. As the data for the “Weighted Sentiment” metric attached by Santiment in the chart suggests, investors are currently showing FOMO towards the asset.

Historically, Bitcoin has tended to move against the majority’s expectations, so FUD/fear has been ideal for uptrends to start. FOMO/greed, on the other hand, has been where tops have become probable.

BTC Price

At the time of writing, Bitcoin is trading at around $64,700, up more than 7% over the past week.

Bitcoin Price Chart

Bitcoin Mega Whales Are Buying, Time For Rally To Return?

On-chain data shows that the largest number of investors in the Bitcoin market are finally buying, which could be bullish for the asset’s value.

Bitcoin Mega Whales Have Shown Net Inflows In The Past Day

In the past few weeks, the Bitcoin price has struggled to mount any significant bullish momentum as it has been stuck consolidating inside a range.

Earlier, while this was happening, the largest holders in the space had been sitting quietly, not buying or selling anything notable. According to data from the market intelligence platform IntoTheBlock, however, this appears to have changed in the past day.

Relevant holders here are the “Large Holders,” who, as defined by the analytics firm, are investors carrying at least 0.1% of the entire circulating Bitcoin supply in their wallets.

A little under 19.7 million tokens are circulating for the cryptocurrency, 0.1% of which would be 19,700 BTC. This amount is worth more than $1.26 billion at the current exchange rate of BTC.

Clearly, these large holders are quite large indeed, and in fact, they are much larger than the usual whale investors, who typically carry between 1,000 and 10,000 BTC. As such, it would perhaps be apt to call these humongous entities “mega whales.”

Since an investor’s influence in the market increases the larger their holdings, these mega whales would be the most powerful entities on the Bitcoin network. Therefore, their moves can have some consequences for the wider market.

IntoTheBlock has used the netflow on-chain indicator to track the movements of the Large Holders here, which measures the net amount of BTC entering or exiting the wallets of these investors.

The below chart shows the trend in this metric over the last few months:

Bitcoin Large Holder Netflow

As displayed in the above graph, the Bitcoin Large Holders netflow registered a notable positive spike yesterday, meaning these investors have received a net amount of coins into their wallets. The mega whales bought 19,760 BTC during this spike, worth more than $1.27 billion.

“Historically, accumulations by these addresses have often preceded rises in Bitcoin’s price,” notes the analytics firm. The chart shows that some extraordinary buys came from this cohort on the way to the new all-time high for the asset.

As such, it’s possible that these latest buys will also help the asset gain some bullish momentum in the near future. However, something to note is that the scale of the latest spike, although large on its own, isn’t quite as prominent as that of some of the large buys seen earlier.

BTC Price

At the time of writing, Bitcoin is trading at around $64,500, down more than 5% over the past week.

Bitcoin Price Chart

Bitcoin Dips Are For Buying: BTC Sees Record-Breaking Accumulation

Bitcoin is currently experiencing a retracement after rising to as high as $53,000 on February 20. This recent dip has, however, not deterred Bitcoin whales, with these investors rather seeing it as an opportunity to accumulate more of the flagship crypto token

Inflows To Accumulation Addresses Hit All-Time High

Ki Young Ju, the founder and CEO of the on-chain analytics platform Crypto Quant, revealed in an X (formerly Twitter) post that inflows into accumulation addresses have reached an all-time high (ATH) of 25,300 BTC. Young then highlighted the significance of this occurrence as he elaborated on what accumulation addresses are. 

These accumulation addresses are said to have no outgoing transactions and have a balance that exceeds 10 BTC. Accounts belonging to centralized exchanges (CEXs) or miners are also excluded from this category of wallet addresses. Meanwhile, these addresses have received more than two incoming transactions, with the most recent occurring within the last 7 years. 

Simply put, these addresses are the most bullish on Bitcoin and can be regarded as the ultimate ‘Bitcoin Diamond Hands.’ This development further highlights the growing accumulation trend as more investors continue to stack up their BTC holdings ahead of the next bull run, which is projected to begin after the Halving event.  

Interestingly, inflows into accumulation addresses hitting an ATH coincides with Michael Saylor’s statement that he doesn’t plan on selling any of his company’s Bitcoin anytime soon. According to the tech executive, “Bitcoin is the exit strategy.” Saylor’s MicroStrategy is reported to hold 190,000 BTC BTC at the moment.

Spot Bitcoin ETFs Also See Record-Breaking Day

Bloomberg analyst Eric Balchunas noted in an X post that the newly listed Spot Bitcoin ETFs (referred to as ‘The Nine’) recorded their biggest volume day since Day one of launch. These funds are said to have seen about $2 billion in combined trading volume. 

Balchunas further mentioned that this achievement was largely thanks to “big contributions” from VanEck ($HODL), WisdomTree ($BTCW), and Bitwise’s ($BITB) Bitcoin ETFs, which all broke their personal records. VanEck’s Bitcoin ETF, in particular, saw more than a 14x increase in its daily average. 

Highlighting how explosive this was, Balchunas revealed that VanEck Bitcoin Trust ETF recorded 50,000 trades on February 20. Meanwhile, this same fund had only seen just 500 trades on February 16. Interestingly, the Bloomberg analyst noted that these trades were more likely from retail investors rather than a single “big investor.”

At the time of writing, Bitcoin is trading at around $51,500, down in the last 24 hours, according to data from CoinMarketCap. 

Bitcoin price chart from Tradingview.com

Microstrategy Buys More Bitcoin: Here’s How Much Profit It Holds Now

Software company Microstrategy bought another $37 million worth of Bitcoin, bringing its unrealized profit to $37 million.

Microstrategy Now Holds This Much In Unrealized Bitcoin Gain

Michael Saylor, the founder and chairman of Microstrategy, has announced in an X post that the firm purchased an additional 850 BTC at $37.2 million in January, which was recently approved.

In a post on X, CryptoQuant Netherlands community manager Maartunn explains four important facts about Microstrategy’s portfolio after this latest shopping spree.

First, here is a chart that shows how the total supply held by Microstrategy has grown over the last few years:

Microstrategy Bitcoin Supply

The chart shows that the company has made several Bitcoin purchases over the past year and has substantially grown its holdings. Following the latest buying move, the firm’s wallets hold 190,000 BTC.

This is a staggering amount, as the entire circulating supply of the asset is around 19.6 million BTC right now, which means Microstrategy alone holds almost 1% of the BTC supply.

For perspective, all the Bitcoin spot exchange-traded funds (ETFs), including the Grayscale Bitcoin Trust (GBTC), combined, hold about 3.3% of the coins in circulation.

Next, Maartunn has shared a chart displaying the cost of each purchase.

Bitcoin Cost

Adding up all these costs, the total price of Microstrategy’s Bitcoin stack is around $5.932 billion. However, the chart below shows that the company’s actual BTC value differs from this amount.

Microstrategy Bitcoin Holdings

As the graph shows, Microstrategy’s stack’s value at the current cryptocurrency price is notably higher than the amount it used to acquire these coins. In particular, the value of the company’s holdings is currently around $8.1 billion.

Finally, the analyst shared a chart revealing the firm’s unrealized profit and loss trend over the years.

Bitcoin Unrealized Profit And Loss

Microstrategy’s Bitcoin holdings had been in the red during the 2022 bear market and most of 2023, but with the start of the rally last October, the company’s fates finally changed as it returned to the green.

The firm’s BTC stack holds significant unrealized gains of almost $2.2 billion. It would appear that Saylor’s strategy may have paid off, at least for now.

BTC Price

At the time of writing, Bitcoin is trading around the $43,000 mark, up 1% over the past week.

Bitcoin Price Chart

Bitcoin Accumulation: USDT Issuer Tether Goes On Massive 8,888 BTC Buying Spree

In an encouraging development for the crypto space, Tether, the issuer of the world’s largest stablecoin USDT, has doubled down on its Bitcoin investment momentum by acquiring a staggering 8,888 BTC, further diversifying its portfolio. 

Tether Increases Its Bitcoin Holdings

Tether has recently made its third largest Bitcoin purchase, as the stablecoin issuer added a total of 8,888 BTC valued at $380 million at the time of purchase. This brings its total BTC holdings to 66,465 BTC, valued at $2.81 billion with an average buy price of $42,353. 

This transaction was captured by BitInfoCharts data, which also showed the previous amounts of BTC accumulated by the blockchain-enabled platform. This recent purchase follows Tether’s Bitcoin investment strategy, in line with its vision to continuously strengthen its reserves by accumulating Bitcoin.

Earlier in May 2023, the stablecoin issuer announced in a blog post that it would regularly allocate 15% of its net realized operating profits toward increasing its BTC reserves. As of the end of March 2023, Tether held approximately $1.5 billion worth of cryptocurrency, a $1.3 billion difference from its total BTC holdings presently. 

According to reports from Dune Analytics, Tether has become the 11th largest Bitcoin holder, with Microstrategy, an American business intelligence service, surpassing Tether’s holdings with over 189,00 BTC accumulated. The other addresses in the top 10 rankings are owned by major crypto exchanges and governments, including Binance, Bitfinex and the US government. 

Tether’s decision to double down on its Bitcoin investments signals its confidence in the cryptocurrency’s future trajectory. It also underscores the blockchain platform’s belief in the long-term potential of BTC as it aims to capitalize on Bitcoin’s potential growth by bolstering and diversifying its digital asset reserve.  

Bitcoin price chart from Tradingview.com (Tether USDT)

BTC Accumulation Race Amidst ETF Hype

Tether’s strategic Bitcoin purchase comes at a time when the crypto market is buzzing with excitement over Spot Bitcoin ETFs. Before the approval of Spot Bitcoin ETFs, Tether had steadily increased its BTC portfolio, purchasing substantial quantities of BTC consistently. In March 2023, the stablecoin issuer bought 15,915 BTC and another 4,083 BTC between the months of May and September.

The timing of Tether’s BTC purchase suggests a proactive stance towards potentially seizing the opportunities brought forth by the Spot Bitcoin ETF market and the upcoming Bitcoin halving in April.

In addition to Tether’s large-scale BTC acquisition, Microstrategy is also another major player which has been continually increasing its BTC holdings. The business intelligence software company added a whopping 14,620 BTC to its portfolio in December 2023. At the time, the value of the purchase was about $615.7 million. 

Other companies with large BTC holdings include Galaxy Digital and Elon Musk’s Tesla, as well as space exploration company SpaceX.

Bitcoin Whales Bought The Recent Dip While Market Panicked

On-chain data suggests the Bitcoin whales may have participated in a significant amount of buying while the market was panicking about the recent lows.

Bitcoin Exchange Netflow Has Been Quite Negative Recently

An analyst in a CryptoQuant Quicktake post pointed out that the exchanges have recently seen outflows. The indicator of interest here is the “exchange netflow,” which keeps track of the net amount of Bitcoin entering or exiting out of the wallets of all centralized exchanges. The metric’s value is calculated by subtracting the outflows from the inflows.

When the indicator has a positive value, the inflows overwhelm the outflows, and a net number of coins moves into these platforms.

As one of the main reasons investors may want to deposit their BTC to the exchanges is for selling purposes, this trend can have bearish implications for the cryptocurrency.

On the other hand, the negative metric implies withdrawals are taking place, which can be a sign that the holders are accumulating right now. Such a trend could naturally turn out to be bullish for the asset’s price.

Now, here is a chart that shows the trend in the Bitcoin exchange netflow over the past year:

Bitcoin exchange netflow

The above graph shows that the Bitcoin exchange netflow has observed some deep negative spikes recently. This suggests that some large outflows have been occurring from these platforms.

Interestingly, these withdrawals came as BTC slipped towards the $41,600 level, implying that some investors were potentially buying while the rest of the market was panicking about the drawdown.

Given the large scale of the deposits, it’s likely that whale entities were behind them. The fact that these humongous holders were willing to risk accumulating at these recent prices could be a positive sign for the continuation of the rally.

Microstrategy has also just announced its massive $615 million BTC acquisition, which can naturally be another optimistic sign for the coin. The exchange netflows occurring ahead of the announcement are interesting, though.

It’s hard to be sure if there is any connection between the two, but one possibility is that the whales who bought at these recent lows knew about the acquisitions ahead of time.

Another, and perhaps the more likely explanation, is that these large investors were looking for an entry point into the asset ahead of the potential ETF approvals, and the dip presented as good an opportunity as any to achieve so.

Whatever the case, it would seem like the moves made by the whales might have paid off so far, as the Bitcoin price has rebounded since its lows (although its recovery hasn’t been too strong yet).

BTC Price

Bitcoin had recovered to as high as $43,800 during the past day, but the asset has since slumped back down as it’s now floating around the $42,800 mark.

Bitcoin Price Chart

These Bitcoin Holders Have Bought Almost $2 Billion In Last 6 Weeks: Data

On-chain data shows that mid to large Bitcoin holders have purchased almost $2 billion in the asset during the past six weeks.

Bitcoin Holders With 1 To 10,000 BTC Have Neared All-Time High Holdings

According to data from the on-chain analytics firm Santiment, the mid to large-sized BTC addresses have added 71,555 BTC to their holdings recently. The relevant indicator here is the “BTC Supply Distribution,” which keeps track of the total amount of Bitcoin that each holder group in the market is holding right now.

The investors or addresses are divided into these cohorts based on the total number of tokens that they are currently carrying. The 1-10 coins group, for instance, includes all holders who own at least 1 and at most 10 BTC.

If the Supply Distribution is applied to this specific cohort, it would tell us about the total amount of the asset that the addresses on the network fulfilling this condition are currently holding as a whole.

In the context of the current discussion, the mid and large-sized investors in the market are of interest. Typically, these are the addresses ranging between 1 and 10,000 BTC.

Here is a chart that shows the trend in the combined Bitcoin Supply Distribution for all the cohorts falling inside this particular coin range over the past few months:

Bitcoin Large Holdings

This wallet range covers a variety of groups, with the two most notable being the sharks and whales. The sharks are generally the entities with 100-1,000 BTC, while the whales are those with 1,000-10,000 BTC.

Both of these cohorts carry some power in the sector, because of the sheer size of their holdings. The whales, however, carry significantly more influence than the sharks, a natural consequence of their balances being much larger.

The rest of the investors inside this range (those with 1-100 BTC) are considered mid-sized holders, who may not be relevant individually, but as a whole, they can have a notable presence in the market.

From the graph, it’s visible that the combined holdings of all these groups have been heading up recently, implying that buying has been taking place. During the past six weeks alone, these investors have purchased a total of 71,155 BTC, which is equivalent to about $1.97 billion at the current exchange rate.

With this latest accumulation spree, the total holdings of these Bitcoin investors have hit about 15.2 million BTC, which is the largest amount that they have held since January 2022.

Not just that, their current holdings are also just 90,000 BTC shy from their all-time high back in November 2021, where they owned about 15.29 million tokens of the asset.

As is visible from the chart, the indicator has observed some particularly sharp growth during the past week or so, suggesting that these holders believe the current prices are worth buying at.

BTC Price

Bitcoin hasn’t moved much since its pullback a few days ago as its price is still trading around the $27,700 mark.

Bitcoin Price Chart

Bitcoin Bullish Signal: Whales Accumulate 84,897 BTC

On-chain data shows the Bitcoin whales have accumulated 84,897 BTC during the last five weeks, something that could be bullish for the price.

Bitcoin Whales Have Been Growing Their Holdings Recently

According to data from the on-chain analytics firm Santiment, when whales last accumulated like this, the price jumped about 34%. The relevant indicator here is the “BTC Supply Distribution,” which tells us about the total amount (as well as the percentage) of the Bitcoin supply that each wallet group in the market is holding currently.

The addresses on the network are divided into these wallet groups based on the number of coins that they are carrying in their balances at the moment. The 10-100 coins cohort, for instance, includes all addresses that are holding at least 10 and at most 100 BTC currently.

Naturally, if the Supply Distribution is applied to this specific group, it would measure the amount of the supply that wallets satisfying this condition are holding as a whole.

Now, in the context of the current discussion, the Bitcoin cohort of interest is the “whale” group. Whales are humongous entities that carry at least 1,000 BTC ($26.8 million at the current exchange rate) and at most 10,000 BTC ($268 million) in their wallets. This means that the 1,000-10,000 coins group is of relevance here.

The below chart shows the trend in the Bitcoin Supply Distribution for this particular cohort over the past year:

Bitcoin Whales

As displayed in the graph, the Bitcoin Supply Distribution for the whale group has observed an overall uptrend recently. During the last five weeks, these humongous investors have added around 84,897 BTC to their holdings, which is worth around $2.2 billion.

Generally, the behavior followed by the whales can be something to watch out for, as their massive holdings mean that they have the potential to cause noticeable ripples in the market through their moves.

An example of this can be clearly seen in the chart. In the leadup to and during the rally back in January of this year, the whales displayed a trend of accumulation and grew their supplies by around 71,690 BTC.

While this accumulation occurred, the price of Bitcoin started its surge and had risen by more than 34% by the time the whales slowed down their buying spree. This trend highlights how the buying pressure from this cohort can help the price go up.

Since the whales have started their latest accumulation cycle, however, the price has only declined or moved sideways so far. But given that these holders are continuing to expand their reserves, it suggests that they think the current relatively low prices provide a good buying opportunity.

It’s unknown when this bullish conviction held by the whales might translate to the price, but the trend could be a positive sign for the long-term sustainability of the rally.

BTC Price

At the time of writing, Bitcoin is trading around $26,700, down 2% in the last week.

Bitcoin Price Chart

Bitcoin Mega Whales Are Moving Opposite To Rest Of Market: Glassnode

On-chain data from Glassnode shows the largest Bitcoin whales have been showing the opposite behavior to what other investors have been doing.

Bitcoin Market Is Observing A Moderate Distribution Phase Currently

According to data from the on-chain analytics firm Glassnode, the behavior of the largest BTC whales has once again deviated from the rest of the market. The relevant indicator here is the “Trend Accumulation Score,” which tells us whether Bitcoin investors are buying or selling.

There are mainly two factors that the metric accounts for to find this score: the balance changes taking place in the holders’ wallets and the size of the investors making such changes. This means that the larger the investor making a buying or selling move, the larger their weightage in the Trend Accumulation Score.

When the value of this metric is close to 1, it means that the larger holders in the sector are accumulating right now (or a huge number of small investors are displaying this behavior). On the other hand, the indicator has a value near the zero mark suggesting the investors are currently displaying a distribution trend.

This indicator is generally defined for the entire market but can also be used on specific investor segments. In the below chart, Glassnode has displayed the data for the Bitcoin Trend Accumulation Score of the various holder groups in the market.

Bitcoin Trend Accumulation Score

Here, the investors in the market have been divided into six different cohorts based on the amount of BTC that they are carrying in their wallets: under 1 BTC, 1 to 10 BTC, 10 to 100 BTC, 100 to 1,000 BTC, 1,000 to 10,000 BTC, and above 10,000 BTC.

From the above graph, it’s visible that the Trend Accumulation Score for all these groups had a value of about 1 at the bear market lows following the November 2022 FTX crash, suggesting that the market as a whole was participating in some heavy buying back then.

This accumulation continued until the rally arrived in January 2023, when the market behavior started shifting. The holders began distributing during this period, selling especially heavily between February and March. Following this sharp distribution, the rally lost steam, and the price plunged below $20,000.

However, these investors once again started to accumulate as the price sharply recovered and the rally restarted. Though, this time, the accumulation was only moderate.

Interestingly, while the behavior in the market had been more or less uniform in the months leading up to this new accumulation streak (meaning that all the groups had been buying or selling at the same time), this new accumulation streak didn’t have the largest of the whales (above 10,000 BTC group) participating. Instead, these humongous investors were going through a phase of distribution.

Since Bitcoin broke above the $30,000 level in the middle of April 2023, the investors have again been selling, showing moderate distribution behavior.

Like the accumulation phase preceding this selling, the above 10,000 BTC whales haven’t joined in with the rest of the market; they have rather been aggressively accumulating and expanding their wallets. These holders seem to have decided to move in the opposite direction of the general market.

BTC Price

At the time of writing, Bitcoin is trading around $28,900, up 1% in the last week.

Bitcoin Price Chart

Bitcoin Accumulation: HODLers Are Buying 15,000 BTC Per Month

On-chain data shows the Bitcoin HODLers are currently displaying net accumulation behavior, as they grow their holdings by 15,000 BTC per month.

Bitcoin Long-Term Holders Have Been Accumulating Recently

According to data from the on-chain analytics firm Glassnode, these investors were previously aggressively distributing during the bear market lows. The HODLers, or more formally, the “long-term holders” (LTHs), make up a Bitcoin cohort that includes all investors that have been holding onto their coins since at least 155 days ago.

The LTHs make up one of the two main holder groups in the market; the other cohort is called the “short-term holder” (STH) group and naturally includes only investors that bought their BTC less than 155 days ago.

Statistically speaking, the longer a holder owns a coin, the less likely they become to sell it at any point. This means that the LTHs are the more resolute bunch of the two groups, which is why they are called the “HODLers” or the diamond hands of the market.

As these investors are an important part of the sector, their movements can be worth tracking. An indicator called the “HODLer net position change” measures the monthly rate at which these investors are buying or selling a net amount of Bitcoin right now.

The chart below shows the trend in this metric over the last few years:

Bitcoin HODLer Net Position Change

When the HODLer net position change has a positive value, it means these investors are receiving inflows into their holdings currently. On the other hand, negative values suggest a net number of coins are exiting the supply of the LTHs.

As displayed in the graph, the Bitcoin HODLer net position change had a deep red value during the bear market lows that followed the November 2022 FTX crash. This means that the LTHs had been selling during this period.

This sharp negative spike has been an exception to the long-term trend, however, as the HODLers have actually been showing an overall strong accumulation behavior over the past couple of years. The last time these investors participated in consistent distribution was during the bull rally in the first half of 2021.

From the chart, it’s visible that after the aforementioned brief period of distribution at the bear market lows, the LTHs switched back to accumulation just before the current rally began.

These diamond hands have continued to add to their holdings throughout the rally so far, showing that they haven’t been allured by the profit-taking opportunity. This can be a bullish sign for the long-term sustainability of the rally.

Though, very recently, the monthly amount that they have been adding to their holdings has been trending down. Nonetheless, the indicator’s value still remains positive, as the Bitcoin LTHs are accumulating at a rate of 15,000 BTC per month currently.

BTC Price

At the time of writing, Bitcoin is trading around $29,100, up 1% in the last week.

Bitcoin Price Chart

Bitcoin Bullish Signal? Small Investors Show Rapid Accumulation

On-chain data shows small Bitcoin holders have accumulated recently while whale holdings have decreased, a sign that may be bullish in the long term.

Bitcoin Investors With 0-1,000 Coins Have Increased Their Holdings Recently

As a Twitter user has pointed out using data from Santiment, holders with wallet amounts in the 0-1,000 coins range have aggressively accumulated at recent lows. The relevant indicator here is the “Bitcoin Supply Distribution,” which tells us which wallet groups are holding what percentage of the total supply right now.

Wallets (or more simply, holders) are divided into wallet bands based on the number of coins they are holding at the moment. For example, the 1-10 coins cohort includes all addresses that are currently carrying at least 1 and at most 10 BTC. The Supply Distribution metric for this group measures the collective balance of all the wallets falling inside this range.

Now, here is a chart that shows the trend in the Bitcoin Supply Distribution data for the 0-1,000 coins and 1,000-1,000,000 coins bands:

Bitcoin Supply Distribution

As you can see above, the Bitcoin Supply Distribution curve for the 1,000-1,000,000 coins band has observed a sharp decline recently. The holders belonging to this group are the whales, which means that the percentage of the supply held by these humongous holders has been going down, suggesting that they have been capitulating during this deep bear market.

The supply share held by the 0-1,000 coins group, on the other hand, has rapidly increased recently, implying that retail investors have been accumulating large amounts during the recent lows in the price of the asset.

From the chart, it’s apparent that such a pattern was also seen during the 2018/2019 bear market, albeit the scale of movement from both these groups was much smaller. Interestingly, this trend only formed in that bear after the cyclical low was already in for BTC.

Thus, if history is anything to go by, this recent accumulation from the 0-1,000 coins group could help Bitcoin form the bottom for the current cycle (if it’s not already in), and therefore reverse the coin towards a bullish trend in the long term.

BTC Price

At the time of writing, Bitcoin’s price floats around $16,800, up 1% in the last seven days. Over the past month, the crypto has gained 2% in value.

Bitcoin Price Chart

Bitcoin Holders Show Rapid New Accumulation For First Time This Bear, Bottom Signal?

On-chain data shows Bitcoin holders have done some rapid fresh accumulation recently, something that may lead to bottom formation for the cycle.

Bitcoin 1w-1m Realized Cap UTXO Age Bands Have Sharply Gone Up

As pointed out by an analyst in a CryptoQuant post, the percentage of the BTC realized cap that was last moved between 1 week to 1 month ago has displayed rapid uptrend for the first time in this bear.

The “realized cap” is a Bitcoin capitalization model that values each coin in the circulating supply using the price at which it was last moved. The metric then calculates the “true valuation” of BTC by summing up all these values of the individual coins.

This is different from the normal market cap, where every coin in circulation has the same one value; the current Bitcoin price.

The “realized cap – UTXO age bands” is an indicator that tells us the distribution of the realized cap of each age band in the market.

These age bands specify ranges between which UTXOs (or more simply, coins) falling into said age band were last moved.

The relevant age band here is the 1w-1m group, which includes all UTXOs that were last moved within 1 week to 1 month ago.

Here is a chart that shows how the percentage of the realized cap contributed by this age band has changed over the years:

Bitcoin Realized Cap UTXO Age Bands

Looks like the value of the metric has sharply gone up in recent weeks | Source: CryptoQuant

As you can see in the above graph, the realized cap of the 1w-1m Bitcoin UTXO age band has observed some rapid uptrend recently.

The older end of this range, that is, one month ago, is around when the crash due to the FTX collapse took place.

The indicator’s value rising thus suggests that investors have done some fresh accumulation at the lows following this crash.

This is the first time in this Bitcoin bear market that such rapid new accumulation has taken place.

From the chart, it’s apparent that such rises have historically coincided with cyclical lows in the price. Another interesting thing to note is that between these spikes in the metric during the previous two cycles, there were 1358 days.

The current rise has come 1444 days after the last one, which is a similar length as the gap before. If there really is a pattern here, then the Bitcoin bottom may be very close, if not already in.

BTC Price

At the time of writing, Bitcoin’s price floats around $16.8k, down 1% in the last week.

Bitcoin Price Chart

BTC plunges down | Source: BTCUSD on TradingView
Featured image from Kanchanara on Unsplash.com, charts from TradingView.com, CryptoQuant.com

On-Chain Data Shows Signs Of Fresh Bitcoin Accumulation

On-chain data shows signs of some fresh Bitcoin accumulation taking place during the last month.

Bitcoin UTXOs Aged 1 Week To 1 Month Have Risen Up In Recent Days

As pointed out by an analyst in a CryptoQuant post, UTXOs purchased between 1 week and 1 month ago have risen since the FTX crash.

The relevant indicator here is the “Realized Cap – UTXO Age Bands,” which tells us which age group has what percentage of the Bitcoin realized cap.

The “realized cap” here refers to a type of BTC capitalization model in which the crypto’s cap is calculated by weighing each coin in the circulating supply against the price at which it was last moved, and then taking the sum for the entire supply.

This capitalization method is different from the usual market cap, where all the coins are simply multiplied with the current BTC price.

The “age bands” are groups that define the time period under which the UTXOs falling into it were last moved. For example, the “1m-3m” age band includes all UTXOs that haven’t shown any movement since between 1 and 3 months ago.

Now, the age band of relevance in the current discussion is the “1w-1m” group. Here is a chart that shows how the realized cap contribution of this Bitcoin band has changed during the past couple of years:

Bitcoin Realized Cap UTXO Age Bands

Looks like the value of the metric has been trending up recently | Source: CryptoQuant

As you can see in the above graph, the realized cap of the Bitcoin UTXOs falling into the 1w-1m band was in a decline during the bear market and had reached very low values by the time the FTX collapse rolled around.

Since the crash, however, the age band has been observing a rapid uptrend. This means that there have been a large number of coins purchased between 1 week and 1 month ago.

Based on this trend, it seems like some investors have been busy accumulating at the lows that have been seen after the crash, despite the wider market feeling uncertainty due to the FTX contagion possibly causing a cascade of bankruptcies of other platforms.

BTC Price

At the time of writing, Bitcoin’s price floats around $16.5k, down 1% in the last week. Over the past month, the crypto has lost 15% in value.

Below is a chart that shows the trend in the price of the coin over the last five days.

Bitcoin Price Chart

The value of the crypto seems to have returned to a flat curve during the last few days | Source: BTCUSD on TradingView
Featured image from Kanchanara on Unsplash.com, charts from TradingView.com, CryptoQuant.com

Bitcoin Bullish Signal: Supply Reaches All-Time High HODLing Levels

Data shows the Bitcoin supply has now reached all-time high HODLing levels, a sign that could be bullish for the price of the crypto.

Bitcoin HODLed Or Lost Coins Metric Has Hit A New ATH

As per the latest weekly report from Glassnode, investors have been showing some aggressive accumulation behavior recently.

There are a couple of relevant indicators here. The first is the “HODLed or Lost Coins,” which measures the total number of coins that have been sitting dormant on the blockchain. Such coins either belong to the HODLers, or are simply inside wallets that have been lost (hence the name of the metric).

The other indicator is the “HODLer Net Position Change,” which tells us the amount of Bitcoin that is entering or exiting this dormant supply right now.

When the HODLer supply goes up, it means investors have been accumulating more and holding strong onto their coins recently.

Now, here is a chart that shows the trend in both these Bitcoin indicators over the last couple of years:

Bitcoin HODLer Accumulation

The value of the two metrics seems to have been high in recent weeks | Source: Glassnode’s The Week Onchain – Week 45, 2022

From the above graph, it’s apparent that the Bitcoin HODLer or Lost Coins supply had a high value just before the 2021 bull run hit in full swing.

After it started, however, the indicator declined as HODLers began to sell for profit. This trend of negative net position change in their supply ran until May 2021, when a reversal occurred.

The investors have been generally holding strong and accumulating more coins since then, as the green net position change shows.

As a result of this accumulation, the Bitcoin HODLer or Lost Coins metric has now reached a new all-time high.

Another way to see this aggressive HODLing behavior is through the “Supply Last Active < 6 Months” indicator, which measures the amount of BTC that has seen some movement within the last six months.

Bitcoin Supply Last Active 6 Months Ago

Looks like this metric has declined recently | Source: Glassnode’s The Week Onchain – Week 45, 2022

As you can see in the chart, the percentage of the Bitcoin supply last active within the past six months is currently at historical lows.

This means that a huge chunk of the supply has been dormant in recent times, further proving the extreme HODLing that is taking place right now.

Naturally, this kind of investor mentality can be bullish for the price of the crypto in the long term.

BTC Price

At the time of writing, Bitcoin’s price floats around $19.6k, down 4% in the last week.

Bitcoin Price Chart

The value of the crypto plummets down | Source: BTCUSD on TradingView
Featured image from Quaritsch Photography on Unsplash.com, charts from TradingView.com, Glassnode.com

Bitcoin Breaks $21k As Market Shows Signs Of Accumulation

Bitcoin has today broken past $21k in a sharp surge as on-chain data suggests signs of accumulation from the investors.

Bitcoin UTXO Value Bands Show Multiple Groups Have Been Buying Recently

As pointed out by an analyst in a CryptoQuant post, the value bands who took profit around ten days ago are now accumulating again.

The relevant indicator here is the “UTXO value bands,” which tells us what percentage of the total Bitcoin supply is held by which groups.

The value bands or groups here are divided based on the number of coins in each Unspent Transaction Output (UTXO), or simply, the amount currently held in each wallet.

For example, the 1k-10k BTC value band includes all wallets that are currently holding between 1k and 10k BTC.

When any value band shows an uptrend, it means the number of wallets in that specific range are going up.

In context of the current discussion, the relevant value bands are the 0.1-1 BTC, 1-10 BTC, and 10-100 BTC cohorts.

Here is a chart that shows the trend in the UTXO value band percentages for each of these groups:

Bitcoin Whale Accumulation

Looks like all these metrics have been going up in the last couple of days | Source: CryptoQuant

As you can see in the above graph, when the price of Bitcoin first started to rally up, all three of these value bands started dropping down.

This means that investors with wallet amounts in these ranges started to dump as a profit-taking opportunity arose.

By the time the price peaked, these metrics hit a low, and then followed up with trending sideways (along with the price).

In the last couple of days, however, the percentage of the Bitcoin supply in these UTXO value bands has once again started to move up.

This means that there has been some market-wide accumulation going on above the $20k level, showing that investors have conviction the price will increase further.

And indeed, following this buying spree, the crypto has sharply shot up in the past day, breaking above the $21k level again.

BTC Price

At the time of writing, Bitcoin’s price floats around $21.1k, up 3% in the last week. Over the past month, the crypto has gained 8% in value.

Below is a chart that shows the trend in the price of the coin over the last five days.

Bitcoin Price Chart

The value of the crypto seems to have seen some very sharp uptrend in the last twenty-four hours | Source: BTCUSD on TradingView
Featured image from Sandra Seitamaa on Unsplash.com, charts from TradingView.com, CryptoQuant.com

Bitcoin Bullish Signal: Whales With 1k-10k BTC Have Been Accumulating

On-chain data shows the number of Bitcoin whales with 1k to 10k BTC in their wallets have been increasing lately, suggesting that investors have been accumulating the crypto.

Bitcoin UTXO Count Value Bands Show Signs Of Accumulation In Market

As pointed out by an analyst in a CryptoQuant post, there seems to be accumulation going in the BTC market in recent days.

The relevant indicator here is the “UTXO Count Value Bands,” which basically tells us what percentage of Bitcoin wallets fall into which of the different value bands.

Here, the “value bands” refer to the number of coins held in the wallets. For example, the 100-1k BTC group includes all addresses that are holding between a hundred and a thousand coins.

The value band of importance in the current discussion is the 1k-10k group. Here is a chart that shows the trend in the UTXO Count for this value band over the past couple of years:

Bitcoin Whales Accumulation

The value of the metric seems to have been on the rise during recent weeks | Source: CryptoQuant

As you can see in the above graph, the percentage of Bitcoin wallets with balance in the 1k to 10k BTC range had been going down between June and September.

Over the past month, however, the trend seems to have changed and the indicator has now caught some upwards momentum.

This means that whales have been actively accumulating recently and filling up their wallets enough to get inside this value band.

The chart also highlights the pattern in the metric during the buildup to the early 2021 bull and then over the run itself.

It looks like the Bitcoin UTXO Count for this value band started going up in the months leading up to the bull run, and hit a high peak value around the beginning of it.

Shortly after that, however, as the bull started hitting its highs the metric started going down, suggesting that whales were dumping their coins.

If this past trend is anything to go by, the latest upwards trajectory in the indicator could prove to be bullish for the value of Bitcoin.

BTC Price

At the time of writing, Bitcoin’s price floats around $20.4k, down 1% in the last week. Over the past month, the crypto has gained 6% in value.

The below chart shows the trend in the price of the coin over the last five days.

Bitcoin Price Chart

The value of the crypto has been gradually going downhill over the last few days | Source: BTCUSD on TradingView
Featured image from Jaunathan Gagnon on Unsplash.com, charts from TradingView.com, CryptoQuant.com

Data: Bitcoin Whales Who Accumulated At $18k Have Continued To Hold Strong

On-chain data suggests Bitcoin whales who accumulated during the June crash have continued to hold strong so far.

Bitcoin Sum Coin Age Distribution Shows Strong Accumulation Around $18k

As pointed out by an analyst in a CryptoQuant post, the $18k level has been getting support from the whales as they have made spot purchases at this mark.

The relevant indicator here is the “Sum Coin Age Distribution,” which tells us about the amounts the different Bitcoin investor groups are holding in their wallets right now.

These groups are based on the idea of “coin age,” a measure of the total number of days a coin has been sitting dormant on the chain for.

As an example, if 1 BTC remains still in a single address for two weeks, then this coin is taken as a part of the “1 week to 1 month” (1W to 1M) supply.

Now, here is a chart that shows the trend in the Sum Coin Age Distribution in the Bitcoin market over the last year:

Looks like the 3M to 6M group has been going up in recent weeks | Source: CryptoQuant

As you can see in the above graph, the amount of supply held by the different Bitcoin coin age cohorts has shown an interesting pattern during the last few months.

When the crypto’s price crashed back in June, the 1D to 1W supply spiked up as whales picked up some fresh coins around the $18k level.

As the days passed, these coins started aging into the 1W to 1M range, causing the 1D to 1W band to plunge down, while the 1W to 1M group observed an uptrend.

Similarly, these coins matured further with time, leading to the 1M to 3M group rising up and the previous one falling off. And finally, in the last couple of months, the 3M-6M cohort has also found itself at the end of this cascading effect.

The recent increase in this last group suggests that the Bitcoin whales who bought during the crypto’s decline to $18k have still not realized profits on their coins, and have continued to hold onto them with conviction.

BTC Price

At the time of writing, Bitcoin’s price floats around $19.2k, up 1% in the last seven days. Over the past month, the crypto has gained 4% in value.

The below chart shows the trend in the price of the coin over the last five days.

The value of the crypto continues to show stagnant price movement in the last few days | Source: BTCUSD on TradingView
Featured image from Michael Blum on Unsplash.com, charts from TradingView.com, CryptoQuant.com

Number Of Bitcoin Millionaires On The Rise As Accumulation Continues

Bitcoin millionaires are now a widely understood term. This has grown from the massive surge in the price of the digital asset which has continued to decrease the number of BTC required to be a millionaire. A number of bitcoin millionaires had lost their status when the price of the digital asset had declined. However, as bitcoin is recovering, these millionaires have been growing in number but data shows that the increase in price is not the only driver.

Accumulation Is The Name Of The Game

The price of bitcoin had declined significantly following the Russian invasion of Ukraine. This had seen a considerable number of bitcoin millionaires lose their status. But since then, there have been more investors being added to the millionaires’ list.

Related Reading | Bitcoin Futures Basis Nears One-Year Lows, How Will This Affect BTC?

Santiment notes in a new report that the number of bitcoin addresses had been on a steady increase since the way between Russia and Ukraine had started. Not only had the number of addresses been on the rise but whale addresses have been rising. These addresses which hold between 10 to 100k BTC on their balances which were either existing or new had been able to reclaim their millionaire status.

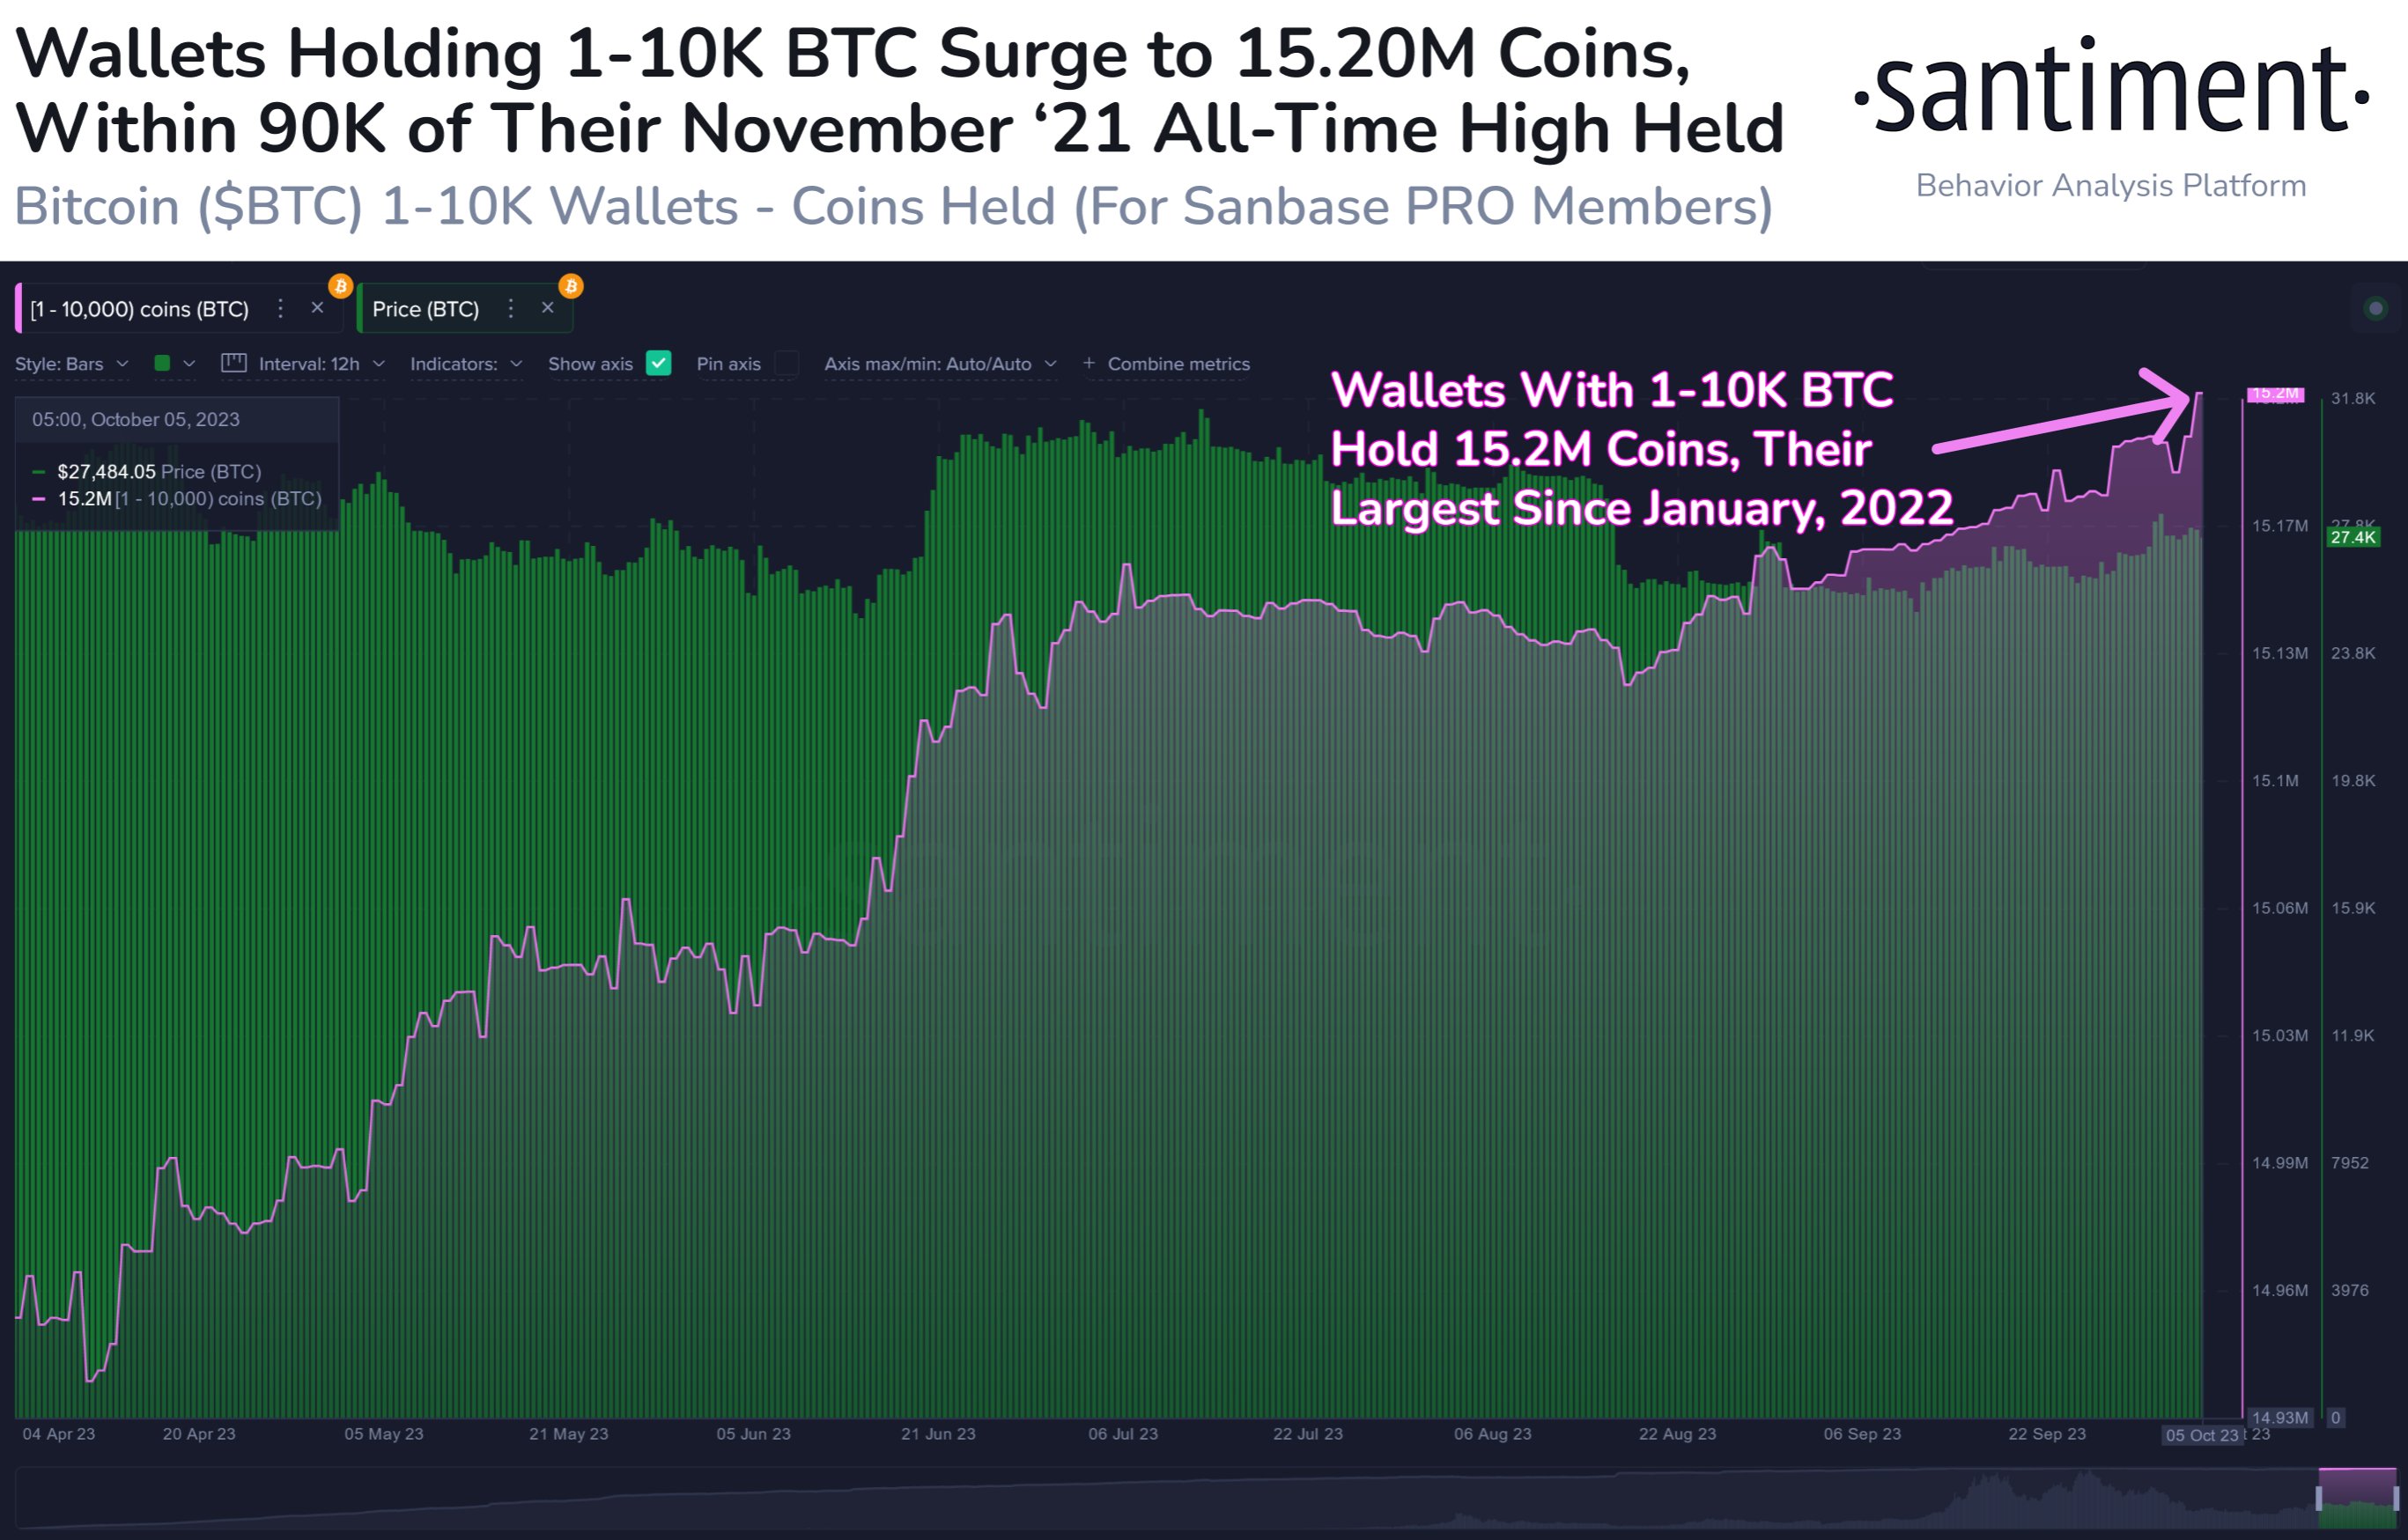
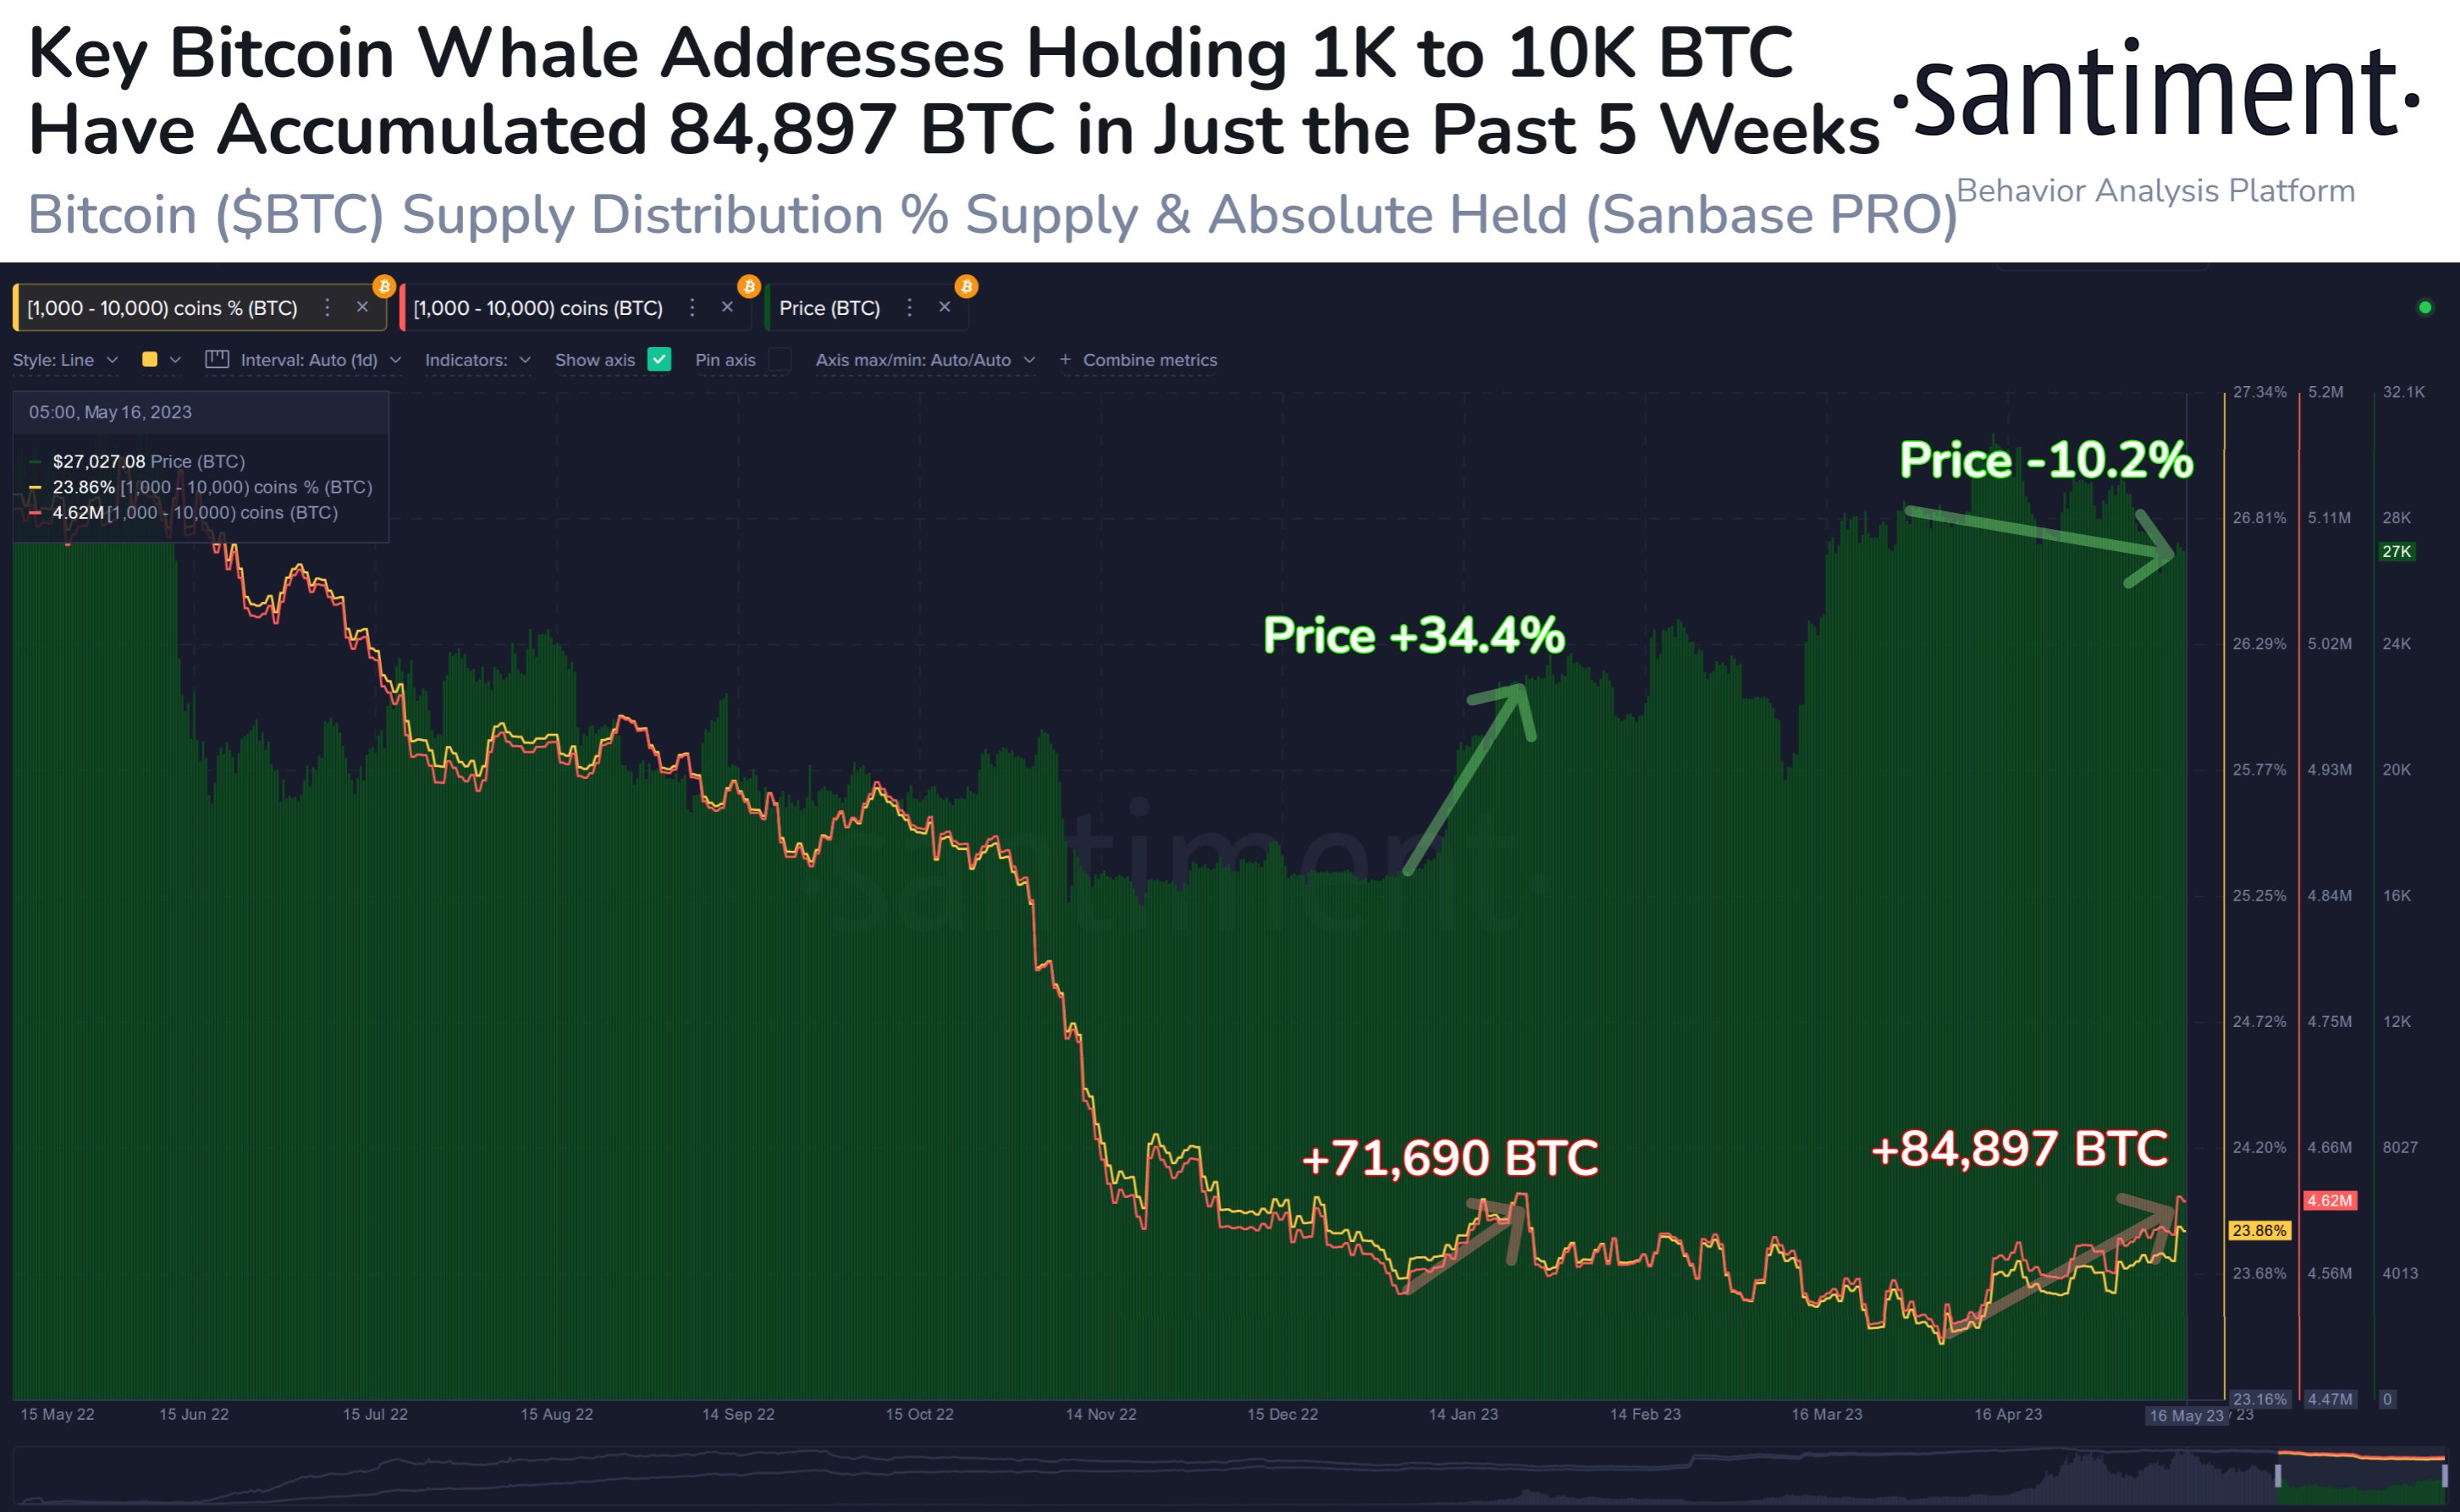
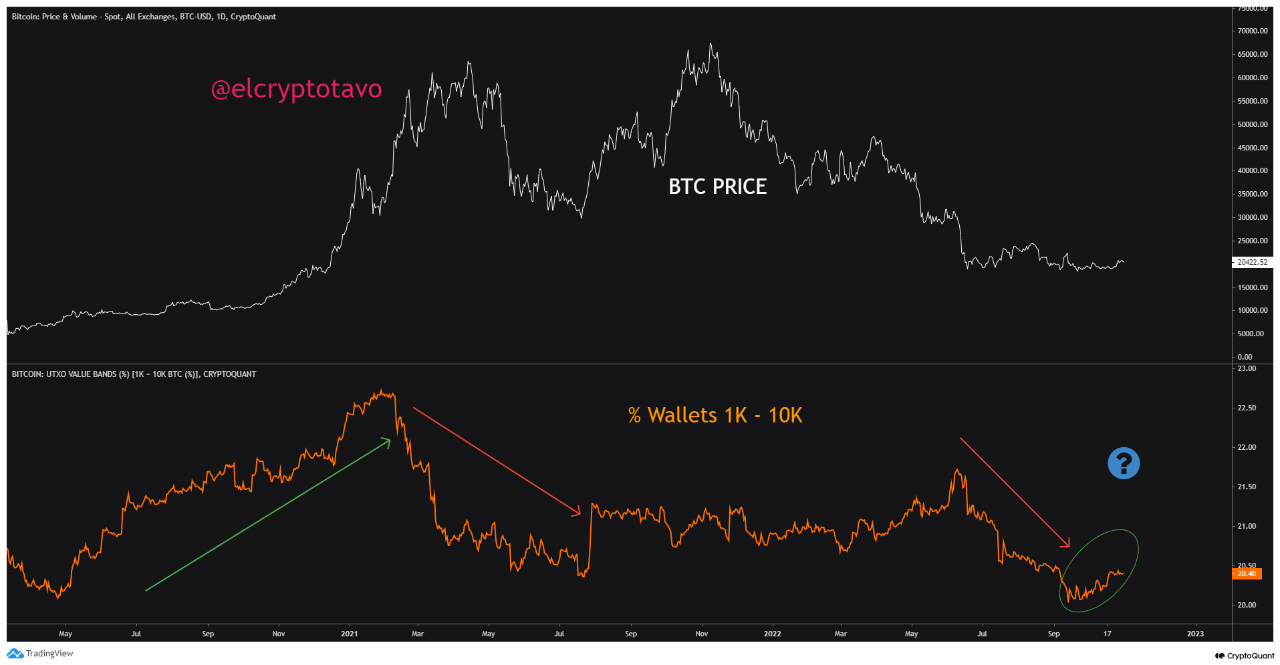
🦈🐳 The number of #Bitcoin addresses has been increasing since the #RussianUkrainianWar began. Since then, there are 1,629 shark and whale addresses holding between 10 to 100k that are either new or have returned to this millionaire (or above) status. 📈https://t.co/08ytC3aMhW pic.twitter.com/9Ts70gdfHJ

— Santiment (@santimentfeed) April 27, 2022

Usually, the obvious culprit for the number of bitcoin millionaires growing can be a surge in price. This drastically increases the value of the tokens held. However, with the price of BTC now making any significant recoveries recently, there is another reason for this and that has been accumulation.

The chart from Santiment shows that these investors have been accumulating BTC at an accelerated rate. This accumulation had seen a sharp increase at the end of March before falling but the whales are once again picking up momentum as the month of April draws to a close.

So instead of regaining their millionaire status by waiting for the price of BTC to go up, these whales have been buying more coins. This also follows the recent trend of daily active addresses picking up on the network. Network transaction volume is also up in this regard. 

Bitcoin Turning Bullish

Bitcoin had lost its footing at $40,000 earlier in the week. This had caused a stir among bears as they tried to drag down the price of the asset. BTC had continued to hold above its $36,000 support level, serving as a bounce point for its recent recovery.

BTC trading in the mid $39,000s | Source: BTCUSD on TradingView.com

Currently, bitcoin is trading above the 5-day moving average. An indicator that proves that investors are now willing to purchase the digital asset higher than the prices they bought days ago. This can often spell a shift in sentiment for investors but only for the very short term.

Related Reading | Bitcoin Drops To $38K After Amazon Retraction On Accepting BTC Payments

BTC still needs to hold above $39,500 though as this remains a critical spot for it. A failure to secure the price above this point could see the digital asset retest the $35,000 in the coming days before any sign of recovery is registered.

Featured image from Altcoin Buzz, chart from TradingView.com

Data: Bitcoin Miners Are Quietly Accumulating While The Market Bleeds

On-chain data suggests Bitcoin miners have been quietly accumulating while the rest of the market has been bleeding.

Bitcoin Miner Reserve Continues To Stay At High Values Despite Struggling Price

As explained by an analyst in a CryptoQuant post, BTC miners seem to have continued to accumulate while the price has declined in the past few weeks.

The “BTC miner reserve” is an indicator that tells us the total amount of Bitcoin present in the wallets of all miners.

When the value of this indicator goes up, it means miners are transferring a net amount of coins to their reserves. Prolonged such trend may be a sign that miners are accumulating right now.

On the other hand, a downtrend in the metric suggests miners may be selling at the moment as they are moving some Bitcoin out of their wallets. This trend can be bearish for the price of the crypto.

Related Reading | Bitcoin Activity Soars Post SWIFT Ban On Russia, BTC At Do Or Die Spot?

Now, here is a chart that shows the trend in the BTC miner reserve over the past year:

Looks like the value of the indicator has enjoyed some uptrend recently | Source: CryptoQuant

As you can see in the above graph, the miner reserve has been on the rise since the Bitcoin all-time high of $69k was set and the price subsequently started a decline.

During this period, miners have added just under 12k BTC to their treasuries, while the price of the crypto has fallen off by around 35%.

Related Reading | Bitcoin Prices Dragged Down By Geopolitical Tensions, Ukraine Nuke Plant Bombing

Historically, miners have always been one of the major sources of selling pressure in the market. So these traditional sellers rather showing accumulation behavior recently can be quite bullish for the price of Bitcoin.

The quant in the post believes that this trend of accumulation and no recent mass dumpings may be a sign that the crypto has started to hit lows.

While this can benefit the price in the long term, near term outcome is still quite uncertain due to the Russian invasion of Ukraine that still rages on.

BTC Price

At the time of writing, Bitcoin’s price floats around $38.3k, down 1% in the last seven days. Over the past month, the crypto has lost 8% in value.

The below chart shows the trend in the price of BTC over the last five days.

BTC’s price seems to have tumbled down over the last few days | Source: BTCUSD on TradingView

Just a few days back, Bitcoin had again climbed above $45k, but it didn’t last long. The price declined quite fast and has now plunged down to the current sub-39k levels.

Featured image from Unsplash.com, charts from TradingView.com, CryptoQuant.com