Is Bitcoin Bull Run Coming Soon? What Network Fundamentals Say

Here’s what the Bitcoin network fundamentals have to say regarding whether the cryptocurrency could see a bull run soon or not.

Monthly Average Bitcoin New Addresses Have Shot Up Recently

In a new post on X, analyst Ali discussed the possibility of a bull run starting soon for the cryptocurrency. According to the analyst, “a bull run is often characterized by increased on-chain activity.”

To measure the activity, Ali has used the “new addresses” metric, which keeps track of the total number of new addresses coming online on the Bitcoin blockchain every day.

When the value of this metric is high, it means that many users have joined the network during the past day. This could suggest that the cryptocurrency is observing high adoption right now.

On the other hand, low values imply not many newcomers are currently attracted to the blockchain, potentially a sign of a lack of interest in the market around the coin.

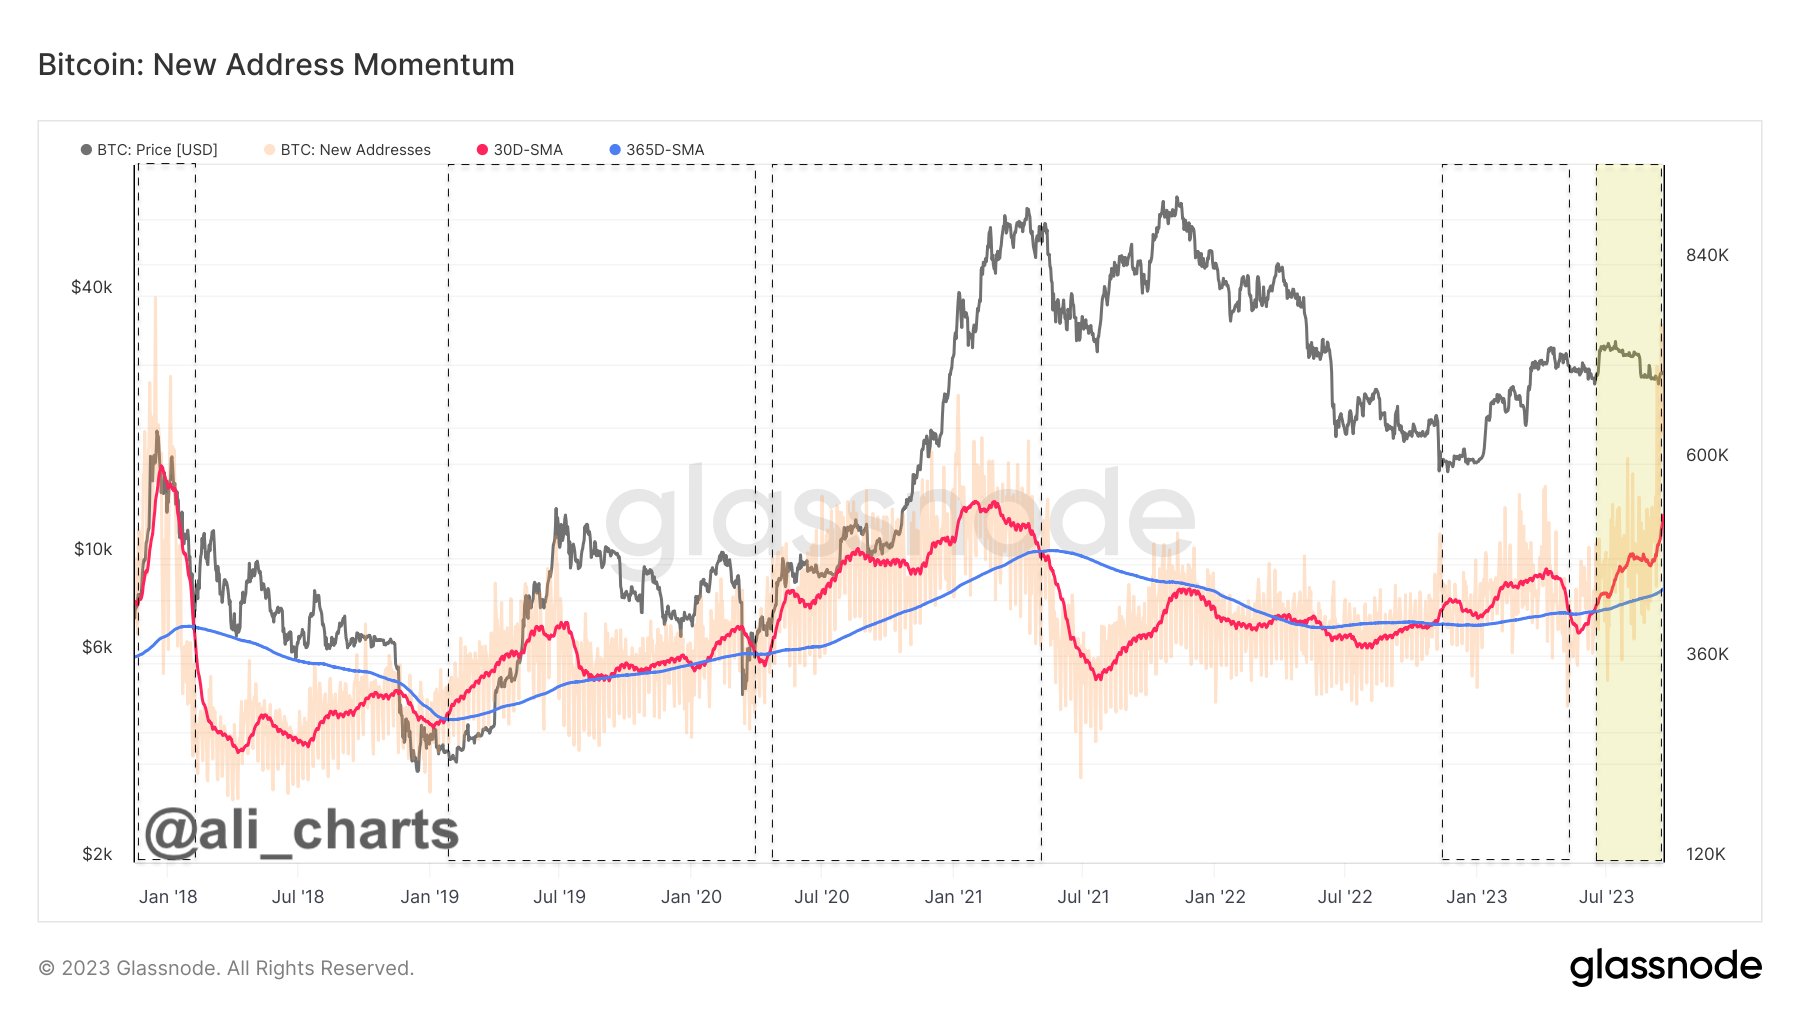
Now, here is a chart that shows the trend in the Bitcoin new addresses, as well as the 30-day and 365-day simple moving averages (SMAs) of the indicator over the past few years:

Bitcoin New Addresses

The increased activity, which may be associated with a bull run, can be “spotted when the monthly average of new wallets (red) surpasses the yearly average (blue), which indicates strengthened network fundamentals and increased use,” as explained by the analyst.

The graph shows that the 30-day SMA of the Bitcoin new addresses had been under the 365-day SMA during the bear market, but with the rally this year, the former had managed to break above the latter.

The reverse cross had happened during the slowdown in May-June, but as the subsequent rebound in the price had occurred, the monthly average new addresses had broken back above the yearly average, and it has since stayed there.

Recently, despite the struggle in the price, the 30-day SMA of the metric has only continued to rise sharply. This could naturally be a constructive sign for the asset, and going by historical precedence, it may even mean a return toward bullish momentum.

The lead on-chain analyst at Glassnode, @_Checkmatey_, however, has replied to Ali’s post, saying, “with the advent of ordinals, it is always a great idea to pair ‘addresses,’ and ‘transactions’ metrics with ‘volume’ metrics.”

Ordinals” here refer to inscribing data directly into the Bitcoin blockchain. They are utilized in various applications, including making non-fungible tokens (NFTs) on the network.

Such chain applications can skew the address-related metrics, as new ones may be created solely for using the blockchain in this way and not for actually trading the coin itself.

The Glassnode lead explains that they assign a slightly higher weight towards the volume metrics because the Ordinals-related transactions don’t involve much volume.

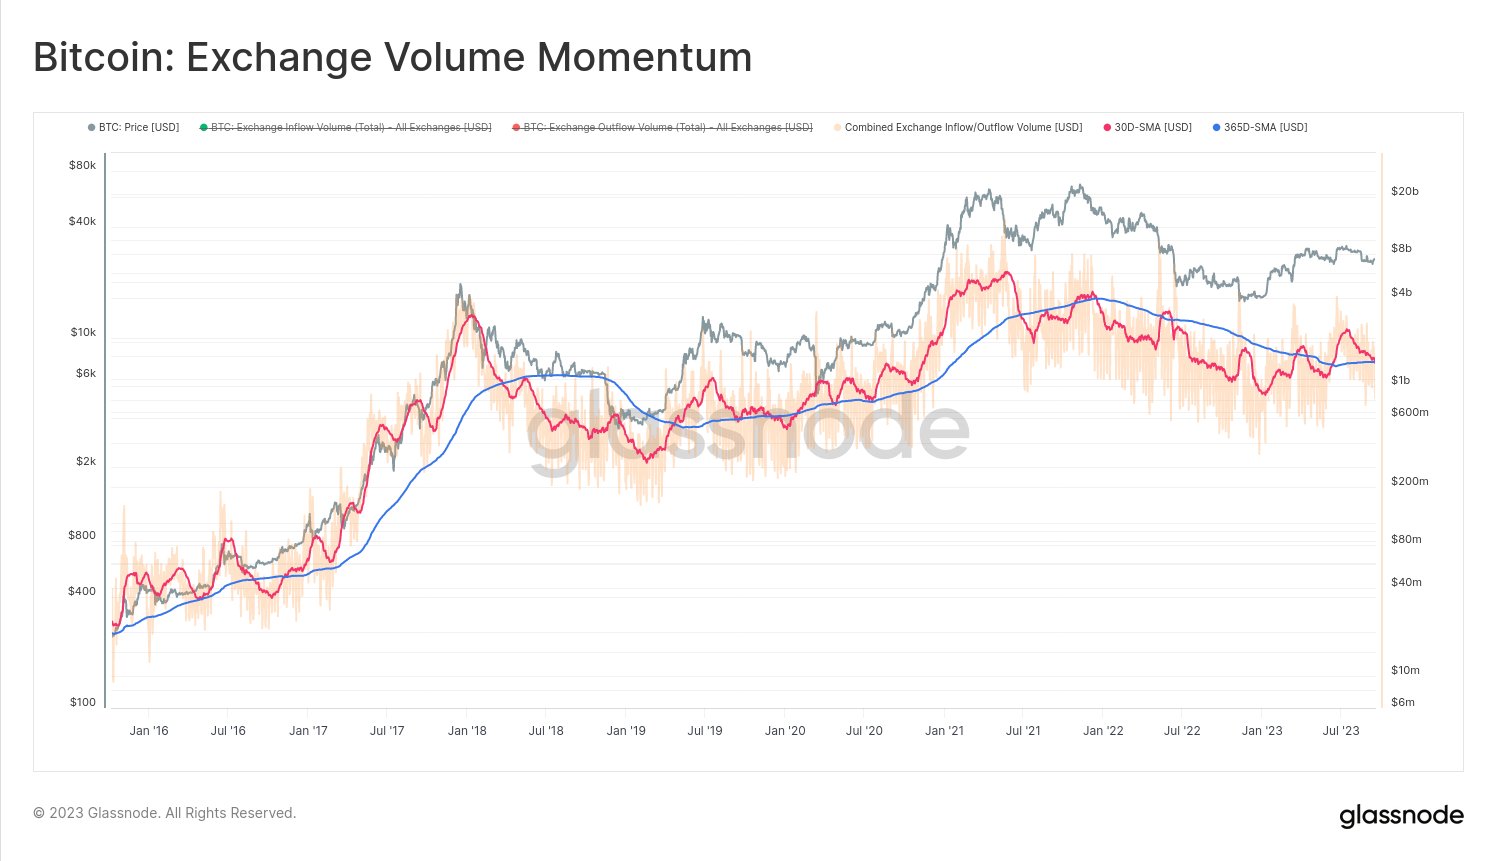
Bitcoin Exchange Volume

Unlike the new addresses metric, the bullish pattern isn’t yet forming for the exchange volume (which includes both inflows and outflows). This would suggest that the activity on the network may not be at a bull run stage right now.

BTC Price

At the time of writing, Bitcoin is trading at around $27,000, up 3% over the past week.
Bitcoin Price Chart

Bitcoin Active Addresses Sharply Decline Despite Transaction Demand, Why?

Data shows that Bitcoin active addresses have sharply dropped despite the high transaction demand; here’s why this may be happening.

Bitcoin Active Addresses Have Seen A Sharp Plunge Recently

According to the latest weekly report from Glassnode, the active addresses are around cyclical lows of 566,000. The “active addresses” metric measures the daily number of unique Bitcoin addresses participating in some transaction activity on the blockchain.

By “unique,” what’s meant here is that the indicator only checks whether an address has been involved in a transfer at least once. This implies that regardless of how many transactions an address might make, its contribution to the active addresses metric will remain just one unit.

This restriction exists because the number of unique addresses can serve as an analog to the number of unique users visiting the blockchain, thus providing an estimate for the daily users on the network.

Another indicator that’s made for tracking activity on the Bitcoin blockchain is the “transaction count,” which, as its name already suggests, tells us about the daily total number of transfers taking place on the network.

When this metric has a high value, it naturally means that many transactions occur on the blockchain. Such indicator values imply a high demand for using the network currently, but the metric can’t say anything about how the activity is distributed; that’s where the active addresses indicator comes in.

Now, here is a chart that shows the trend in the Bitcoin transaction count (as well as its 30-day and 365-day simple moving averages) over the entire history of the asset:

Bitcoin Transaction Count

As displayed in the above graph, the Bitcoin transaction count has recently seen a rapid rise and has hit a new all-time high of about 682,000 daily transfers.

The reason behind this explosion in the transaction count is the emergence of the BRC-20 tokens, fungible tokens created on the BTC blockchain using the Ordinals protocol (a way to inscribe data like text and images directly into the chain).

These BRC-20 tokens have started a new memecoin mania, with PEPE being the largest example of such a coin. The insanely fast popularity of these tokens has meant that the demand for transacting on the network is more than ever before.

What about the active addresses, though? Is this indicator also seeing a rise?

From the chart, it’s apparent that the active addresses observed a rise at first, but then it plunged to a value of 566,000 addresses per day, around the current cyclical low.

This would mean that while the demand for making transactions is super high right now, the demand isn’t actually coming from a large number of users but a rather small number of them who are constantly making repeat transfers.

“This is a curious scenario, whereby many BRC-20 users appear to have re-used their Bitcoin addresses,” explains Glassnode. “Perhaps due to having more familiarity with how account-based chains like Ethereum or Solana operate, and less so with the Bitcoin UTXO system.”

BTC Price

At the time of writing, Bitcoin is trading around $27,400, down 1% in the last week.

Bitcoin Price Chart

Bitcoin Active Addresses Stay Low, A Hint That Demand Isn’t There Yet

On-chain data shows the number of active Bitcoin addresses have remained at a low value for a while now, suggesting there isn’t much demand for the crypto currently.

Bitcoin Active Addresses Have Continued To Move Sideways Recently

As pointed out by an analyst in a CryptoQuant post, the BTC network activity has been low in recent days, implying there isn’t enough demand for a bull rally just yet.

The “number of active addresses” is an indicator that measures the total amount of addresses on the Bitcoin blockchain that have been taking part in some activity, whether that be sending or receiving.

When the value of this metric is high, it means the network is observing a lot of activity right now. Such a trend shows the general interest around the crypto is high among traders currently.

On the other hand, low values of the indicator can suggest the chain isn’t viewing much trading activity at the moment.

Now, here is a chart that shows the trend in the Bitcoin active addresses over the last few years:

Looks like the value of the metric has been quite stagnant in recent months | Source: CryptoQuant

As you can see in the above graph, the quant from the post has highlighted the relevant periods of trend for the Bitcoin active addresses.

Historically, bear markets have observed low and stagnating values of the indicator. The reason behind it is that large declines in the price usually scare away newcomers and short-term traders from the crypto, thus killing off activity on the network.

In the times leading up to bull runs, the market has generally seen a gradual buildup of active addresses, which eventually hit a peak alongside the price. This kind of uptrend signals increasing demand for Bitcoin among all kinds of traders.

Most recently, the metric has been stuck in sideways movement as the crypto has been in the middle of a bear market. There still hasn’t been, however, any sign of the number of active addresses going up yet.

The analyst explains that this recent low demand suggests BTC still hasn’t built up any stable setup for a long-term sustainable rally that can lead to a new bull market.

BTC Price

At the time of writing, Bitcoin’s price floats around $18.8k, up 1% in the past week. Over the last month, the crypto has lost 12% in value.

The below chart shows the trend in BTC’s price over the past five days.

Looks like the value of the crypto hasn’t shown much movement during the last few days | Source: BTCUSD on TradingView
Featured image from Hans-Jurgen Mager on Unsplash.com, charts from TradingView.com, CryptoQuant.com

Bitcoin Active Addresses Surpass 1.02M Three Days In A Row, What Happened Last Time

Bitcoin daily active addresses are on the rise. This has followed the uptick in price after the market crash. As time has gone on and the price has been down for a while, investors are taking this to be a time where they can stock up on the digital asset for cheap. This has led to a high number of daily addresses, and this has continued, indicating that there are bigger things to come.

1 Million Active Addresses In Three Days

On-chain analysis firm Santiment recently published a report detailing the number of bitcoin daily active addresses. This number had seen a significant uptick this week after the market had recovered during the weekend. It had first surpassed 1 million daily active addresses on Tuesday. Not out of the ordinary given the adoption trend of bitcoin but it had continued to grow.

Related Reading | JPMorgan Puts Bitcoin At $150,000 In The Long-Term, But What About Its ‘Fair Value’?

The following two days saw the same above 1 million figure in the number of active addresses. Santiment noted that this number had hit 1.02 million addresses on Thursday, making it the third day in a row that the bitcoin daily active addresses had hit this number.

📈 #Bitcoin's daily active addresses hit 1.02m on Thursday, the third day in a row with 1m+ $BTC addresses interacting on the network. The last time this threshold was consistently above 1m for 3 straight days was December 1-3, when prices were $56k-$57k. https://t.co/49eVEHz9QN pic.twitter.com/wHvgMtDKzq

— Santiment (@santimentfeed) February 11, 2022

Thursday marked the third day in a row where bitcoin addresses interacting with the network on a daily basis had risen above this threshold. While not novel in any way, it can be an indicator of what is to come. The last time that bitcoin had had daily addresses surpass 1 million consistently over a three-day period had been in December of last year and even then it had held some interesting implications for the digital asset.

What To Expect From Bitcoin

Bitcoin hitting three consecutive days of daily active addresses above 1 million point to significant activity in store for the cryptocurrency. Going by historical data (what happened the last time this was the case), it spells a bearish short-term for the digital asset.

The last time bitcoin had seen metrics like this had been between December 1st to December 3rd of 2021. Now, a quick look at the chart at this timeframe shows that there was a price crash that followed it. On December 4th, bitcoin had lost over $10k in a matter of hours, dropping from $57,000 to $42,000 sharply. Although the asset had begun to recover shortly after, it would be the start of a stretched-out downtrend that continues even till now.

BTC slides close to $44K | Source: BTCUSD on TradingView.com

If this is anything to go by, then bitcoin could very well be looking at a crash on Friday. Using a conservative estimate and the digital asset’s current price could put it towards the $38,000 price point, meaning that BTC could once again lose its footing above $40,000.

Related Reading | Bitcoin Steadies Above $45k, US Inflation Comes In At 7.5% Year Over Year

However, it is important to note that this could go either way. With such a high amount of daily active addresses, investors could very well be consolidating and accumulating their coins. If this is the case, then a bullish trend can also be expected, which could put bitcoin above $46,000, solidifying the next bull rally.

Featured image from The Cryptonomist, chart from TradingView.com

Bitcoin Active Addresses Recovers Above 1 Million

The number of bitcoin active addresses had declined following the September market crash but promptly picked up again in October. At the beginning of December, another dip rocked the market that sent addresses plummeting once more. The number had dropped well below the one million mark for the majority of November and stayed low during the bull rally.

Despite the red trends recorded by the market, the first week of December has proven to be good for the market. The number of bitcoin addresses rose significantly in the last seven days, putting bitcoin well above the one million mark once more.

Related Reading | Majority Of Bitcoin Investors Got In This Year, Says Grayscale

Active Addresses Clock One Million

The number of active Bitcoin addresses has climbed above one million multiple times this year. Following the market crash in April, this number had risen to one of its highest points cine January, settling above 1.2 million active addresses. However, the May spike would prove to not last as a sharp decline between June and July brought the number to its lowest point for the year.

This dragged on with the summer lull as the number of active addresses had plunged below 750,000. However, there has been a steady climb in this number all through the rallies that followed with the eventual endpoint landing above one million active addresses. This represents a seven-month high since the decline in June.

BTC active addresses climbs | Source: Arcane Research

The recovery in the number of bitcoin active addresses looks to be following the sell-off trend similar to the May climb. As prices drop, investors are usually taking advantage of this to add to their positions, while those who could not get in because the asset’s price was too high could use the price dips as a perfect entry point into the market.

However, the sell-offs happening in the market could also cause the number of active addresses to decline again as investors offload their holdings on the market.

Related Reading | Bitcoin Open Interest Takes Second Largest Dump Of 2021

Bitcoin Unrealized Profit Declines

As the number of bitcoin active addresses has risen, unrealized profits have gone the opposite direction. The last price job brought down unrealized profit to a smaller margin. The Market Value to Realized Value (MVRV) had peaked in October after the bitcoin price rally at 2.82 but has subsequently dropped to 2 in December.

BTC unrealized profits decline | Source: Arcane Research

This is not to say that MVRV is sitting at a disadvantaged position as 2 falls into the healthy range given that unrealized profits are down for the month. According to Arcane Research, this means that investors are less likely to sell given that the profit margin for their investments is low.

MVRV hit its highest point in the spring at 3.96, a four-year high since the last record set at 4.72 in 2018. It touched a low for the year in mid-July this year, ending up at 1.54.

BTC continues to suffer dips | Source: BTCUSD on TradingView.com
Featured image from iStock, charts from Arcane Research and TradingView.com

Weekend Volatility Awakens Bitcoin Buyers, Active Addresses

Following the volatility of the weekend, Bitcoin holders seem to have woken up as active addresses break one million.

Number Of Active Bitcoin Addresses Reach Seven-Month High

As per the latest weekly report from Arcane Research, the crash during the weekend woke up sleeping Bitcoin investors as the number of active addresses observes a significant increase.

The “number of active addresses” is a Bitcoin indicator that measures the amount of addresses that showed some activity on the chain during a particular day.

If an addresses makes more than one move in a given day, the metric still only counts it as one active address. Because of this, the indicator may tell us an accurate picture about how many BTC holders shifted their coins that day.

When the number of active addresses rise in value, it means market activity is going up, and previously dormant addresses could be coming back up. This trend is usually seen around periods of high volatility.

On the other hand, when the indictor’s value goes down, it implies there aren’t many holders making moves. Such a trend may mean that investors are currently waiting to see the price make moves before they shift their positions. It may also simply be because of a lack of interest in the market at the time

Related Reading | Ethereum Strength Sends Bitcoin Ratio To 2018 Highs

Now, here is a chart that shows the trend in the value of the number of active addresses over the past year:

Looks like the value of the indicator has been moving up for a while | Source: The Arcane Research Weekly Update – Week 48

As the above graph shows, the number of active Bitcoin addresses saw a sharp spike recently. The crash in the crypto’s price during the weekend was responsible for this sudden rise in the metric’s value.

Currently, the indicator’s value is above 1 million, the highest it has been in the past seven months. The last time higher values were seen was back in May, following the crash.

Related Reading | Majority Of Bitcoin Investors Got In This Year, Says Grayscale

As the market cooled down, there were only about 750k active addresses left by July. Since the bottom in that month, the indicator has been gradually rising in value.

It’s yet unclear if the current high values will continue to rise, or if the indicator’s value will once again drop down as the market calms down from the weekend’s volatility.

BTC Price

At the time of writing, Bitcoin’s price floats around $49k, down 24% in the last month. The below chart shows the trend in the price of BTC over the past five days.

BTC still in consolidation? | Source: BTCUSD on TradingView
Featured image from Unsplash.com, charts from TradingView.com, Arcane Research