Bitcoin FOMO: Over 533,330 Addresses Bought Above $70,180

On-chain data suggests more than 533,330 addresses FOMO’d into Bitcoin above $70,180. Following the latest plunge, these investors would all be in losses.

Over 500K Bitcoin Addresses Have A Cost Basis Between $70,180 & $71,340

As pointed out by analyst Ali in a post on X, many investors have bought at the recently high price levels. Below is the chart shared by the analyst that shows how the distribution of the BTC supply looks right now across the various price ranges.

Bitcoin Cost Basis

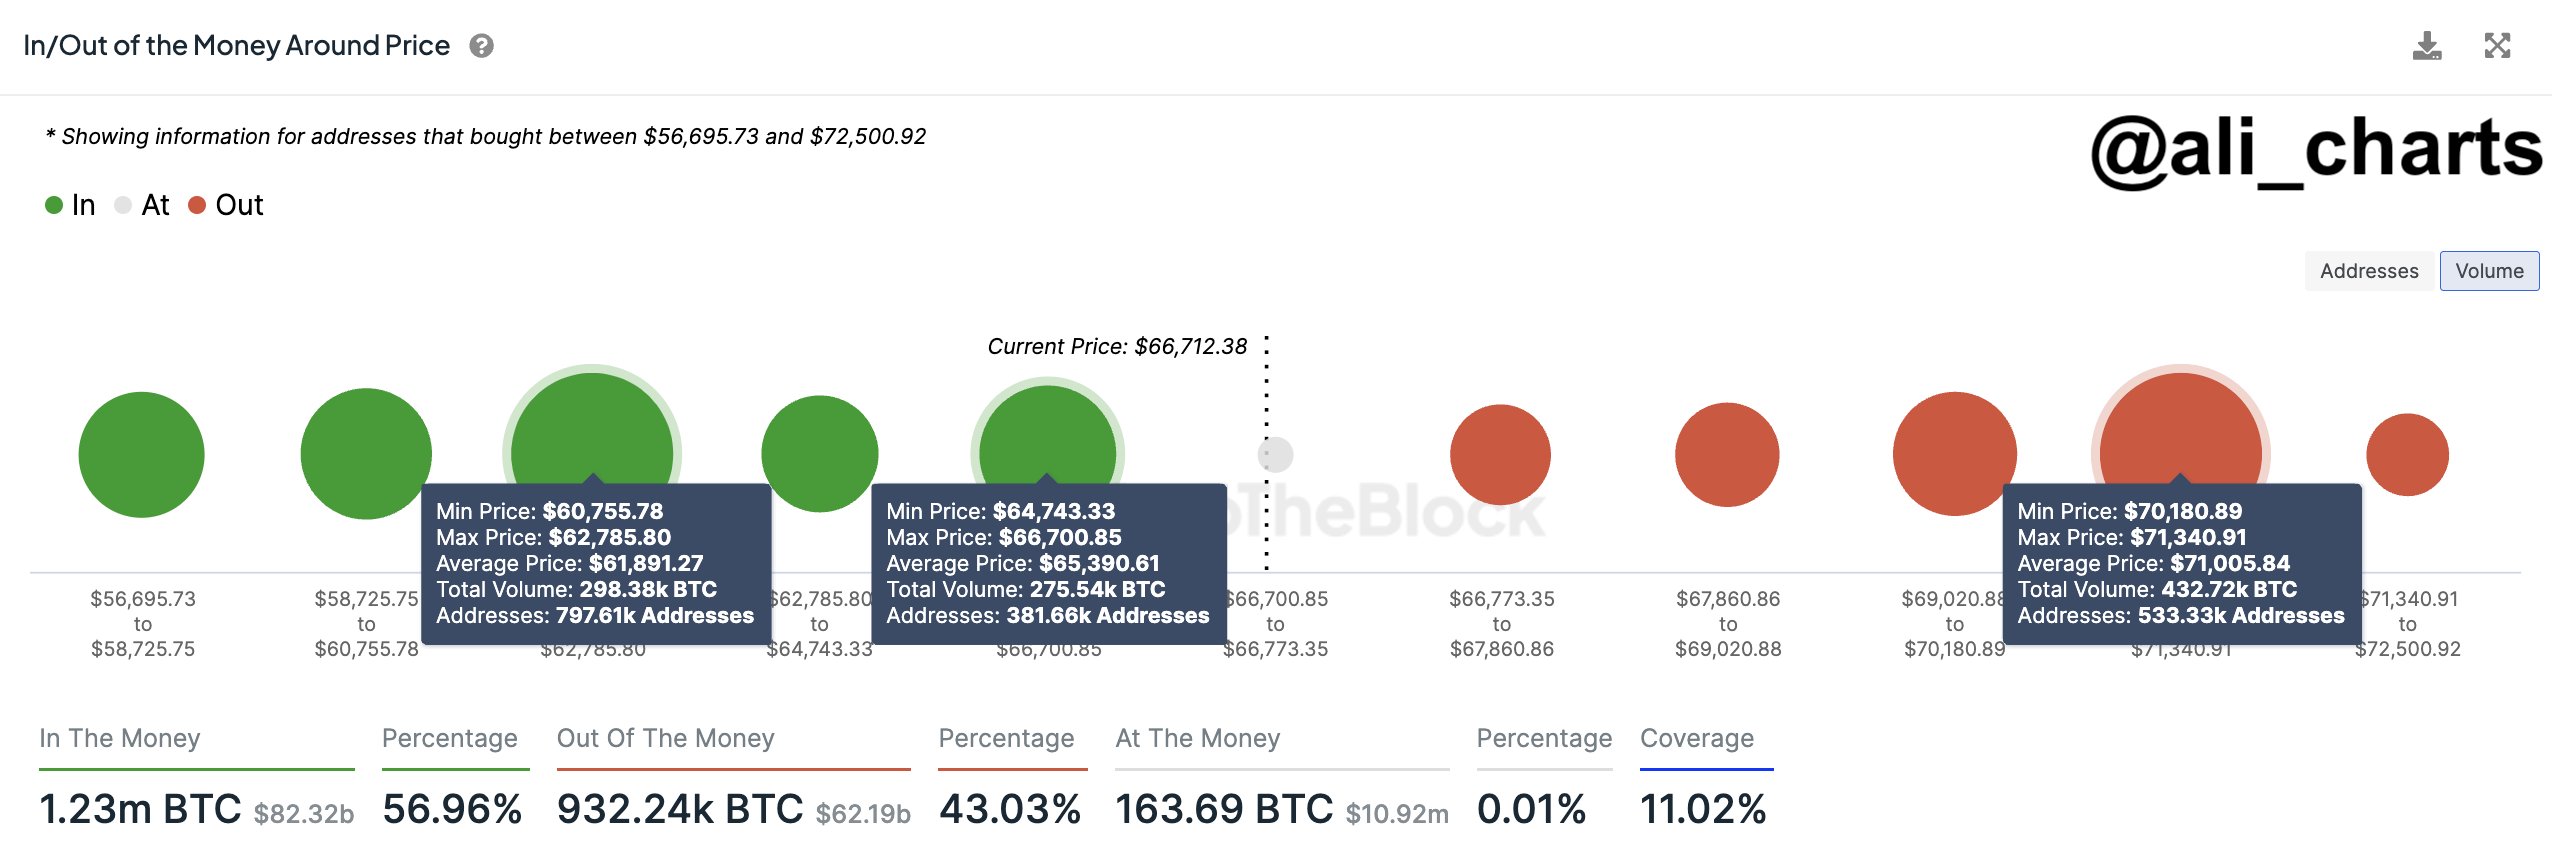
The data is from the market intelligence platform IntoTheBlock, which has used on-chain data to determine the average acquisition price for any given address based on when its coins moved into its balance.

In the chart, the size of the dots represents the amount of coins that have their cost basis inside the corresponding range. It would appear that the $64,743 and $66,700 range is below the current price that hosts the cost basis of a significant amount of addresses.

More particularly, 382,000 addresses acquired 275,450 BTC at these levels. As the Bitcoin spot price is currently trading above this range, all these investors would naturally be carrying some profits.

Generally, investors are sensitive to retests of their cost basis, as such retests can potentially flip their profit-loss status. For holders who were in profit before the retest, the dip may appear as an opportunity to buy more.

The emerging reaction can be significant when many hands share their cost basis inside the same narrow range. If this retest occurs from above, the asset could feel some support as these investors rush to accumulate more.

Since the $64,743 to $66,700 range is dense with investors and is situated below the current spot price of the cryptocurrency, it could act as a major support center.

“Monitoring this level closely is crucial, as losing it could shift the focus to the next significant demand zone between $60,760 and $62,790, safeguarded by 797,500 addresses with over 298,000 BTC,” notes Ali.

In terms of the levels above, the $70,180 to $71,340 range particularly stands out, as 533,330 addresses bought a total of almost 433,000 BTC. A lot of these new buyers would be those FOMO’ing into the asset after seeing it explore new all-time highs.

This large block, however, may serve as a point of resistance for the cryptocurrency. These fresh hands might sell just as quickly as they bought in when a retest of their cost basis happens since they may be willing to just exit at their break-even, fearing more drops in the near future.

BTC Price

Bitcoin has seen a sharp correction during the past day, following which its spot price is now trading around the $67,900 level.

Bitcoin Price Chart

Bitcoin Wallet Activity Touches 5-Month High, Will BTC Price Follow?

Despite the less-than-impressive performance over the last few months, Bitcoin investors are still digging their heels deeper into the digital asset. This is evidenced by the continuous rise in wallet activity that has been recorded during this time.

Bitcoin Wallet Activity Hits Highest In 5 Months

In a Tuesday post, on-chain data aggregator Santiment revealed that there has been a significant uptick in Bitcoin wallet activity despite the BTC price downtrend. Apparently, while the market had fluctuated heavily due to regulatory uncertainties, Bitcoin investors held their own, especially in terms of new wallet address activity.

The Santiment reports show fluctuations in this metric over the months. However, the one consistent thing was the tendency to jump back up even after dipping significantly. In September alone, the metric has moved from a low of around 860,000 to over 1.1 million unique daily Bitcoin addresses active.

Bitcoin addresses

Interestingly, this figure is the highest this metric has been since April, proving that the BTC price downtrend has not served as a deterrent for Bitcoin investors. Rather, it looks as if investors are using the current low prices as a way to increase their footprint.

The uptick can also be explained by the euphoria triggered by asset manager Franklin Templeton filing for a Spot Bitcoin ETF. While the hype around the filing was short-lived, it triggered a brief uptick in the price of the digital asset, and likely aided the rising wallet activity rate as investors rushed to take advantage of the growth.

Will BTC Price Follow Wallet Activity?

Even though wallet activity is up, the BTC price is still straining below $26,000. This could suggest that this metric does not really have much bearing on the price of Bitcoin. Rather, it just points to investors not slowing down usage of the network despite low prices.

Bitcoin BTC price chart from Tradingview.com (Wallets)

Presently, investors are still eagerly awaiting a decision on the numerous Spot BTC ETFs that have been filed by fund managers. The outcome of these filings, whether rejected or accepted, will likely be the defining factor for the Bitcoin price going forward.

For now, there are no big moves to be expected for the digital asset, especially given the fact that it is still ranging below its 50-day and 100-day moving averages. Mounting resistance between $26,000-$27,000 suggests that Bitcoin might continue to trade sideways for the better part of September.

At the time of writing, Bitcoin is treacherously holding above $26,000 with meager gains of 0.64% in the last day.