Bitcoin Still Has “A Lot Of Room To Run Before Reversal,” Says Top Analyst

An analyst has explained how the data of an oscillator for Bitcoin could suggest the cryptocurrency still has plenty of room to run in this rally.

Bitcoin VWAP Oscillator Could Imply Potential For Further Upside

In a new post on X, analyst Willy Woo discussed what the latest trend in the Volume-Weighted Average Price (VWAP) Oscillator for BTC might suggest regarding what could be next for the cryptocurrency.

The VWAP is an indicator that calculates the average price for any asset by taking into account the price fluctuations themselves and weighing the values against the trading volume.

This means that the prices of the assets where there was a higher volume of trading have a higher weightage in the average than those with only a low amount of volume.

Traditionally, the VWAP is a technical analysis indicator that considers the information available through spot exchanges. In the context of the current topic, the VWAP uses the on-chain volume of Bitcoin instead, which is readily viewable by anyone thanks to the blockchain’s transparency.

The indicator of interest here isn’t the VWAP but rather the VWAP Oscillator, as mentioned earlier. This metric keeps track of the ratio between the BTC spot price and the VWAP and presents it as an oscillator of around zero.

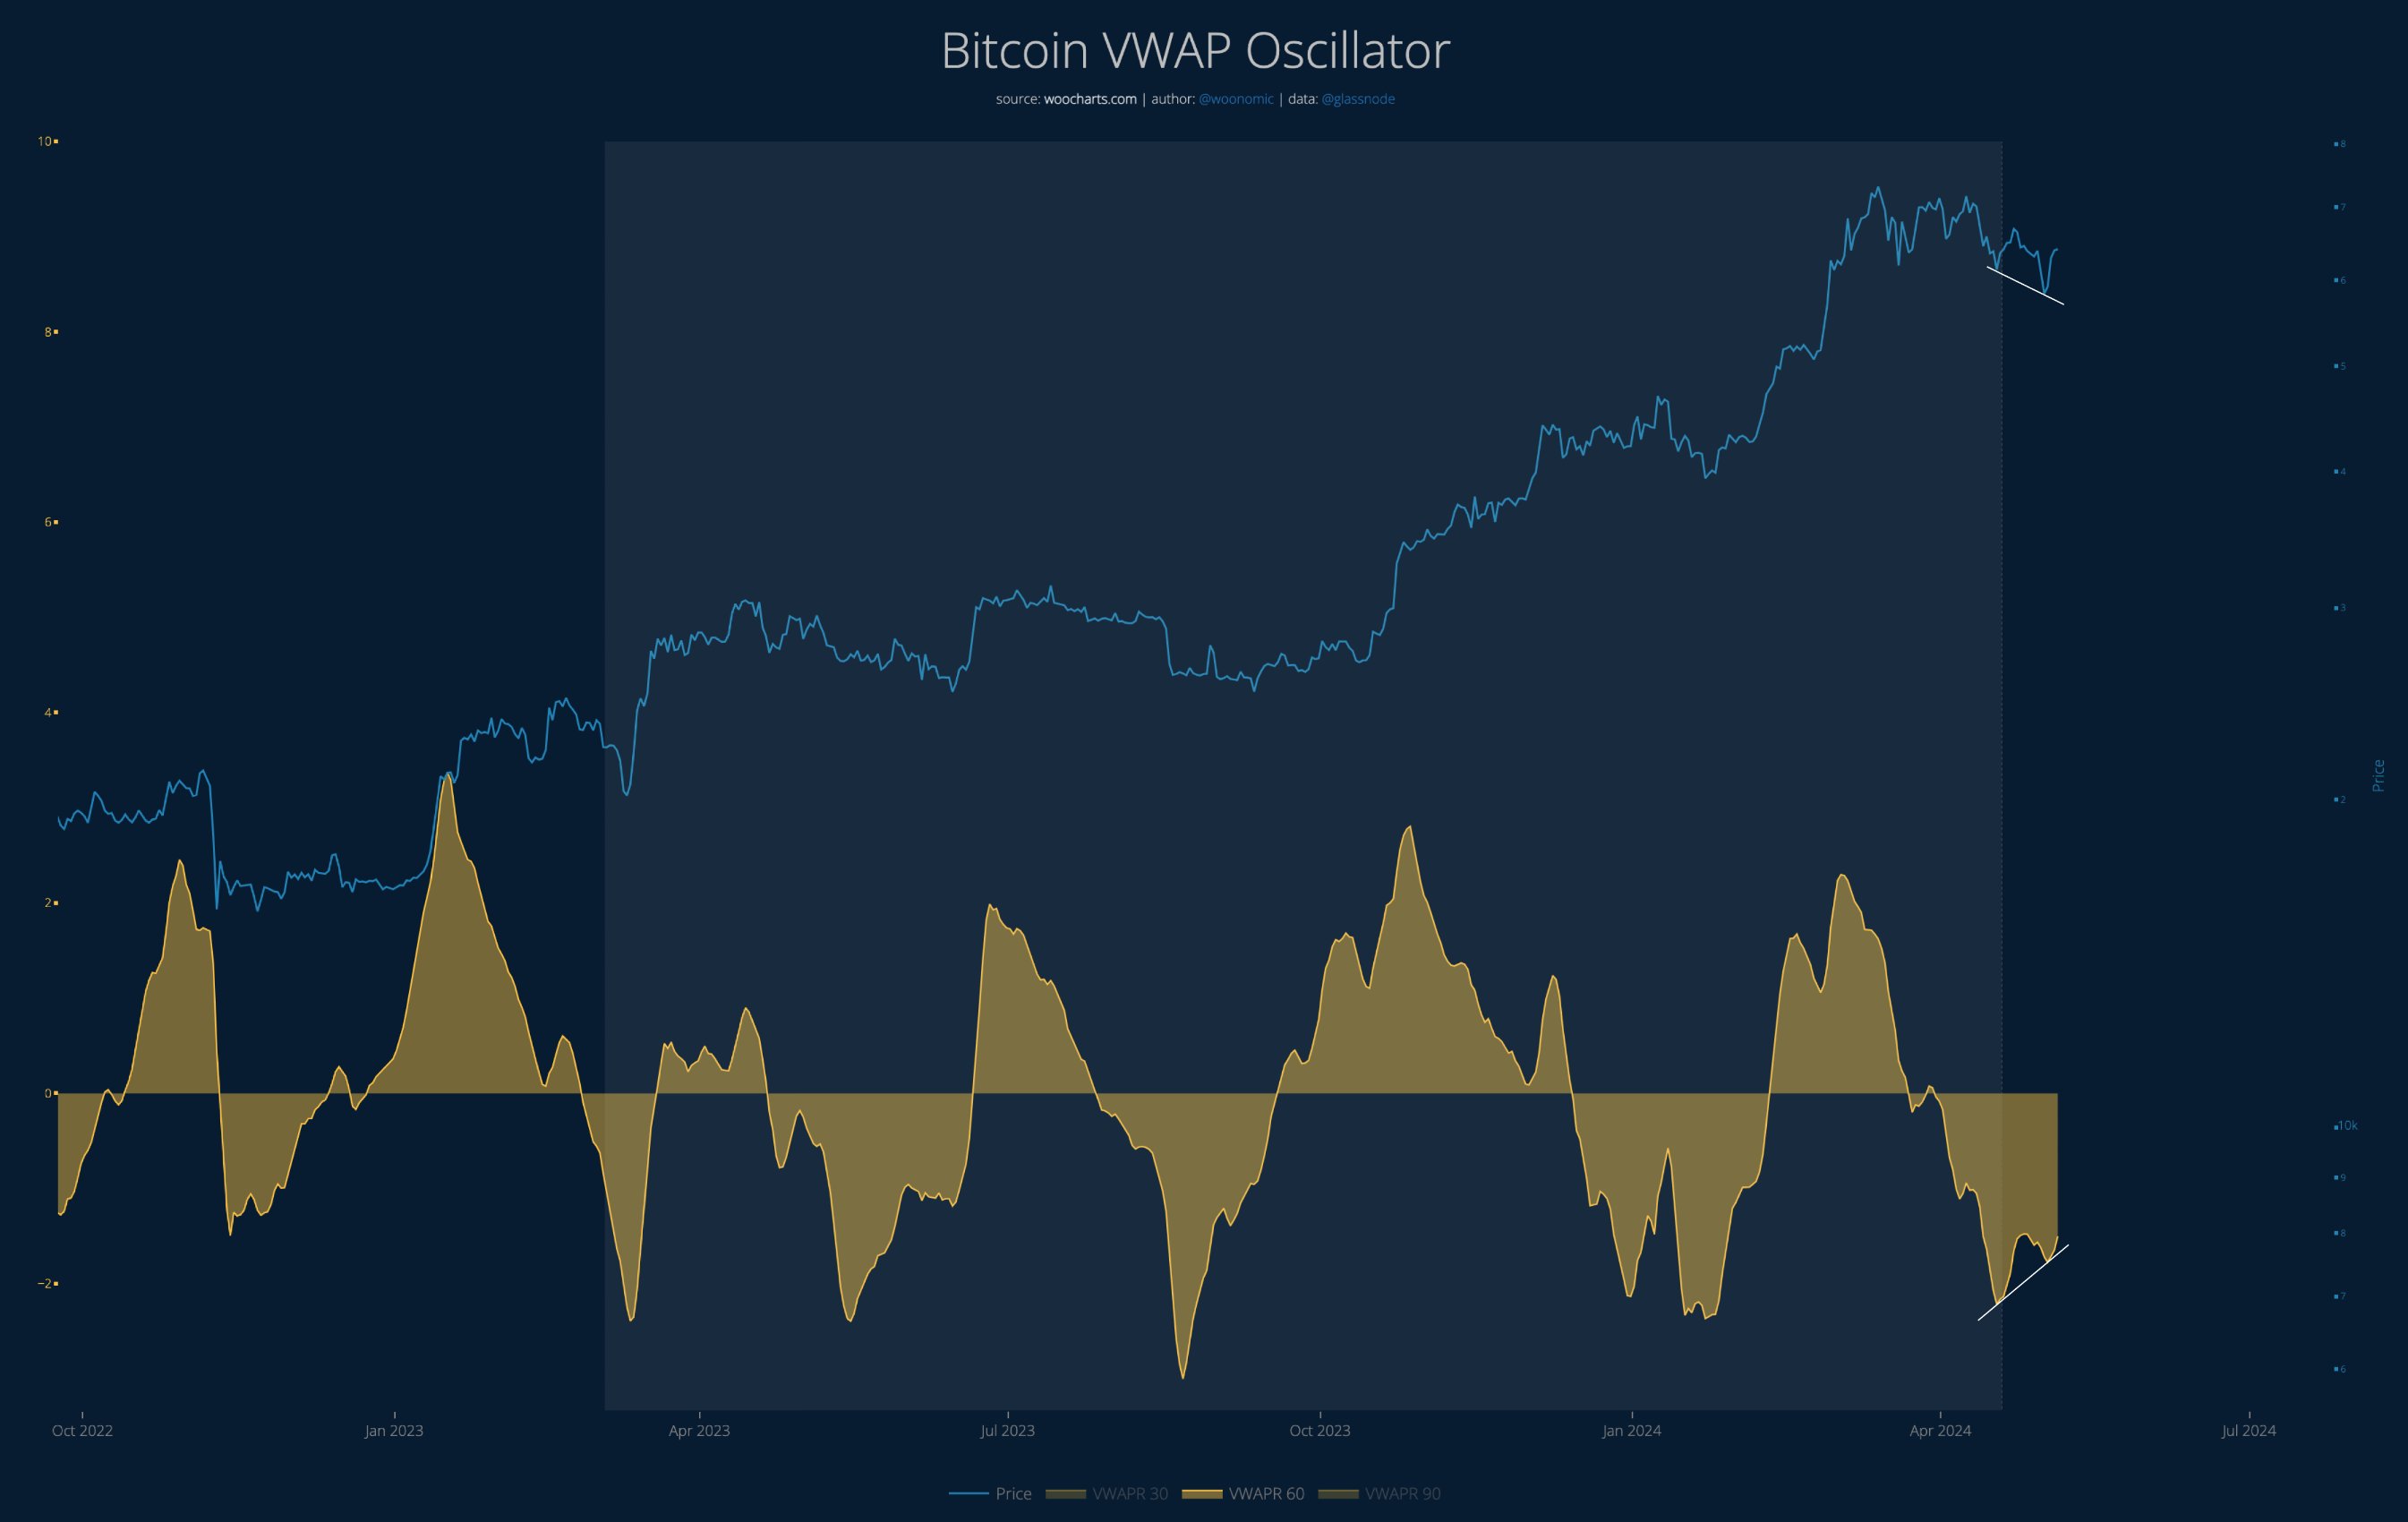
The chart below shows the trend of this Bitcoin indicator over the past couple of years.

Bitcoin VWAP Oscillator

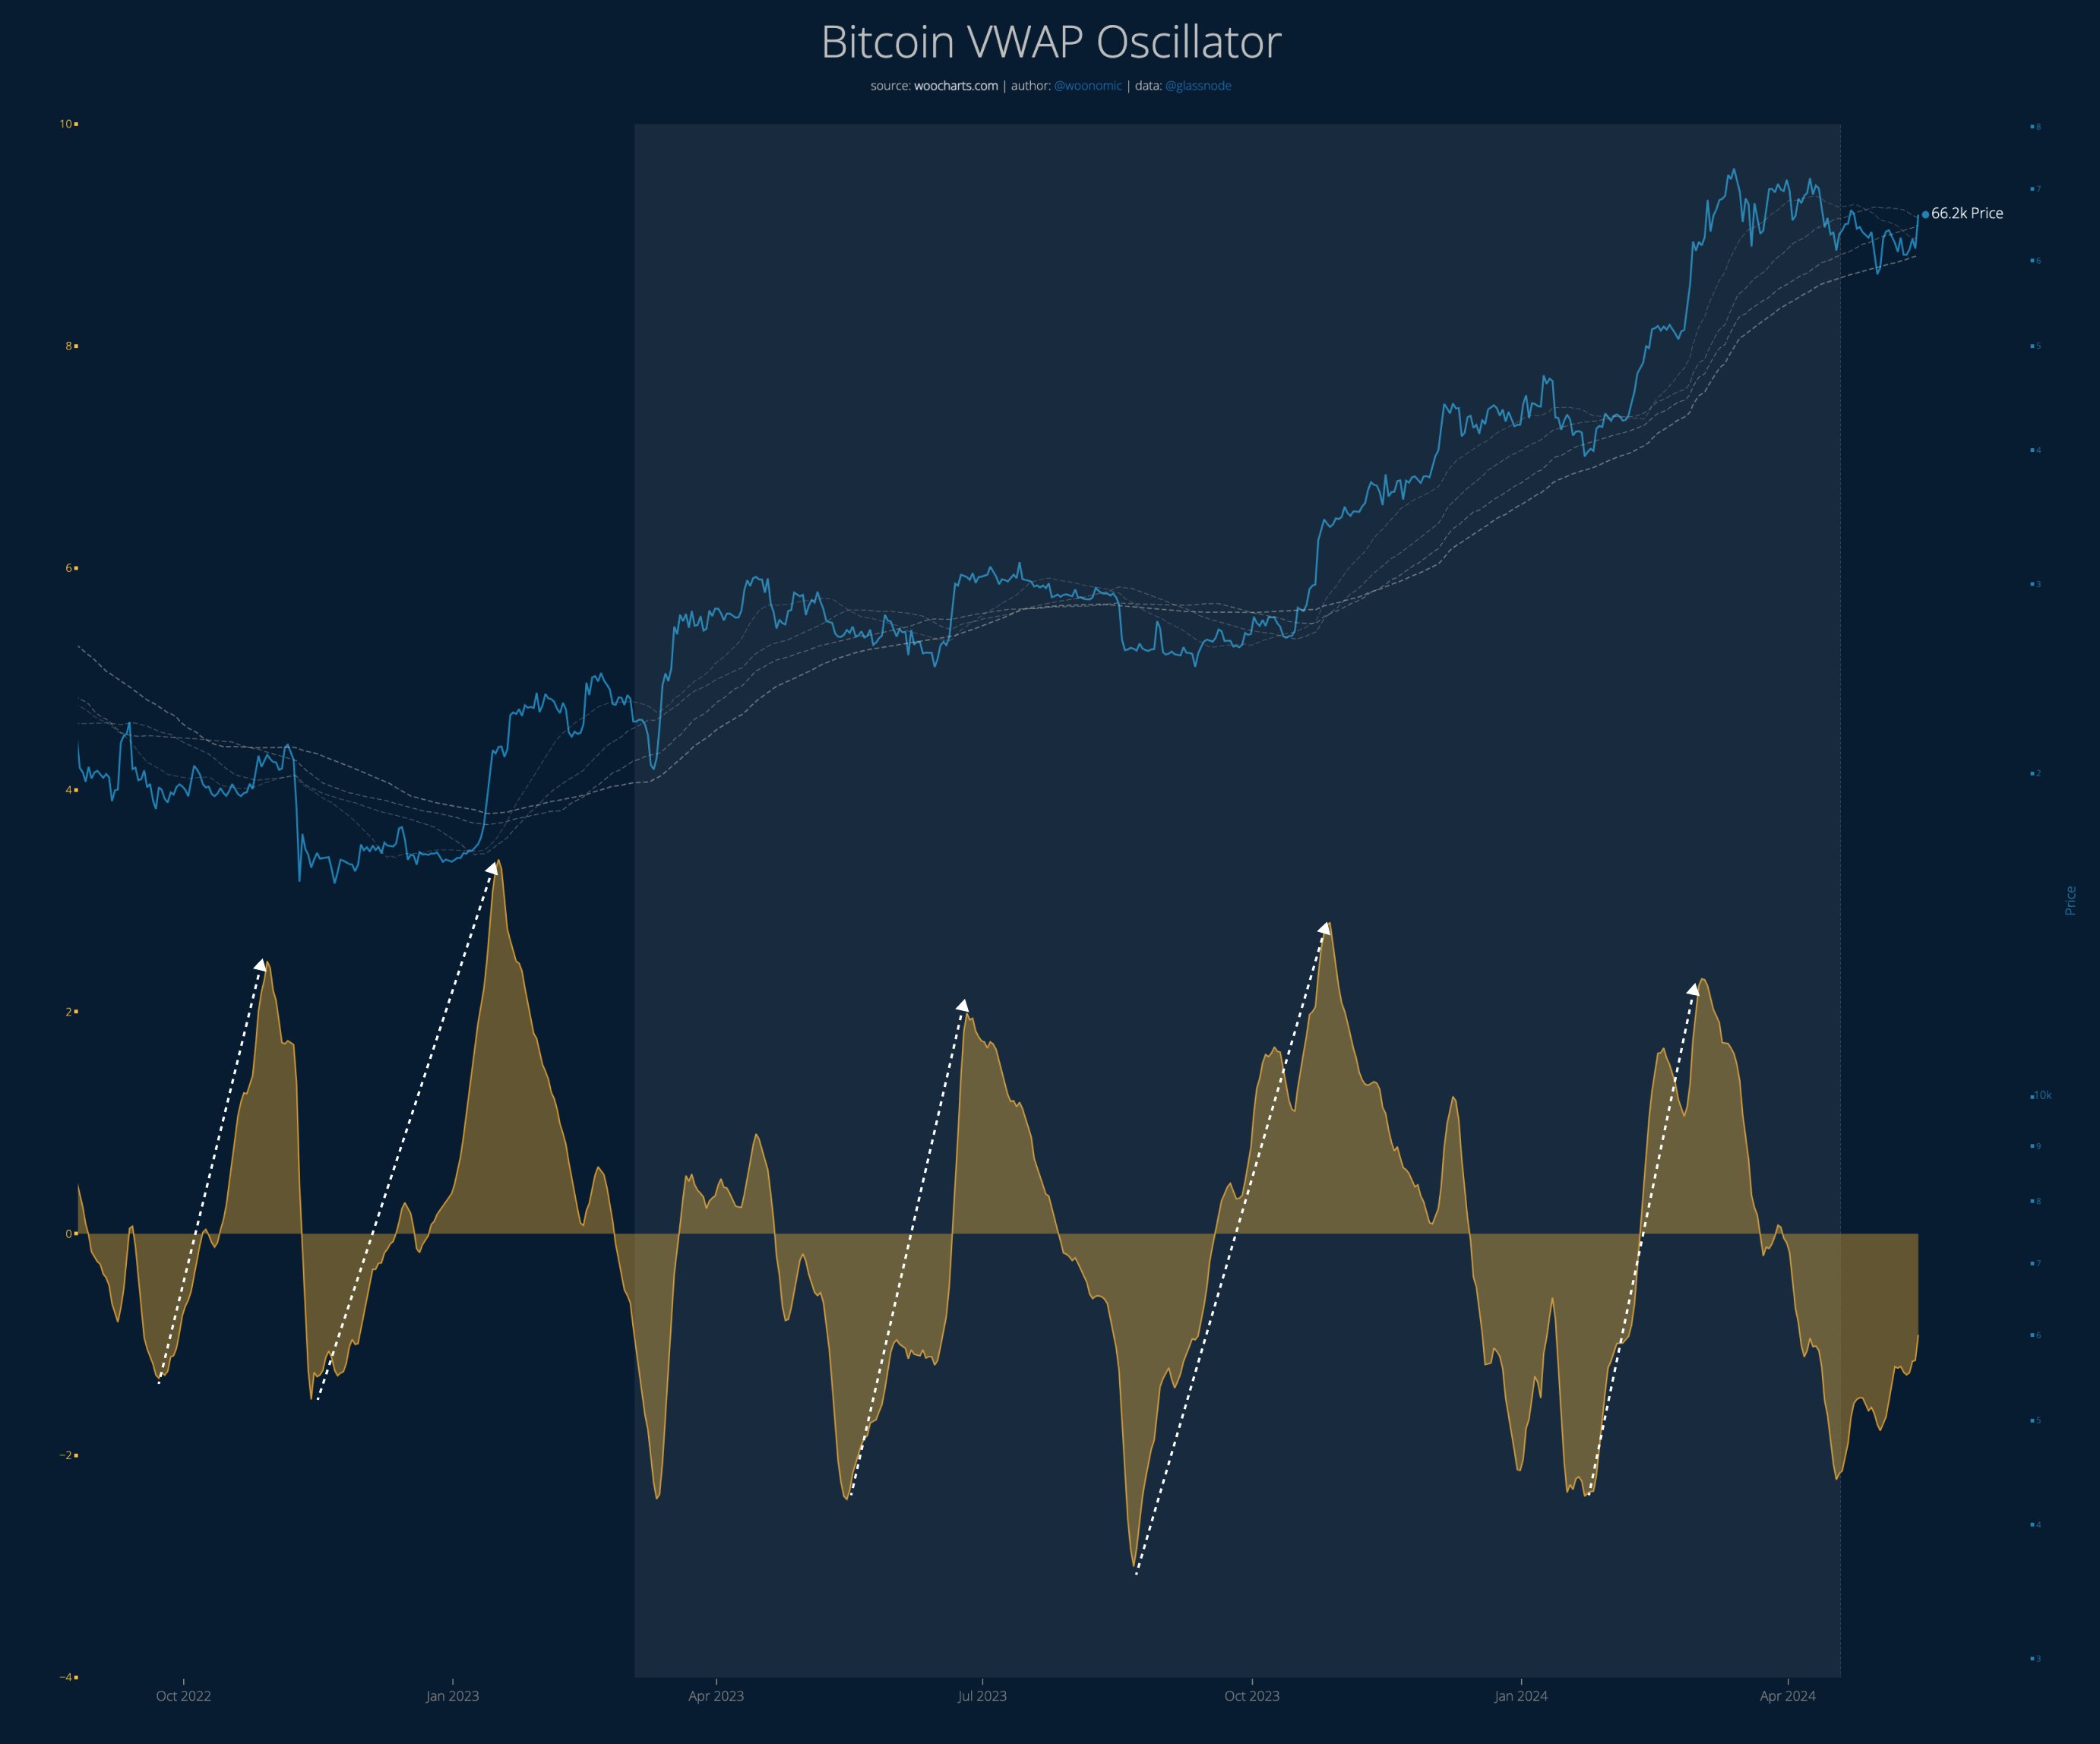
The above graph shows that the Bitcoin VWAP Oscillator has been in negative territory for the past couple of months. However, the metric’s value has been rising recently, so if it continues on this trajectory, it might approach the neutral mark shortly.

In the chart, Woo has highlighted a trend that the indicator and the cryptocurrency’s price have historically shown. It seems that whenever the metric has formed a bottom in negative territory and rebounded back to the upside, the asset has enjoyed some bullish momentum.

The resulting price surge may last until the indicator reverses into the positive territory and forms a top. That hasn’t happened for the VWAP Oscillator this time yet. “Still a lot of room to run before reversal or consolidation,” says the analyst. “Hate to be a trapped Bitcoin bear right now.”

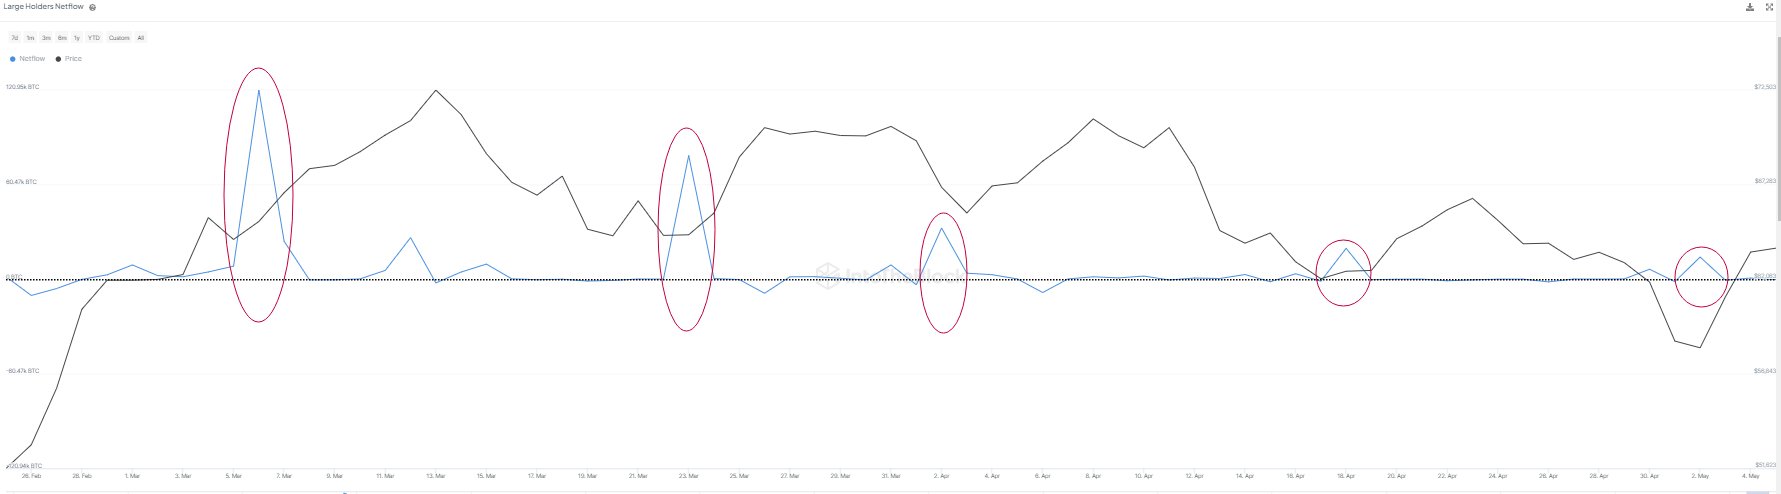
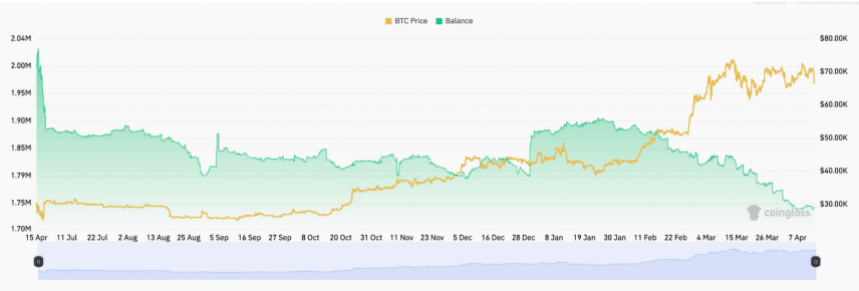
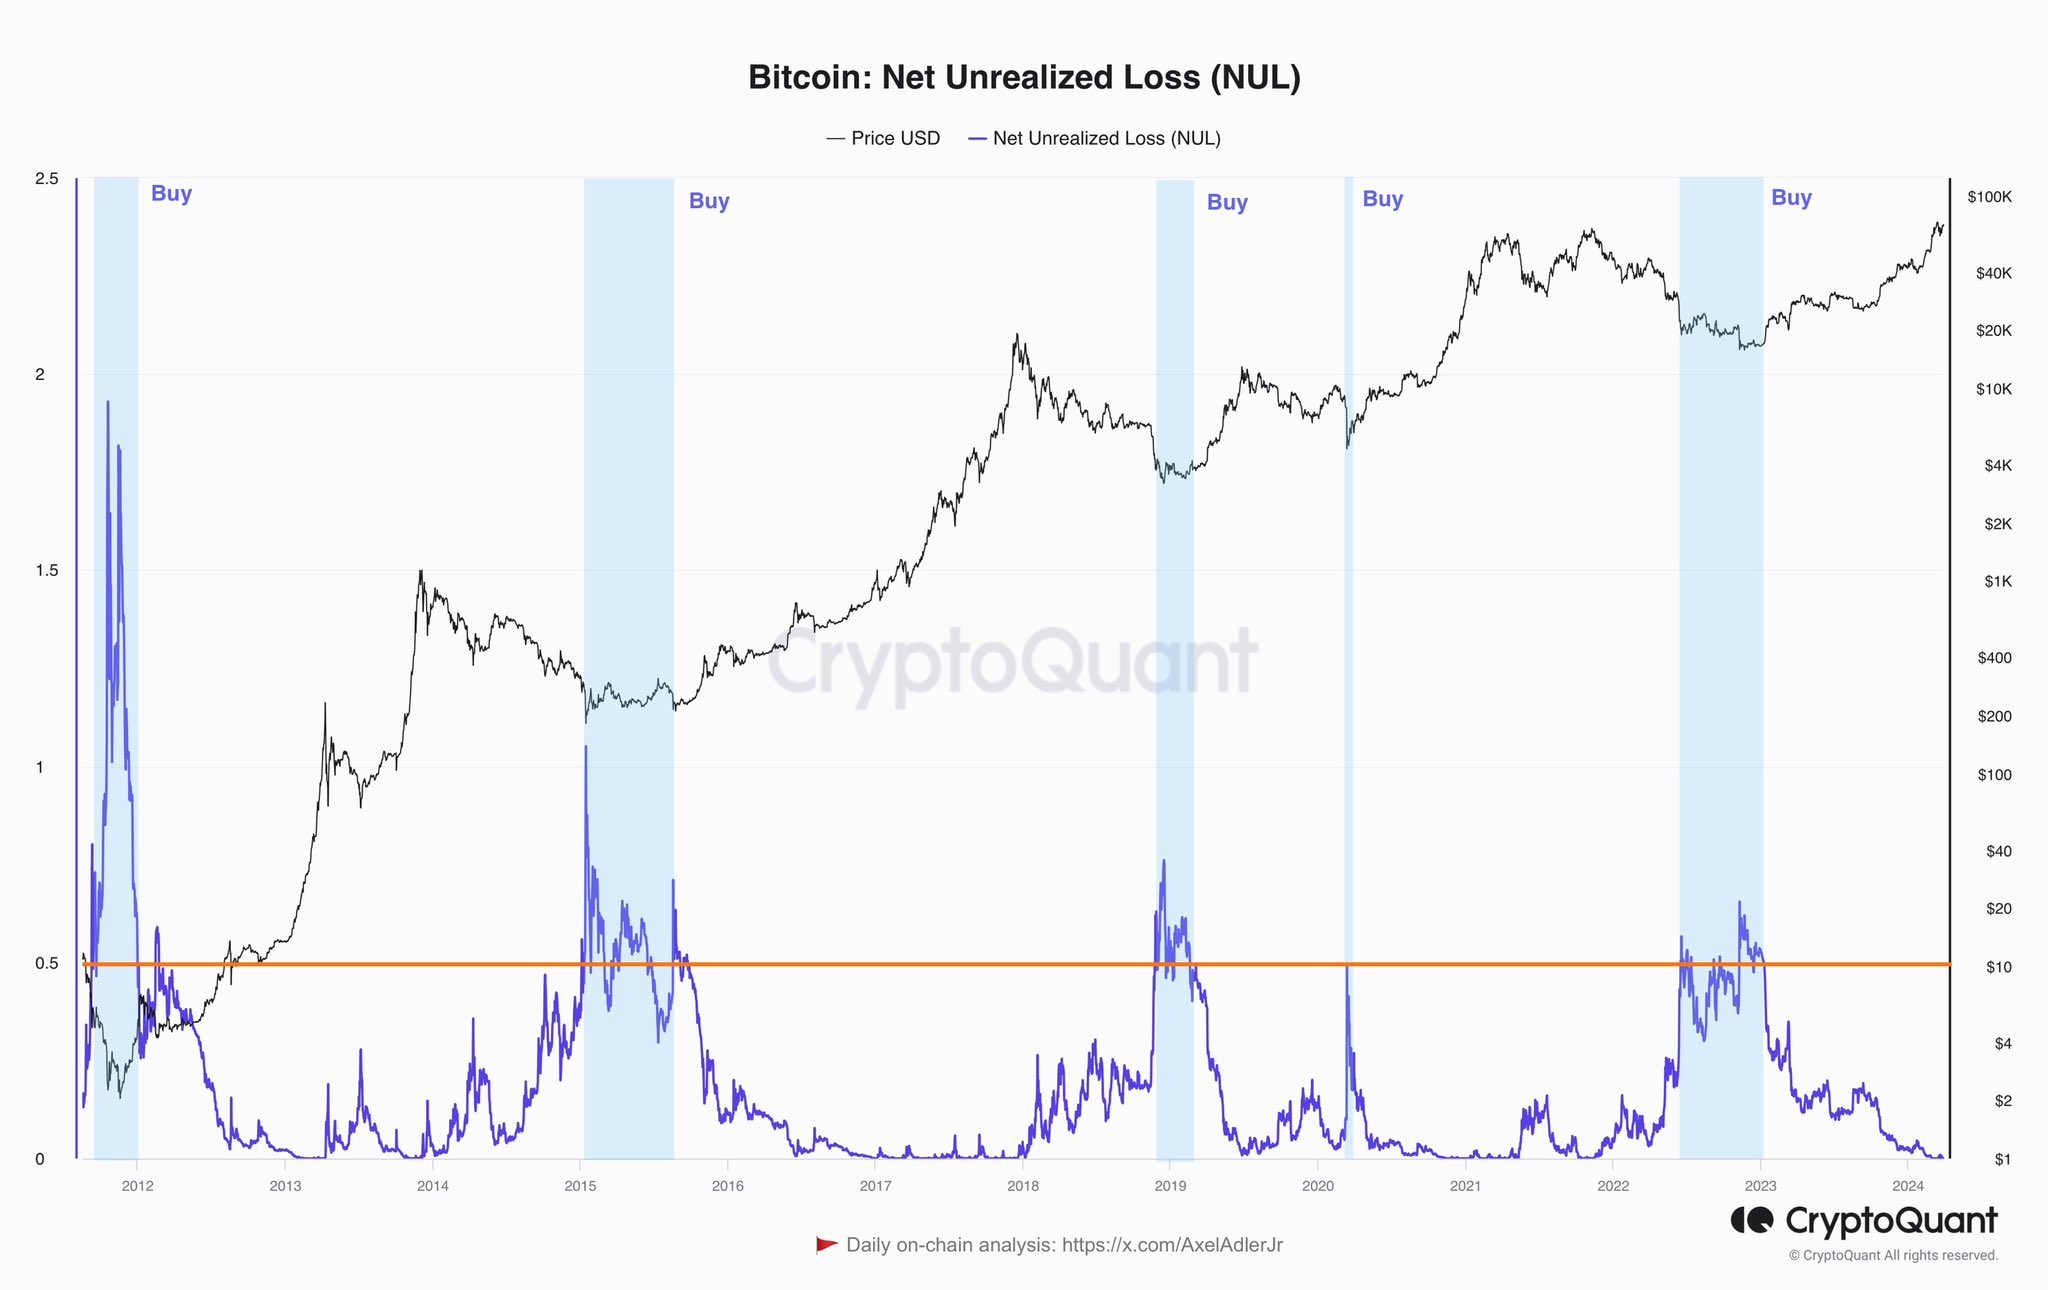
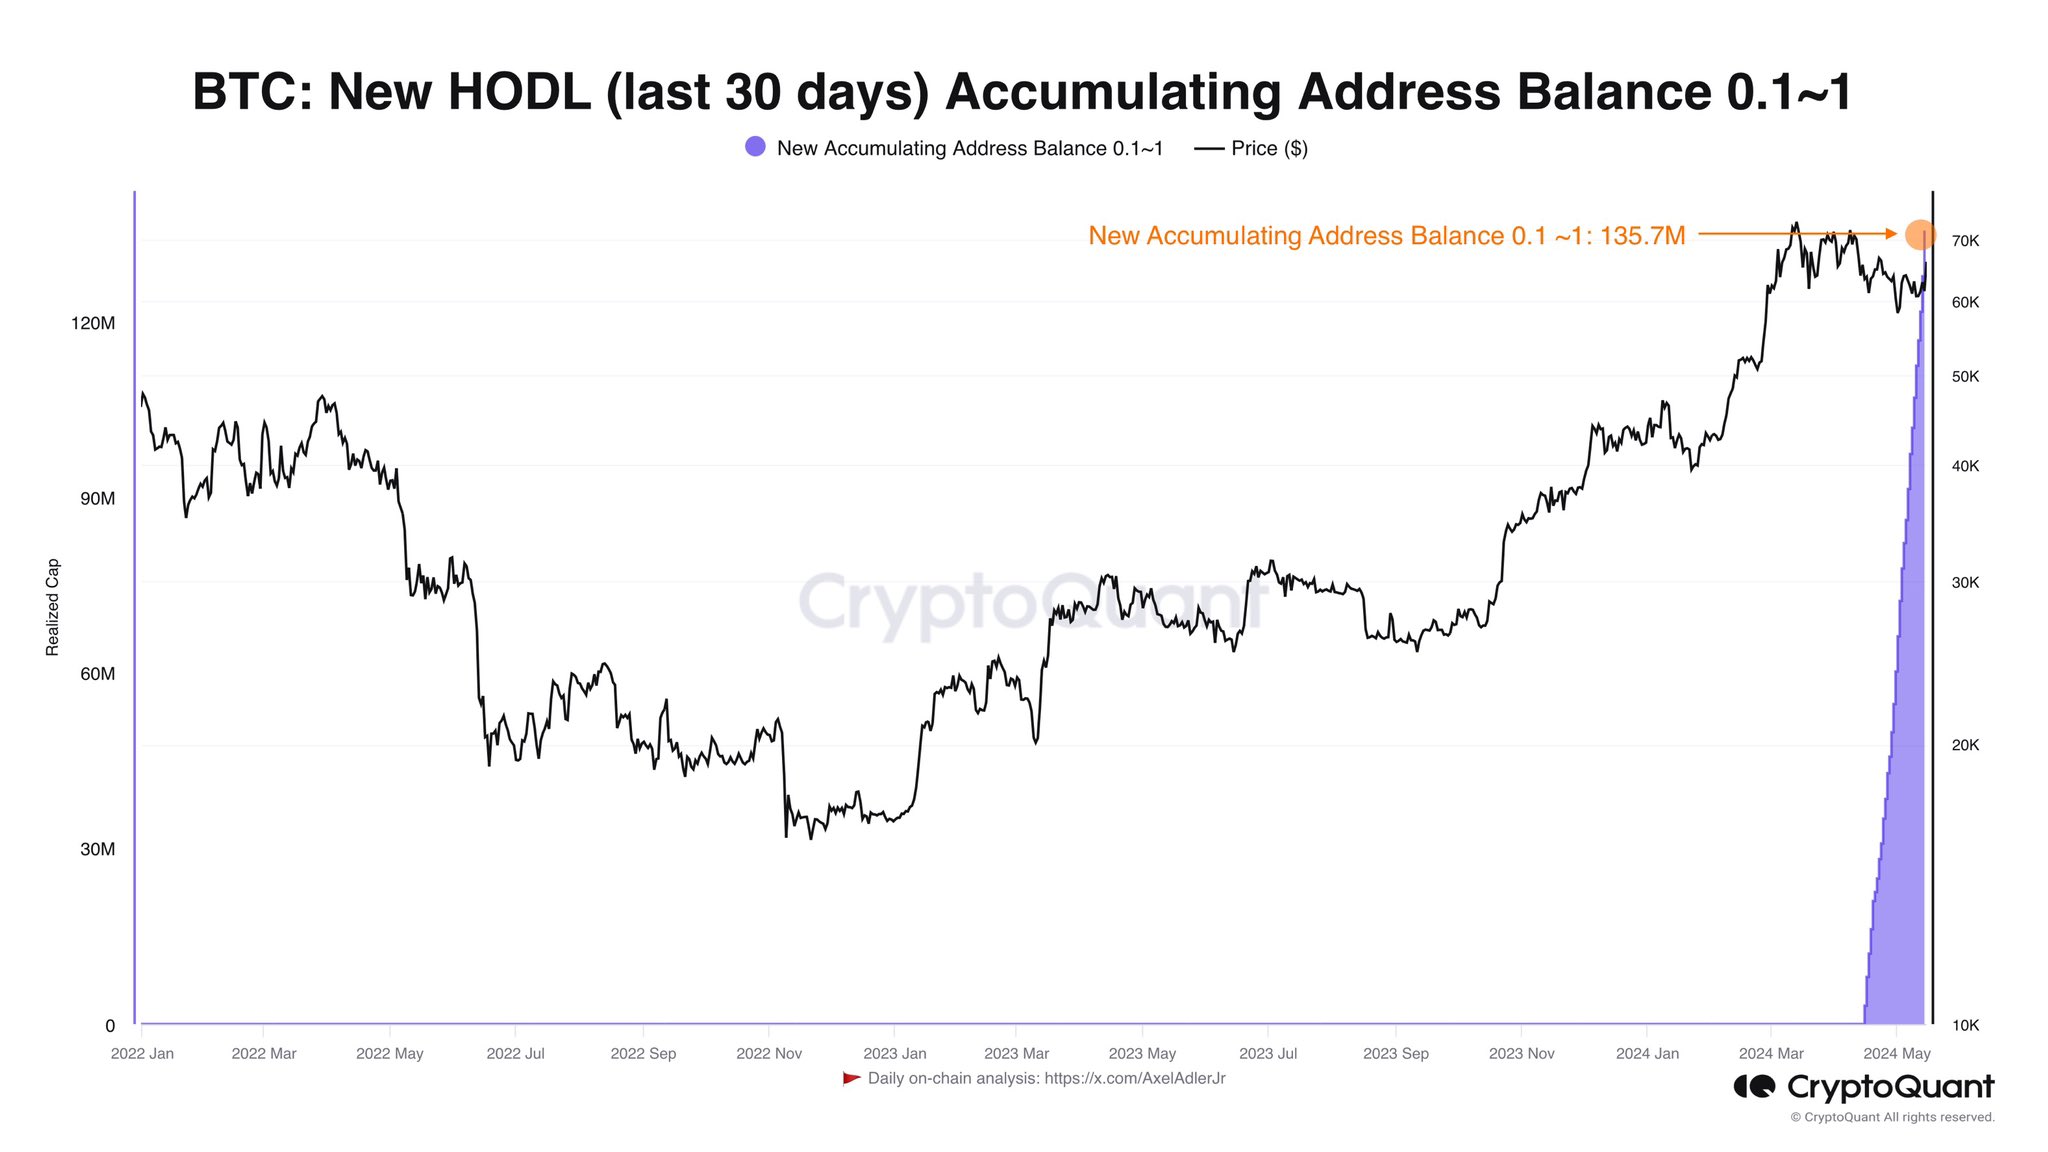
In other news, as CryptoQuant author Axel Adler Jr. pointed out in an X post, retail investors have bought $135.7 million worth of the asset over the past month.
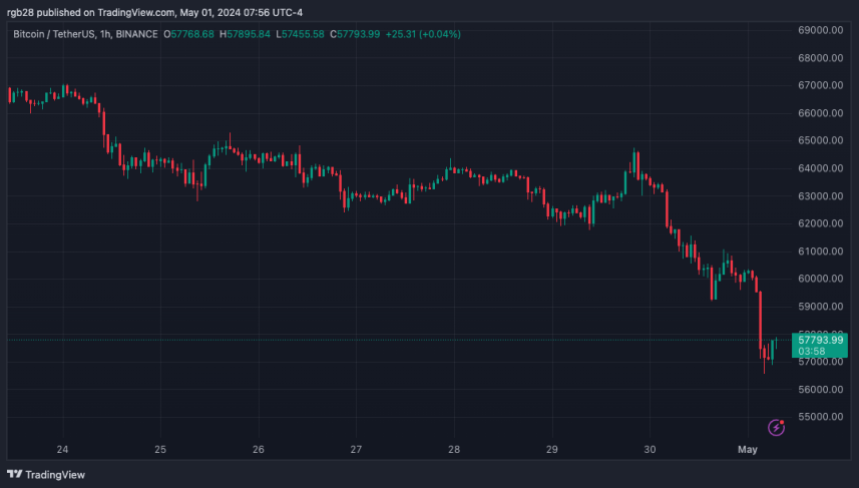
Bitcoin New HODLers

BTC Price

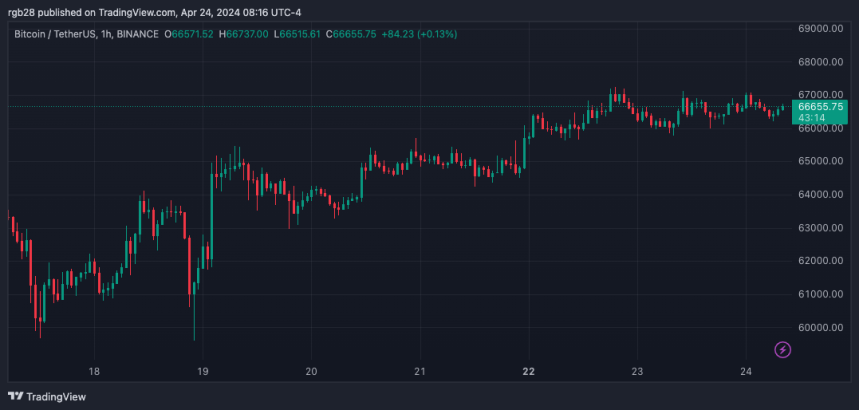
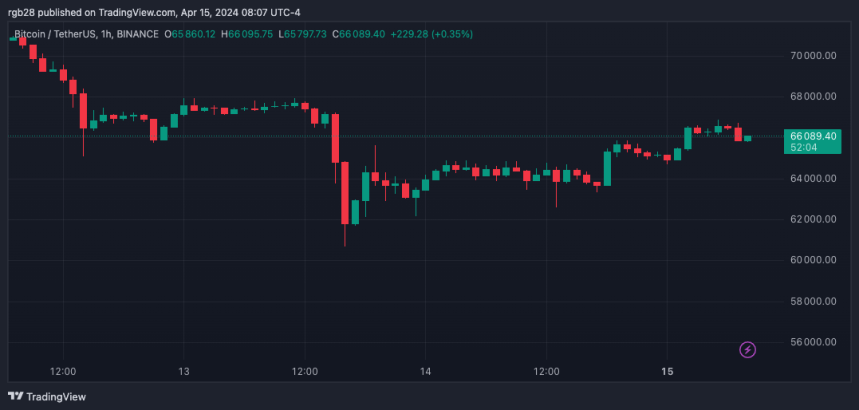
At the time of writing, Bitcoin is floating around $65,000, up 5% over the last week.

Bitcoin Price Chart

Bitcoin Analyst Reveals Why $57,938 Is The Level To Watch This Week

Crypto analyst CryptoCon has revealed a key level to watch out for as Bitcoin attempts to break critical resistance levels. The analyst suggested that a drop to this price level may not be bad for Bitcoin and could instead be necessary for it to finally make that price rally. 

$57,938 Is The Price Level To Keep An Eye On

CryptoCon mentioned in an X (formerly Twitter) post that $57,938 is the “new price to watch for the 20-week EMA (Exponential Moving Average).” He noted that such a price drop might be necessary, stating that “boredom and sideways price action allow room for growth.” Based on his analysis, any potential price decline that Bitcoin experiences is a healthy correction and shouldn’t be considered a bearish reversal. 

Bitcoin 1

Meanwhile, Bitcoin is showing impressive strength on the charts, with CryptoCon stating that the flagship crypto “continues to hold the 20-week EMA as support while visiting the almost absolute bottom of the cycle 4 DMI support zone.” CryptoCon’s positive outlook for Bitcoin provides assurance that a parabolic move is still on the horizon. 

Crypto analyst Rekt Capital also recently shared a positive outlook for Bitcoin. He revealed that Bitcoin was out of the “Danger Zone,” suggesting that the flagship crypto was primed for a move to the upside. The analyst also remarked that Bitcoin was running out of unremarkable months before it began its parabolic phase. 

Crypto analyst Mikybull Crypto hinted that Bitcoin was already showing signs of this imminent parabolic phase. In an X post, he mentioned that Bitcoin was displaying a cup and handle reversal pattern on the weekly chart and that the “breakout will be explosive and will send it to a cycle top.”

Bitcoin 2

While agreeing with Mikybull Crypto’s analysis, Crypto analyst BitQuant mentioned that $95,000 will be “achieved in one move, and that is quite obvious.” He, however, noted that it remains uncertain when this move will happen and called for patience as everyone waits for Bitcoin “to perform as expected.”

BitQuant further advised that it might be better to leave the market for those who can’t “avoid the torture,” claiming that there “will be a lot of pain for those with weak nerves” in the coming months. Based on Arthur Hayes’s prediction, investors might have to wait until August for that big move from the flagship crypto. 

Bitcoin Is Still Far From Its Market Top

In a recent X post, Rekt Capital suggested that Bitcoin was still far from its market top. He highlighted past cycles, which show that the bull market peak usually occurs between 518 and 546 days after the halving. Based on this, the analyst predicts that the flagship crypto will likely peak in September or October 2025. 

Bitcoin 3

The crypto analyst also acknowledged that Bitcoin has been accelerating in this cycle by over 200 days. However, he remarked that Bitcoin could resynchronize with past halving cycles if it continues to consolidate for longer. 

Bitcoin price chart from Tradingview.com

Are We Out Of The Woods? Analyst Bullish On Bitcoin’s 6-Figure Future

Bitcoin (BTC) began the month with the deepest retrace of the cycle, falling to the $56,000 support level. The retrace raised alarms for some crypto investors and market watchers, who feared the bull run had ended.

Since then, the largest cryptocurrency by market capitalization has recovered crucial levels, and analysts have identified bullish patterns on BTC’s chart, suggesting that it might finally be out of the woods.

Is Bitcoin Out Of Danger?

As the May 1st retrace developed, crypto analyst Rekt Capital highlighted the similarities between Bitcoin’s 2016 and 2024 post-halving performances. He suggested that the flagship cryptocurrency’s price development came “as no surprise,” as it was mirroring the “post-Halving Bitcoin Danger Zone” of 2016.

Per the analyst, the “Danger Zone” is officially over, which BTC is “celebrating with a good bounce from the Re-Accumulation Range Low support.” He stated that May could be an “unremarkable” month for the largest cryptocurrency, potentially continuing next month. However, Bitcoin is “running out of unremarkable months” before the beginning of this cycle’s “Parabolic Phase.”

Additionally, Rekt Capital considers that BTC’s sell-side momentum is starting to show signs of slowing down, “slowly developing a curl against the $60,000 support.” Per the post, Bitcoin must continue to hold this support zone for the curl to “progress and eventually lift up.”

bitcoin

Similarly, analyst Bluntz identified a bullish engulfing pattern on Thursday, considering there would be “a solid engulfing on the daily close.” To the analyst, it appeared that the “next push-up into ATH has started.”

This morning, Bluntz confirmed the pattern formation and announced to his followers that this cycle’s Round 2 began, which would lead to a “fresh ATH.”

BTC’s Strength Could Lead The Price To 6-Figures

Following the bullish analysis, CryptoJelle stated that BTC “is looking good.” Per his post, the cryptocurrency “has nearly completed a full reset,” as it’s back to the 100-day Exponential Moving Average (EMA).

Additionally, the chart displays a “bullish MACD cross” below the zero line and the “first higher low in a long time,” suggesting a positive divergence.

Jelle highlights that BTC’s price is again pushing into the trendline that “has pushed prices lower over the past weeks.” Despite the higher low, he points out the necessity of reclaiming the $63,000 support zone before new highs come.

For these new highs, he set an $82,000 target for BTC’s price, suggesting that a 6-figure price for the flagship cryptocurrency is possible during this cycle.

The analyst emphasizes Bitcoin’s performance this cycle, stating that the community has under-appreciated its strength during this bull run. He considers that the run is not over, as the “Halving” event occurred just a few weeks ago, and BTC’s price has been consolidating around the previous cycle’s all-time high for a long period.

On Monday, Bitcoin surged to $63,000 after hovering between $60,000 and $61,000 for the past few days. Despite its recent performance showing short-term red numbers, BTC’s price still registered a 25.7% and 76.5% increase in the three-month and six-month periods, respectively.

At the time of writing, BTC is trading at $62,752, a 3% increase in the past 24 hours.

BTC, BTCUSDT, Bitcoin

Bitcoin To Reach Escape Velocity? Analyst Makes The Case

An analyst has explained how Bitcoin seems to be showing a good setup to reach escape velocity based on the trend in this indicator.

Bitcoin VWAP Oscillator Has Been Showing A Bullish Divergence

As explained by analyst Willy Woo in a new post on X, a bullish divergence has appeared to be forming in the Volume-Weighted Average Price (VWAP) oscillator of the cryptocurrency.

The VWAP is an indicator that calculates an average price for any given asset, taking into account not only the price but also the volume. More formally, it’s calculated as the cumulative price sum multiplied by the volume divided by the cumulative volume.

This metric puts a higher weight on the price at which more volume is traded. Usually, the exchange-reported volume is used to find the metric, but for a cryptocurrency like Bitcoin, the entire transaction history is visible to the public thanks to blockchain data. Woo has used on-chain volume instead to calculate the VWAP for BTC.

The VWAP oscillator, the actual indicator of interest here, is a ratio between the asset’s spot price and VWAP. Here is the chart shared by the analyst that shows the trend in this metric over the past couple of years:

Bitcoin VWAP Oscillator

As displayed in the above graph, the Bitcoin VWAP oscillator has been in the negative territory for the past month but has recently shown a turnaround.

Although the metric is heading up, it’s still very much contained inside the red zone. At the same time as this rise, the cryptocurrency’s price has been heading down instead.

According to Woo, this is a bullish divergence forming for the asset and it’s also one that has a “lot of room to run,” since tops in the coin have generally occurred when the oscillator has reached a point of reversal at relatively high levels inside the positive zone, which should still be quite far away.

“Seems like a good setup for BTC to reach escape velocity,” notes the analyst. It remains to be seen whether the bullish divergence will end up bearing fruits for the asset.

In some other news, the Bitcoin whales (investors carrying 1,000 BTC or more) participated in buying around the recent lows of the asset. Still, market intelligence platform IntoTheBlock has revealed that the accumulation sprees from these large investors have been displaying an overall downtrend.

Bitcoin Whale Accumulation

From the chart, it’s visible that the Bitcoin whales have been buying at each of the dips in the last few months, but it’s also visible that the scale of this buying has been diminishing with each one.

This could be a sign that the appetite for buying among these investors, although still present, is getting smaller with each dip.

BTC Price

When writing, Bitcoin is trading at around $63,500, up over 1% in the last seven days.

Bitcoin Price Chart

Is This Cycle’s Bitcoin Bottom In? Analysts Forecast BTC Bounce Back

As May 1st started, Bitcoin (BTC) faced a new correction that made the price stumble under the $60,000 support level. The flagship cryptocurrency has seen several retraces during this bull cycle, with BTC swiftly recovering the crucial support zones each time.

However, in the past 24 hours, the largest cryptocurrency by market capitalization has struggled to regain its momentum. Some analysts believe Bitcoin’s bottom this cycle might be in as this correction officially became its deepest retrace.

Is The Bitcoin Bottom Here?

In the early hours of Tuesday, Bitcoin started to plunge from the $64,000 price range. As the day continued, BTC prolonged its fall to briefly trading around $59,958 – $59,191 before recovering.

This time, the recovery didn’t last long as Bitcoin’s price resumed its downward trajectory to $57,000. In an X thread, crypto trader Milkybull examined some data suggesting the bottom might finally be in.

According to the analyst, BTC is “following the 2017 PA.” This would suggest that “either the bottom is in or close.” Moreover, he urged investors to remember that while good news “usually signals the top,” bad news signals a bull market’s bottom.

In the thread, the trader pointed out that the Bitcoin Bull Market Support Band indicator historically serves strong support during BTC’s bull cycles. As a result, he considers that the flagship cryptocurrency might “wick through the support and bounce back.”

Bitcoin, BTC

According to the analyst, Bitcoin and global liquidity are also strongly correlated, with BTC currently at a level it has previously bounced back from. These bouncebacks initiated “huge rallies across the crypto market” in October 2022 and October 2023.

Lastly, the thread highlighted that Bitcoin “is at a critical decision point for the local bottom.” The trader considers that while some call for a $48,000 bottom, the $51,000 support level might be where BTC bounces back to resume its cycle to this cycle’s top.

Bitcoin’s Deepest Retrace This Cycle

According to crypto analyst and trader Rekt Capital, this correction has officially been the deepest BTC retrace this cycle. Per the post, today’s -23.64% retrace surpasses the -22.91% retrace seen in February 2023.

The analyst also compared this cycle’s “Post-Halving” pullback to 2016’s. Moreover, the trader considers that this bullish cycle might be more similar to the 2016 one than investors think.

Previously, Rekt Capital listed three reasons these two cycles might be similar. Per the trader, the resemblances include the “Pre-Halving Re-Accumulation Range Breakout,” the “Pre-Halving Retrace Beginning,” and the “Similar Initial Reaction after the beginning of the Pre-Halving Retrace.”

After today’s retrace, the analyst added the “Continued downside in the three weeks after the Halving” as a fourth similarity between the 2016 and 2024 cycles. Like eight years ago, Bitcoin faces an “additional downside below the Range Low of its Re-Accumulation Range” in the three-week window after Bitcoin’s “Halving.”

Moreover, the analyst suggests that the current price development comes “as no surprise,” as it mirrors 2016’s “post-Halving Danger Zone.”

As of this writing, the flagship cryptocurrency is trading at $57,794.89. This correction represents a 6.2% drop in the past 24 hours. Similarly, BTC is registering 13.4% and 17.7% price decreases in the weekly and monthly timeframes.

BTC, Bitcoin, BTCUSDT

Is Bitcoin Getting Ready For An Explosive Breakout? These Analysts Believe So

The fluctuations in Bitcoin’s price have marked the tempo of the crypto market and the community’s sentiment. While some feel pessimistic about the rally slowdown, some analysts believe the flagship cryptocurrency is just getting ready to reach higher notes.

Next Stop: Bitcoin’s “Parabolic Upside”

Crypto analyst and trader Rekt Capital considers Bitcoin (BTC) is currently awaiting a period of consolidation. In an X post, the trader highlighted that, during the previous “Halvings,” BTC saw “Re-Accumulation Ranges.”

The analyst shared his chart for Bitcoin phases during the “Halving,” which he has previously used to explain BTC was at the “Last Pre-Halving Retrace” before April 19.

At the time, the analyst pointed out that the re-accumulation phase was next. Bitcoin went through one during the previous “Halving,” as seen in the chart.

The re-accumulation consisted of two consolidation periods followed by the “Post-Halving Parabolic Upside,” which saw BTC reach last cycle’s all-time high (ATH) of $69,000.

Bitcoin, BTC

Rekt Capital highlighted that, during this cycle, the flagship cryptocurrency has already experienced five re-accumulation ranges. Similarly to the last cycle, the latest re-accumulation phase seems to have started during the “Pre-Halving Rally” phase. Per the analyst, this will be followed by the “Parabolic Upside” if history repeats itself.

Analyst Mikybull seems to share a similar view to Rekt Capital’s, as he highlights that Bitcoin’s “parabolic rally is loading.” The re-accumulation breakout is set to be “explosive,” and “not many are prepared for this,” he added.

The analyst explained that “the RSI on a macro scale is at the same level as it was in 2017, which was followed by a huge rally to cycle top.” Based on this, he believes the current consolidation comes from institutions preparing “for a huge rally to cycle top.”

Analyst Sets Crucial Level For Bitcoin’s Breakout

A day before Bitcoin’s “Halving,” the cryptocurrency faced a correction that shredded 7% of its price in a few hours. BTC went from hovering between the $64,000-$63,000 price range to trading below the $60,000 support zone.

Since then, the largest cryptocurrency by market capitalization appears to have steadily recovered from the drop. Over the weekend, Bitcoin regained the $65,000 support level before testing the $66,000 one, which it reclaimed on Monday.

Over the last few days, BTC has hovered between $66,000 and $67,000. However, it has not been able to successfully test the resistance level set at the $67,000 price range.

According to the crypto analyst Bluntz, Bitcoin’s most recent performance suggests that the price will continue to move sideways between the $66,000 and the $67,000 range.

However, he also considers that BTC is “gagging for a breakout soon,” as the chart displays a bullish pennant pattern forming. Per the analyst, “once we clear 67k,” the whole market will fly above the latest ATH.

As of this writing, Bitcoin is trading at $66,665, a 7.5% increase from a week ago and a 66.22% in the last three months.

BTC, BTCUSDT, Bitcoin

Is Bitcoin About To Skyrocket? Bitfinex Analysts Spot Familiar Patterns From December 2020

According to analysts at Bitfinex, Bitcoin and its recent activity on exchanges reflects a pattern reminiscent of December 2020, hinting at a possible growth phase.

The exchange’s latest report highlights a significant decline in the supply of Bitcoin held by long-term investors on centralized exchanges, reaching its lowest levels in 18 months.

This trend, coupled with the forthcoming halving event, suggests a scenario conducive to further price appreciation, as stated by the analysts.

Potential Growth On The Horizon

The Bitfinex Alpha report underscores the diminishing inactive supply of Bitcoin, particularly those assets stagnant for over a year. This reduction implies that long-term holders either reduce their positions or transfer their assets off exchanges.

Bitcoin Exchange Supply.

Such actions are fundamental to understanding Bitcoin’s price dynamics, especially as the halving event approaches.

With an increasing number of BTC leaving centralized exchanges and a decrease in inactive supply, the market is primed for “potential growth,” according to Bitfinex analysts. They add that this mirrors the conditions observed before the significant market surge in December 2020.

On a broader scale, data from CryptoQuant corroborates Bitfinex’s observations, indicating a continuous decline in Bitcoin exchange reserves since July 2021. This decline, which has seen reserves plummet from 2.8 million to approximately 1.94 million, suggests a sustained trend of Bitcoin leaving exchange wallets.

Bitcoin Latest Price Action

Meanwhile, Bitcoin’s price performance has taken a downturn, notably beginning late last week Friday and continuing throughout the weekend. The top crypto witnessed a significant decline, plummeting from above $70,000 to as low as $62,000.

Notably, this downward trend has persisted over the past 24 hours, with the asset experiencing a decrease of 4.6% during this period and over 10% in the past week, leading to its current trading price of $62,034 at the time of writing.

Bitcoin (BTC) price chart on TradingView

Amidst these price movements, signs of panic have emerged within the Bitcoin market. Recent data from Whale Alert sheds light on a significant transfer involving 7,690 BTC, valued at $483 million, to Coinbase, the largest cryptocurrency exchange in the United States.

While details about the origin of the address, “1Eob1,” remain undisclosed, it’s important to recognize that such transfers to exchanges often signal potential intentions to liquidate holdings. This occurrence typically suggests a readiness to sell off assets within the crypto sphere.

Furthermore, should the entity responsible for this transfer decide to sell off the entirety of the deposited BTC, it could potentially exert a notable influence on the broader Bitcoin market.

Featured image from Unsplash, Chart from TradingView

Analysts Bullish On Bitcoin Despite Peter Schiff’s $20,000 Doom Scenario

Over the weekend, the Bitcoin (BTC) crash had the crypto community on its toes. With the price dropping to $60,000, many investors worried that the flagship cryptocurrency was in trouble ahead of the “Halving” event.

Amid the correction, Bitcoin critic Peter Schiff claimed that his previous predictions regarding spot Bitcoin ETFs (exchange-traded funds) were correct and presented the possibility of a doom drop for BTC.

Peter Schiff’s Doomsday Prediction For Bitcoin

Back in March, known Bitcoin opposer Peter Schiff asserted what he thought was the problem with Bitcoin ETFs. According to the economist, the problem with owning these investment products was that liquidity was limited to US market hours, which would mean that investors could not sell if the market crashed overnight.

On Sunday afternoon, Schiff claimed that, as he previously warned, Bitcoin ETF owners would be helpless if the flagship cryptocurrency started selling off that night. BTC traded around $63,460 at the time of his post and recovered in the following hour to trade above the $65,000 support level.

Earlier that day, Schiff had warned of a critical support zone for BTC. To the economist, breaking below $60,000 could “create a formidable triple top.” This trend reversal could lead to an “immediate downside projection” of $20,000.

Following his dooming scenario, Schiff stated that, at that price, MicroStrategy would “have a $2.7 billion unrealized loss on 214K Bitcoin acquired at an average price of $34K.” Additionally, he believes that BTC’s price could increase “before it crashes.”

Analysts Unfazed By BTC’s Correction

Several analysts concurred that the correction was a “minor drop” in the macro picture. According to MacroCRG, Bitcoin’s chart “looks incredible.” The analyst stated: “They threw a full-on war at her and all it managed to do was wick the range low.”

Similarly, trader and analyst Rekt Capital considers that BTC “successfully protected the Range Low of its Re-Accumulation Range as the week of the Bitcoin Halving begins.”

Per the analyst’s chart, Bitcoin is at the “Last Pre-Halving Retrace” during the “Pre-Halving Rally.” If history is to repeat itself, after April 19, BTC will enter the “Re-Accumulation” phase before experiencing the “Post-Halving Parabolic Upside.”

BTC, BTCUSDT, Bitcoin, Crypto

Moreover, Crypto Jelle urged investors to “not get shaken out” as BTC is “consolidating above the previous cycle highs.” The analyst and investor reaffirmed his prediction of $82,000 after the upcoming “Halving” event.

However, Jelle also set a higher target for this bull cycle. The bullish megaphone pattern on BTC’s chart “still has a pattern of $180,000” despite the recent correction, as stated in the post. The analyst claims he wouldn’t be surprised “if the meme pattern plays out once again.”

The correction caused BTC to register bleeding numbers for several periods. The biggest cryptocurrency exhibits an 8.4% and a 3.1% dip in the weekly and monthly timeframes. Similarly, BTC’s market activity has decreased by 32.1% in the past day, with a trading daily volume of $42.56 billion.

Nonetheless, Bitcoin has recovered 3.5% from its price 24 hours ago, currently trading at $66,275. Since the lowest point of this correction, BTC has surged 10.3%.

BTC, BTCUSDT, Bitcoin

What’s A Simple Strategy For Buying & Selling Bitcoin? This Analyst Answers

An analyst has revealed a simple strategy for buying and selling Bitcoin using the historical pattern followed by two BTC on-chain indicators.

These Bitcoin On-Chain Indicators Have Followed A Specific Pattern Historically

In a post on X, CryptoQuant author Axel Adler Jr. discussed a simple strategy for timing buying and selling moves for Bitcoin. The strategy is based on the trend witnessed historically in two BTC on-chain metrics: the Net Unrealized Loss (NUL) and Net Unrealized Profit (NUP).

As their names suggest, these indicators keep track of the total amount of unrealized loss and unrealized profit that the investors are currently carrying.

These metrics work by going through the transaction history of each coin in circulation to see what price it was last transacted at. Assuming that the last transfer of each coin was the last time it changed hands, the price at its instant would act as its current cost basis.

If the previous price for any coin was less than the current spot price of the cryptocurrency, then that coin is currently carrying a profit. The NUP subtracts the two to calculate the exact unrealized gain for the coin.

Similarly, the NUL does the same for coins that have their cost basis above the latest value of the asset. These indicators then sum up this value for the entire supply and divide the sum by the current market cap.

Now, first, here is a chart shared by the analyst for the NUL that reveals a pattern that the metric has been following throughout the history of Bitcoin:

Bitcoin NUL

The Bitcoin NUL appears to have historically broken above the 0.5 level when the asset’s price has traded around bear market lows. According to Axel, the indicator in this territory would be the moment to buy more.

Recently, the metric has been floating around the zero mark, meaning that there has been any unrealized loss being held by the investors. This makes sense, as the cryptocurrency has set new all-time highs (ATHs). Naturally, 100% of the supply goes into profit when an ATH is set.

Similar to the pattern in the NUL, the NUP has been above the 0.7 level during major tops in the past, suggesting that it may be a good opportunity to sell when the indicator is in this zone.

Bitcoin NUP

As is visible in the chart, the NUP has been marching up with the recent rally in Bitcoin. Still, so far, the indicator hasn’t broken above the seemingly important 0.7 level, implying that the market may not yet be in an overheated place where selling would be ideal, at least according to this strategy.

The graphs of the two indicators, though, show that neither of them flagged the exact tops or bottoms in the asset. It’s especially prominent in the data of the NUP, where the metric signaled “sell” during tops that were merely halfway through the bull run.

That said, buying during the points flagged by the NUL and then selling at the overheated NUP values would have historically been profitable. In that sense, this would indeed be a “simple” strategy for the asset.

It remains to be seen, though, whether these patterns will continue to hold in the current Bitcoin cycle as well.

BTC Price

At the time of writing, Bitcoin is trading at around $69,400, down 2% over the past 24 hours.

Bitcoin Price Chart

$9.5 Billion In Bitcoin Options Poised To Expire This Friday: Market Turbulence Ahead?

This Friday, the spotlight is turned to Deribit, the leading crypto derivatives exchange, as it gears up for a notable event in its trading history. Particularly, the exchange is poised to witness the expiration of over $9.5 billion in Bitcoin options open interest.

For context, Open interest refers to the total number of outstanding derivative contracts, such as futures or options, that have not been settled or closed. It represents the number of contracts market participants hold at the end of each trading day. 

This surge in open interest recorded by Deribit reflects increased market participation and signals heightened liquidity, marking a notable milestone in the crypto derivatives landscape.

Record-Breaking Open Interest

Notably, this event is significant in two ways: It underscores the growing interest in Bitcoin as an asset class and highlights the increasing “sophistication” of the cryptocurrency market. This is because Open interest can also serve as a critical indicator of market health and trader sentiment. 

As such, the record levels of open interest set to expire on Deribit suggest a “vibrant” trading environment, with more investors engaging in complex financial instruments like options.

According to Deribit data, the exchange is set to host one of its largest option expiries ever, with $9.5 billion worth of Bitcoin options poised for expiry at the end of the month. This figure represents a substantial portion, approximately 40%, of the exchange’s total options open interest, which stands at $26.3 billion. 

Bitcoin Open Interest By Expiration.

The magnitude of this expiry event eclipses previous months, with January and February end-of-month expiries totaling $3.74 billion and $3.72 billion, respectively. This trend indicates a large increase in market activity and investor engagement on the platform.

Implications Of The Bitcoin Expiry

The upcoming expiry has notable implications for the market, especially considering the current pricing dynamics of Bitcoin.

With Bitcoin’s spot price hovering below $70,000, an estimated $3.9 billion of the open interest is expected to expire “in the money,” according to Deribit analysts, presenting profitable opportunities for holders of these options contracts. 

The “max pain” price, which represents the strike price at which the highest number of options would expire worthless, thereby causing the maximum financial loss to option holders, is identified at $50,000.

Bitcoin Open Interest by Strike Price.

According to the analysts, this scenario suggests that a significant number of traders are positioned to benefit from the current market conditions, potentially leading to “increased buying activity” as these options are exercised.

Additionally, Deribit analysts speculate that the high level of “in-the-money expiries” could exert upward pressure on Bitcoin’s price or amplify market volatility. They added that as traders “hedge their positions” or “speculate on future price movements,” the market may witness a flurry of activity, impacting Bitcoin’s price trajectory in the short term.

This comes at a time when Bitcoin has experienced a slight retracement from its recent all-time high above $73,000, with the price adjusting to approximately $68,946, at the time of writing

Bitcoin (BTC) price chart on TradingView

Featured image from Unsplash, Chart from TradingView

Bitcoin Might Fall Below $20,000 Before Bull Rally Resumes, Analyst Says

The last two weeks have been incredible for the price of bitcoin. The digital asset has been able to successfully make its way out of a depressing bear trend and reached two-month highs in the process. However, with the recent pullback, there may be a bit more pain for bitcoin investors before the upward rally continues.

Analyst Justin Bennett Says Bitcoin Below $20,000 Is Possible

In a new issue of his crypto trading newsletter, analyst Justin Bennett reveals some bearish tendencies of the market. He first points to the fact that the market has enjoyed a good amount of gains, adding as much as 28% to its value in just the last 18 days. But as is expected after such a rally, a market correction has pulled back the price of the digital asset.

While there have been speculations that this pullback would only be temporary, Bennett explains that it could go a lot further. Now, the analyst does not take away from the bull trend that bitcoin is currently on but rather presents a scenario where the price of the cryptocurrency could back to below $20,000 before the rally resumes.

Bitcoin below $20,000

BTC has already fallen back into the $20,000 region as of the time of this writing, giving credence to Bennett’s analysis. However, with key support for the digital asset now resting at $20,000, bears could pull the price as close to this support as possible before the bears take over once more.

“I like Bitcoin higher toward $25,000 and potentially $29,000, but not without a pullback into the $20,000 region first,” Bennett said in his newsletter.

Factors That Drive This Pullback

In the same newsletter, Bennett points to the PPI data release that underwhelmed the market. In the end, the much-anticipated release was lower than expected, triggering fatigue in the market. Bitcoin had fallen below $21,000 as a result of this.

Also pointing to the US Dollar Index (DXY), the analyst explained the movement of this index on the back of the PPI data release would’ve been bullish for assets such as BTC. “But I think markets got ahead of themselves, so a lot of that bullishness was already priced in,” Bennett added.

Bitcoin price chart from TradingView.com

Since this pullback has pushed the price of BTC dangerously close to the 5-day moving average, it should come as no surprise if the cryptocurrency were to lose another couple of hundred dollars off its value in the coming days.

However, the bullish trend is expected to continue shortly as trading volume remains high, and investor sentiment reaching 9-month highs, sitting very close to greed on the Crypto Fear & Greed Index.

BTC is trading at $20,779 at the time of this writing. Its price is down 2.18% in the last 24 hours, but up 14.54% in a 7-day period.

Bitcoin Breaks $37,000, Why Downtrend To $29,000 Is Likely

Bitcoin has now broken down past $38,000 for the first time in over four months. This is a crucial point for the digital asset given that it has successfully maintained its position above this level throughout all of the crashes and dips of the previous month. While most would like to think that this is only a temporary setback that will soon be resolved, analyst Nicholas Merten has warned investors to brace for even more volatility.

Prepare For Further Downside

In a recent video on his YouTube channel, Merten shared with his over 87K subscribers some gloomy analysis surrounding bitcoin. The analyst starts out by acknowledging what most have experienced in the market, believing that the recent rebound was a telltale sign of more upside to come. However, this could not have been more wrong as the digital asset has suffered even more dips following that.

Related Reading | Bitcoin Implied Volatility Plummets To Pre-Bull Market Levels: What This Means

Merten pointed out the fact that the gains realized from when bitcoin jumped from $41k to $44k have quickly faded and that there is not a lot of significant support ranges as the digital asset makes its way down with the downtrend.

He predicts some major volatility that will drag the price down to levels not seen in about a year. Comparing the market to that of May 2020, which would see the price fall to the $29,000 range. “It’s just likely at this point that we repeat what we saw back in May to some degree,” he said. “Having a correction down to this range [$29,000 to $30,000], getting people towards what I would define as max pain It basically defines the point of peak fear when everyone, even the bulls are convinced that we’re in a bear market.”

The analysts expect more downside to the tune of 20% to 30%, which would put the price of bitcoin at the range he predicts.

BTC crumbles below $37k for first time in four months | Source: BTCUSD on TradingView.com
Still Bullish On Bitcoin

The fact that Merten relayed such a gloomy diagnosis for bitcoin in the short term does not mean that the analyst is particularly bearish in the long term. He explained that despite the market showing bearish trends, he remains a bitcoin bull.

“We’ve been bearish in the short term over the past couple of weeks and we believe that there is still more downside to go, [but] I’m still a long-term bull.”

Related Reading | I Only Hold 1 Bitcoin, Real Vision CEO Raoul Pal Reveals

Additionally, Merten reiterates the fact that the market is still in a bull trend. Usually when prices start declining as fast as they are now, panic spreads across the space as most believe the bull market is over. For Mertern, this is not the case. He explains that just as a downward correction is likely, bitcoin could very well switch up and head towards the $150K to $200K range.

“I believe that we’re still in a bull market, not a bear market. It’s very likely that we could see this correction, but at the same time, it could be the catalyst to finally set ourselves up on the next uptrend and charter towards the $150k range, $200k range for Bitcoin.”

At the time of writing, bitcoin’s price is down 9.61% to be trading at $37,945.

Featured image from Medium, chart from TradingView.com

Why Closing Out The Year Below $50,000 Could Be Bad For Bitcoin

A lot of predictions had put the price of bitcoin at $100,000 by the end of the year and although there are still some weeks left to go, it does not look like these predictions will come to pass. Bitcoin has however maintained a bullish trend despite price crashes and massive liquidations rocking the digital asset in recent times.

Since analysts, and the crypto market in general, has been so focused on the bullish future of the asset, there has not been much attention paid to a low for the year. As the end of 2021 rolls around, it is important to not only look at the bullish end-of-year predictions but also how the cryptocurrency might be affected depending on the price bitcoin closes at.

Related Reading | Bitcoin Open Interest Takes Second Largest Dump Of 2021

Crypto analyst Justin Bennett addresses this in his latest issue of the weekly newsletter. Bennett maps out the outlook for the digital asset, as well as the implications of bitcoin closing out the year below $50,000.

Options Contracts Becoming Worthless

Some of the bitcoin options contracts are set to expire at the end of the year and the profitability of these options contracts depend greatly on what price BTC is when they expire. Since the crash, bitcoin has struggled to maintain its value above $50,000 and this has not been good for the options contracts. Bennett notes that a close below $50,000 would see all of these contracts expire worthless, playing into what he called the “max pain theory”.

The crypto analyst is not particularly confident in the digital asset’s ability to finish the year above $50,000. He expressed that he expects the consolidation in larger cap cryptocurrencies to continue through the last month of the year.

Bennett however notes that there is a wide range for bitcoin due to the December 4th candle. This means that anywhere between $42,000 and $53,000 is possible going forward, providing a massive margin for the digital asset.

BTC price continues downtrend | Source: BTCUSD on TradingView.com
Bitcoin Volume Is Concerning

Bennett also points to the lack of volume in the cryptocurrency. One thing is to start a rally or a breakout, but the other thing is to get enough volume to match that breakout. Otherwise, a rally would not be successful.

Related Reading | Number Of Bitcoin Lightning Network Nodes Jumps 23% In Three Months

“If we’re to see Bitcoin and the rest of the crypto market breakout later this month or even January, we need to see volume to match the price increase,” said Bennett. “Without volume, any rally or even breakout is more likely to fail.”

As bitcoin continues to consolidate following a $53,000 test, the market is quietly waiting for more institutional money to pump into the market. Currently, Bennett has put the bitcoin key support at $49,000. “Below that is the April trend line near $46,000,” Bennett notes.

Featured image from Bitcoin News, chart from TradingView.com