Don’t Panic: The Bitcoin Bull Market Is Far From Over, Quant Says

Amidst the recent Bitcoin pullback from its previous all-time high above $73,000, Ki Young Ju, the founder and Chief Executive Officer (CEO) of Crypto Quant, reassures the broader crypto community that the BTC bull market is far from over

Bitcoin Bulls Are Not Done

In a recent X (formerly Twitter) post, Ju expressed strong bullish sentiment regarding Bitcoin, highlighting factors that suggest that Bitcoin’s upward trajectory is likely to continue. The Crypto Quant CEO shared a crucial indicator depicted in a price chart, showcasing the percentage of Realized Cap across four age bands for BTC. 

According to data from the price chart, the observed trends from the Realized Cap of four age bands from 6 months to three years indicate a positive outlook for BTC in 2024. 

Additionally, the CEO has stated that the primary catalyst behind Bitcoin’s rise to new all-time highs is the success of the Spot Bitcoin ETF, rather than the upcoming Bitcoin halving event in April. 

After the introduction of Spot Bitcoin ETFs, BitcoBTCin embarked on an exponential rally, reaching heights not witnessed since its previous bull run in 2021. The cryptocurrency rose to record highs, surpassing $73,000 previously, but experienced a major pullback of about 8.33% over the past week. At the time of writing, Bitcoin’s price is below $70,000, trading at $67,225, according to CoinMarketCap.

Ju has revealed possibilities for even more declines, predicting a potential price drop of 50% for the cryptocurrency if a maximum drawdown of 30% occurs. The CEO has stated that for this event to happen, new whales, particularly ETF buyers, will have to enter the Bitcoin market at $56,000 on average. 

While this outlook may seem bleak, the Crypto Quant founder has also expressed strong belief in the continuation of the BTC bull market, contingent upon the sustained momentum of ETF inflows.  

Retail Investors Still Making Their Way Into The Market

Reinforcing his belief that “Bitcoin is still in the middle of the bull cycle,” Ju asserts that the cryptocurrency’s cyclic top has not yet been breached. The CEO suggested that more price upswings were still set for Bitcoin, as retail investors have not fully entered the market yet.  

According to the Crypto Quant founder, only 50% of retail investors have entered the market, indicating the halfway point towards “Bitcoin euphoria”. This suggests that if more retail investors flood the market, BTC could potentially rise to new peaks, driven by increased demand and capital inflows. 

Echoing Ju’s convictions about Bitcoin’s long-term price increase, Bitcoin analyst Willy Woo encourages investors to embrace the dip during the present consolidation phase. The analyst confidently asserts that “this is not the top,” but rather a simple period of consolidation reminiscent of previous all-time highs. 

Bitcoin price chart from Tradingview.com

Hold On For Four Months: Analyst Predicts When Bitcoin Price Will Reach New ATH

Bitcoin has been experiencing a downward trend recently, dropping from its 2023 all-time high of about $49,000 to below $41,000 at the time of writing. Despite this significant price correction, popular crypto analyst Kevin Svenson has predicted a new all-time high for BTC in the months after the 2024 Bitcoin halving. 

Bitcoin Anticipated To Hit New All-Time High

Svenson released a YouTube video last week, predicting that BTC’S new all-time high is set for June 2024. Despite the hype surrounding the approval and launch of Spot Bitcoin ETFs, the crypto analyst revealed that Bitcoin has been witnessing significant declines and is currently approaching the critical price level of $40,200. 

The crypto analyst compared Bitcoin’s price movements with the recent stock market patterns. Last Friday, Wall Street stocks, particularly the S&P 500 index, achieved an all-time high of 4,839.81, surpassing its previous record in January 2022. 

Svenson pointed out a significant correlation between Bitcoin and the S&P 500 index in the months leading up to and following the Bitcoin halving. According to the crypto analyst, the last three Bitcoin halvings illustrated a key price pattern for BTC as the stock market hit its all-time high.

The analyst explained that after the first Bitcoin halving in November 2012, the S&P 500 index hit its all-time high, and BTC followed after, recording an all-time high two months later. 

Additionally, in the second halving in July 2016, the S&P 500 index achieved a record high, after which Bitcoin hit an all-time high about seven-and-a-half months later. In the third halving in May 2020, the S&P 500 index broke its all-time high in August, with BTC following suit about four months later.

Svenson has suggested that these results reveal a unique correlation between the price of BTC and the S&P 500 index during the halving phases. Using the average time difference observed in the three halving events, he projected the timeline for Bitcoin’s all-time high in the upcoming halving in April 2024. 

According to the crypto analyst, BTC is expected to achieve a new record high in approximately four-and-a-half months after the S&P 500 index hits its own all-time high. 

BTC Overcomes Critical Price Level

In his video, Svenson disclosed that BTC has successfully bounced off the critical price level of $40,200. He revealed that the cryptocurrency had achieved this feat around the same time the S&P 500 index had recorded its new all-time high. 

“Bitcoin is already bouncing, the weekly is now back in the green, and the daily chart, the daily candle is now also back in the green,” Svenson said.

It’s important to note that at the time of writing, the price of Bitcoin was trading at $40,832, reflecting a 2.06% decline in just 24 hours, according to CoinMarketCap. The crypto analyst warned that if BTC had failed to overcome the critical support level, it could have triggered major bearish signals. 

Svenson also noted that the recent gains in the stock market presented a positive development for both Bitcoin and altcoins in the crypto market. He stated that the stock market’s new all-time high would enable Bitcoin to effectively secure its critical position while also potentially influencing speculator sentiment positively within the crypto space.

Bitcoin price chart from Tradingview.com (Crypto analyst)

Anatomy Of A Bull Market: The Bitcoin Roadmap To $70,000

Through bull and bear rallies, crypto analysts have always given their forecast for where the price of a crypto like bitcoin might end up. Mostly, this is the norm, but one analyst has taken a deeper dive into the coin to give an in-depth analysis of Bitcoin’s upward rally. The analysis touches on multiple indicators, as well as the widespread acceptance that BTC has been gaining recently.

Bitcoin Price To $70,000

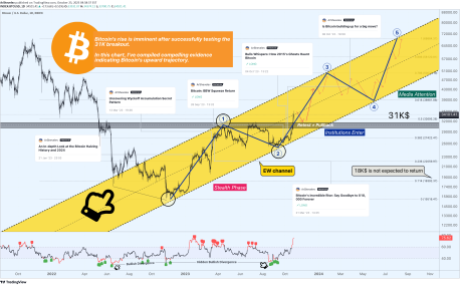
The analysis shared on TradingView shows a different side of the market that has previously been untapped. The analyst who goes by ArShevelev identifies the period between March and August as the ‘Stealth Phase’, which is likely where most of the accumulation occurred.

Next, the crypto entered into the ‘EW Channel’ which looks like it served as a bounce-off point for the rally. From here, it has been an easy coasting upward reaching above the $34,000 mark. But this is where things start to get interesting.

At this level, the analyst predicts a pullback in the price. This pullback from $34,000 sends the price falling back down to as low as $31,000 before the rally starts up again. The end of this retest leads to the top of the third wave where the price reaches as high as $50,000, before another pullback again.

This sent the price back down to the $35,000 mark once more to mark the fourth wave before bouncing up again into the fifth wave. Now, at this point, the analyst sees ‘Media Attention’ entering the game (presumably mainstream and traditional finance media), and the lift-off from this level reaches the $70,000 mark.

Bitcoin $70,000

Factors To Drive The Momentum

The crypto analyst presents seven major factors that are behind the predicted Bitcoin momentum leading into a bull market. For starters, the first is the same as everyone expects – the almighty Bitcoin Halving. This event is undoubtedly the most bullish in Bitcoin’s history and a repeat of it is expected to kickstart the bull market.

Next on the list is the Impulse Structure and Rising Channel where the analyst believes that the BTC price is “painting a compelling picture on the daily timeframe.” This leads to the Third Wave Speculation as already explained above. The analyst believes the market is in the third wave, with the fourth being a pullback and the fifth leading above $70,000.

Fourth on the list is the Wyckoff Accumulation Pattern in which Bitcoin is already showing strength. Then there is the Bollinger Bands Width Squeeze which has dropped to 2014 levels. “This rarity accentuates Bitcoin’s growth potential, serving as a strong indicator for investors,” ArShevelev says.

The sixth factor is the Historical Comparisons where the current price action is compared to previous market trends. The 2023 bear market looks more like the 2015 bear market as the analyst points out, and this could see an almost 100% jump in price as it did in 2015. This would put the Bitcoin price above $50,000.

Last but not least is Institutional Interest which has been on the rise lately. Mostly, this has been driven by the enthusiasm around BlackRock, the world’s largest asset manager, filing for a Spot Bitcoin ETF and possibly bringing Bitcoin into its over $8 trillion portfolio.

ArShevelev explains that a Spot Bitcoin ETF “promises to be a game-changer” due to its ability to bridge TradFi to crypto and allow more money to flow into Bitcoin. “The ETF’s advent not only signifies regulatory acknowledgment but also invites a wave of retail participation,” the crypto analyst said. “The anticipation is that as we approach the holiday season, institutional investors will further solidify this upward trajectory.”

Bitcoin price chart from Tradingview.com

Crypto Analyst Says Bitcoin Could Reach $180,000 Next Cycle If This Happens

Since the Bitcoin bull market began, one discussion that has never left the crypto community is when the next bull rally will commence and if it would follow the previously established trend around the halving events. To this end, a crypto analyst, Lark Davis, has taken to X (formerly Twitter) to share his forecast around the next bull market.

What Could Happen If History Repeats Itself

All of the previous Bitcoin bull markets have always begun after the BTC halving event which cuts block rewards in half. However, this time around, there have been dissenting views regarding the digital asset’s tendency to follow this established trend once more due to deviations in various Bitcoin metrics. But Davis has shared a possible scenario for BTC if the bull market begins after the rally once more.

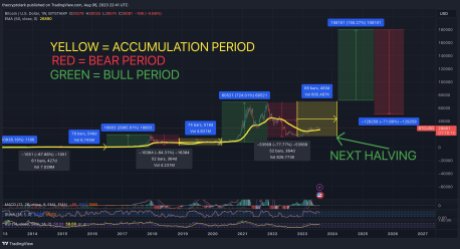
In the chart shared by the analyst on X, he points out a long period of accumulation. This is when investors fill up their bags with BTC as it is possibly the lowest that the price of the digital asset would get during the bear market.

Bitcoin bull market

Next comes the Bitcoin halving event, at which time, the price of Bitcoin and other cryptocurrencies in the market start to pick up steam. This is when the bull market starts to take shape, leading to the next part of the trend which is when prices explode.

In Davis’ post, he shows that the price of the digital asset could rise as high as $180,000 during this time. If the cryptocurrency does touch this price mark, it would mean that the price of BTC would almost triple from its current all-time high of $69,000.

How This Can Happen For Bitcoin

As clarified by the analyst in his X post, for any of this to happen, it would mean that BTC would have to completely follow the trends of the previous bull cycles. This would mean the bottom could likely be reached in early 2024, but it would also be the same year for the start of the bull run.

Even if Bitcoin does follow this trend though, it would not always be ‘up-only’ for the market. It would mean that the bull market would top out sometime in 2025 and then there would likely be a market crash that sends BTC spiraling in the following year. As Davis points out, the digital asset could tumble 70% to reach $50,000 again.

However, even with the obvious bear market that would follow this trend, it is still an incredibly bullish scenario for Bitcoin and the crypto market at large. The bull market would last around one year, following historical data, providing ample opportunity for investors to make the most of the market.

The next Bitcoin halving is expected to take place in April 2024, and if history is anything to go by, this is around when the bull market should be expected to start back up.

Bitcoin (BTC) price chart from Tradingview.com

Glassnode: Bitcoin Is Currently In “Bear To Bull” Transition Period

Data from Glassnode suggests Bitcoin is currently in the historical bear market to bull market transition period.

Bitcoin Correlation Between Price And Supply In Profit Has Recently Been Below 0.75

As per a recent report by Glassnode, the BTC correlation between the price and the supply in profit generally observes multiple drops below 0.75 during transitional periods.

The “supply in profit” is an indicator that measures the percentage of the total Bitcoin supply that’s holding some profit right now.

The metric works by looking at the on-chain history of each coin to see what price it was last moved at. If this previous selling price is less than the current BTC value for any coin, then that particular coin has some unrealized profits at the moment.

The correlation between the crypto’s price and its supply in profit tells us whether the two metrics have been moving in the same direction or not.

Now, here is a chart that shows the trend in this Bitcoin correlation over the history of the crypto:

The value of the metric has been low multiple times in recent days | Source: Glassnode’s Market Pulse

Whenever the correlation is positive, it means the price and the supply in profit are both moving in the same direction. On the other hand, negative values imply they are going opposite ways.

As you can see in the above graph, Bitcoin has historically had values above 0.9 for a majority of the time during each of the previous price cycles.

However, during periods of transition between bull markets and bear markets (as well as vice versa), the indicator usually observes multiple drops below 0.75.

According to the report, these deviations occur in the case of bear to bull transitions because at late bear market stages, sellers turn exhausted while the remaining investors become reluctant to move their funds out of frustration, thus decreasing the correlation between price and supply in profit.

And during the opposite transitions, the supply in profit generally surges to almost 100% (as the price rises to a new ATH), thus diminishing any correlation with the price.

Recently, the indicator has observed multiple plunges below the 0.75 threshold, suggesting that Bitcoin is currently in the historical bear to bull transition zone.

BTC Price

At the time of writing, Bitcoin’s price floats around $19.1k, down 4% in the last seven days. Over the past month, the crypto has lost 10% in value.

The below chart shows the trend in the BTC price over the last five days.

Looks like the value of the crypto hasn’t shown much movement in the past few days | Source: BTCUSD on TradingView
Featured image from Kanchanara on Unsplash.com, charts from TradingView.com, Glassnode.com

By The Numbers: The Worst Bitcoin Bear Markets Ever

Bitcoin is now officially in another bear market after the crash that rocked the market last week. After falling more than 70% from its all-time high, investors across the space had started to retreat from the digital asset due to this new price trend. However, trends like these are not new for bitcoin. Although the present market may seem worse than previous ones due to it still ongoing, there have been some brutal bear markets in the past.

A Blast From The Past

It can often be helpful to take a look at the previous market cycles for bitcoin to see that this is nothing out of the ordinary. Yes, the bull and bear trends of this market have deviated from what has been recorded in history but it still remains very similar to what has been recorded in the past.

For bitcoin, the alternation between bear and bull markets has always been part of the experience. It has been through several of these boom-bust cycles in its 13 years in existence and it is not expected to change anytime soon.

Related Reading | Over $250 Million In Liquidations As Bitcoin Recovers Above $20,000

Bitcoin has so far lost about 73% from its most recent cycle peak but it is not the first time that something like this is happening. Looking back to the November 2013 market shows that bitcoin had actually continued to decline until it finally ended its 407-day losing streak with a bottom at 85% of its all-time high value. This had marked the end of that stretched-out bull market.

For those in the market, the 2017 bull-bear cycle is fresher in their minds compared to 2013. However, like in 2013, the drawdown was just as brutal, although lasting a shorter time. What had lasted for approximately a year had ended with poor performance of an 84% bottom. 

BTC bear markets are always brutal | Source: Arcane Research

Since the digital asset continues to maintain this trend closely, it is expected that the drawdown will continue. Going by the previous two examples, one can easily draw a conclusion that a historical movement will see bitcoin bottom out in the mid -80s. Thus, the bottom is most likely not in and the market is likely to see BTC at $11,000 before the expected market bottom in late 2022.

Will Bitcoin Follow?

While looking at previous movements can help point a direction where the price of bitcoin might end up, there are always new information and events that can heavily impact it. For one, the macroeconomic atmosphere has been a big player in the movement of the digital asset in recent terms. As fears around inflation, fed rate hikes, and less liquidity circle the market, bitcoin had been directly impacted by this.

BTC enters bear market | Source: BTCUSD on TradingView.com

This has led to a more intertwined market when it comes to bitcoin and the broader financial markets. As the cryptocurrency space grows larger, it is experiencing greater implications from the Fed decisions, stock market performance, U.S. elections, and crypto regulations that have been ramping up.

Related Reading | Cardano Vasil Hard Fork Launch Date Set, Time To Buy The News?

Nevertheless, the long-term play for bitcoin remains the best bet. As emotions run high, bitcoin veterans take to accumulating and hibernating while waiting for winter to pass. If history is anything to point to, by the next bull market, the price of bitcoin could reach as high as $200,000.

Featured image from Forbes, charts from Arcane Research and TradingView.com

Follow Best Owie on Twitter for market insights, updates, and the occasional funny tweet…