Is Bitcoin Getting Ready For An Explosive Breakout? These Analysts Believe So

The fluctuations in Bitcoin’s price have marked the tempo of the crypto market and the community’s sentiment. While some feel pessimistic about the rally slowdown, some analysts believe the flagship cryptocurrency is just getting ready to reach higher notes.

Next Stop: Bitcoin’s “Parabolic Upside”

Crypto analyst and trader Rekt Capital considers Bitcoin (BTC) is currently awaiting a period of consolidation. In an X post, the trader highlighted that, during the previous “Halvings,” BTC saw “Re-Accumulation Ranges.”

The analyst shared his chart for Bitcoin phases during the “Halving,” which he has previously used to explain BTC was at the “Last Pre-Halving Retrace” before April 19.

At the time, the analyst pointed out that the re-accumulation phase was next. Bitcoin went through one during the previous “Halving,” as seen in the chart.

The re-accumulation consisted of two consolidation periods followed by the “Post-Halving Parabolic Upside,” which saw BTC reach last cycle’s all-time high (ATH) of $69,000.

Bitcoin, BTC

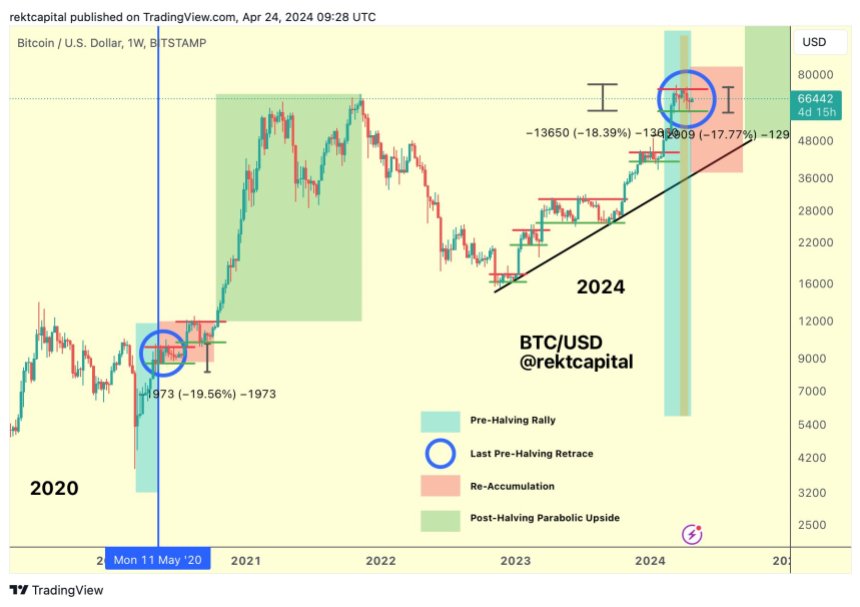
Rekt Capital highlighted that, during this cycle, the flagship cryptocurrency has already experienced five re-accumulation ranges. Similarly to the last cycle, the latest re-accumulation phase seems to have started during the “Pre-Halving Rally” phase. Per the analyst, this will be followed by the “Parabolic Upside” if history repeats itself.

Analyst Mikybull seems to share a similar view to Rekt Capital’s, as he highlights that Bitcoin’s “parabolic rally is loading.” The re-accumulation breakout is set to be “explosive,” and “not many are prepared for this,” he added.

The analyst explained that “the RSI on a macro scale is at the same level as it was in 2017, which was followed by a huge rally to cycle top.” Based on this, he believes the current consolidation comes from institutions preparing “for a huge rally to cycle top.”

Analyst Sets Crucial Level For Bitcoin’s Breakout

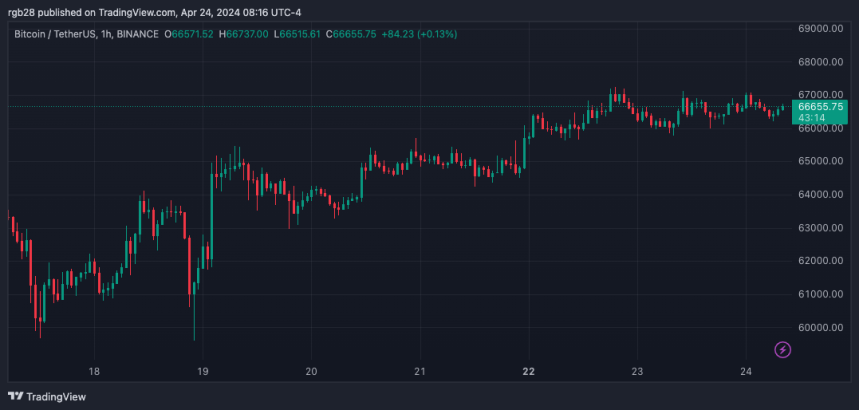
A day before Bitcoin’s “Halving,” the cryptocurrency faced a correction that shredded 7% of its price in a few hours. BTC went from hovering between the $64,000-$63,000 price range to trading below the $60,000 support zone.

Since then, the largest cryptocurrency by market capitalization appears to have steadily recovered from the drop. Over the weekend, Bitcoin regained the $65,000 support level before testing the $66,000 one, which it reclaimed on Monday.

Over the last few days, BTC has hovered between $66,000 and $67,000. However, it has not been able to successfully test the resistance level set at the $67,000 price range.

According to the crypto analyst Bluntz, Bitcoin’s most recent performance suggests that the price will continue to move sideways between the $66,000 and the $67,000 range.

However, he also considers that BTC is “gagging for a breakout soon,” as the chart displays a bullish pennant pattern forming. Per the analyst, “once we clear 67k,” the whole market will fly above the latest ATH.

As of this writing, Bitcoin is trading at $66,665, a 7.5% increase from a week ago and a 66.22% in the last three months.

BTC, BTCUSDT, Bitcoin

Bitcoin CDD Shows Bullish Breakout, Rally Returning In Full Flow?

On-chain data shows a bullish breakout brewing in the Binary CDD indicator for Bitcoin, a sign that a strong price rise could be ahead for the asset.

Bitcoin Binary CDD Is Breaking Out Of Accumulation Zone

As pointed out by an analyst in a CryptoQuant Quicktake post, the Binary Coin Days Destroyed (CDD) appears to be forming a pattern for the cryptocurrency that has usually been the starting point of a bullish trend.

A “coin day” refers to a quantity that 1 BTC accumulates after staying dormant on the blockchain for “1” day. When a token that had been dormant for some number of days finally moves on the network, its coin days counter naturally resets back to zero.

The coin days that this token was carrying are thus said to be “destroyed.” The CDD keeps track of the total number of such coin days being reset through transactions across the network.

The Binary CDD, the actual metric of interest here, compares the current CDD against its historical average to tell us whether the CDD is higher or lower than the norm right now. As its name suggests, it can only assume one of two values: 0 or 1.

Now, here is a chart that shows the trend in the Bitcoin Binary CDD over the last few years:

Bitcoin Binary CDD

From the graph, it’s visible that the Bitcoin Binary CDD didn’t register a value of 1 too frequently between the end of the 2021 bull run and the final parts of 2023. Since around November of last year, though, the density of instances where Binary CDD observed 1 has grown stronger.

When the Binary CDD is 1, it means that the CDD is greater than its historical average currently. This implies that old coins are observing more movement than usual right now.

The “long-term holders” (LTHs) are investors who carry large amounts of coin days at any given point, as they tend to keep their BTC dormant for long periods (the cutoff for a holder to be included in the cohort is 155 days).

As such, spikes in the CDD tend to signal that these HODLers are on the move. “In an upward cycle, the movement of long-term holders increases as the price rises (orange boxes), and in a downward cycle, it decreases (blue boxes),” notes the quant. “This pattern has been repeating since the previous cycles.”

Since the LTHs have started to move now, it’s possible the market is now in the same phase as during the previous bullish periods, highlighted with the orange boxes by the analyst.

A similar pattern is also visible in the 182-day moving average (MA) of the Binary CDD, as the chart below shows.

Bitcoin Pattern

As is apparent from the graph, the 182-day MA of the Bitcoin binary CDD is beginning to break out of the accumulation zone, which is something that has historically led to sustained price surges for the cryptocurrency.

“It’s still worth monitoring, but finally, it has broken out of this range,” says the quant. “If it strongly surpasses this range, there is a high possibility that a full-fledged upward price cycle is beginning.”

BTC Price

After its dip towards the $42,200 mark over the weekend, Bitcoin appears to have kicked off the week with a return back above $43,000.

Bitcoin Price Chart

This Bitcoin Indicator Is On The Verge Of A Bullish Breakout

A Bitcoin on-chain indicator is currently attempting a breakout that could turn out to be a bullish signal for the asset’s value.

Bitcoin Active Entities Is Trying To Escape Network Stagnation Range

In a new post on X, Jamie Coutts, a Bloomberg Intelligence analyst, has discussed the BTC active entities metric, and how it has a strong relationship with the coin’s price.

The “active entities” here are a measure of the unique total amount of Bitcoin addresses that are participating in some kind of transaction activity on the blockchain. Naturally, both senders and receivers are counted by the metric.

When the value of this metric rises, it means that an increasing number of users are engaging with the network. Such a trend is a sign of growing adoption for the asset.

On the other hand, declining values of the indicator imply that interest in the cryptocurrency may be waning, as fewer addresses are becoming active on the blockchain.

The analyst has pointed out that the active entities metric has a high r-squared value with Bitcoin.

Bitcoin Active Addresses Correlation

From the table, it’s visible that the r-squared value for the active entities is 0.55. What this means is that 55% of all fluctuations in the cryptocurrency’s price can be explained by this variable.

There are only a few metrics with a higher r-squared value, making the active entities an indicator with one of the strongest statistical relationships with BTC. “Importantly, this is also a stable relationship over time (ex the wonky pre-2012 data),” Coutts notes.

Bitcoin Active Entities R-Squared

Now, here is a chart that shows how the Bitcoin active entities have changed during the history of the cryptocurrency:

Bitcoin Active Entities

As displayed in the graph, the Bitcoin active addresses have stagnated around each of the cycle lows, but in the periods between them, it has seen a rise, although the pace has been getting slower over time.

Since 2021, the indicator has been inside a rather long phase of stagnation, as the indicator has been unable to escape out of a particular range. It would appear, however, that things might be starting to change for the better.

Bitcoin Active Entities

The CMT explains that it’s looking like a TA-style breakout so far, but it’s not yet fully clear whether the Bitcoin active entities have truly escaped the stagnation range.

If the metric can manage to stay above the range for the next few weeks, it might be a confirmation that the extra entities that have started trading on the network are truly planning to stick around, and hence, that constructive adoption is finally picking up for Bitcoin.

BTC Price

At the time of writing, Bitcoin is trading at around $25,900, down 11% in the last week.

Bitcoin Price Chart