Bitcoin Hash Ribbons Form Capitulation Signal: What It Means

On-chain data shows the Bitcoin Hash Ribbons have recently gone through a crossover. Here’s what it could mean for the cryptocurrency.

Bitcoin Hash Ribbons Suggest Miner Capitulation Is On

As explained by CryptoQuant community manager Maartunn in a Quicktake post, miners are capitulating right now if the Hash Ribbons indicator is to be believed. This on-chain metric is generally used to determine whether miners are in distress.

BTC runs on a proof-of-work (PoW) consensus mechanism where miners play the role of validators and compete against each other using computing power to get a chance to add the next block to the chain.

This computing power, when measured across the network, can provide insight into the health of the miners as a whole. Due to this reason, the Hash Ribbons indicator makes use of this total Bitcoin “Hashrate” to judge the situation of the miners.

Naturally, a rise in the Hashrate suggests the network is attracting miners right now, while a decline could imply low profitability is making some of these validators pull out from BTC.

The Hash Ribbons indicator uses two moving averages (MA) of the Hashrate, 30-day and 60-day, to represent whether these behaviors are particularly intense or not at the moment. When the 30-day ribbon moves under the 60-day one, it suggests that miners are mass capitulating. On the other hand, the opposite cross suggests network is observing growth again.

Now, what relevance do these trends have for Bitcoin? According to Charles Edwards, the creator of the Hash Ribbons, the miners have historically been quite resilient, and they only quit when things get especially bad for the cryptocurrency. As such, the market may be more likely to approach a bottom whenever these chain validators show capitulation.

Below is a chart that shows how the miners’ behaviour has looked recently according to this indicator:

quicktake-image

As Maartunn has highlighted in the graph, the Bitcoin Hash Ribbons have seen a crossover recently. More specifically, the cross has involved the 30-day moving under the 60-day, implying that the miners are capitulating.

Miner profits come down to three factors: BTC spot price, transaction fees, and electricity costs in the area that they are located in. Historically, the fees has been quite low in comparison to the block rewards, so miner financials have been dependent on the price (as the block rewards only have this variable attached to them) and electricity prices.

Recently, the BTC price has been stuck in consolidation while the block rewards have been slashed in half in the latest Halving event. This has led to tightening revenues for these chain validators, so it’s not surprising to see that the miners with the least efficient machines have already started ditching the network in hordes.

In the chart, past instances of miner capitulation are shown with the green lines. It’s visible that while miner capitulation has generally indeed occurred near profitable buying points into the asset, these bottoms haven’t immediately appeared after the crossovers have occurred. As the analyst notes, “It unfolds in the subsequent days and weeks after less efficient miners throw in the towel.”

BTC Price

Bitcoin has continued to move overall flat over the past week as its price is still trading around $62,700.
Bitcoin Price Chart

Bitcoin Short-Term Holders Capitulate: $5.2 Billion Sold At Loss

On-chain data shows the recent Bitcoin drawdown has shaken up the short-term holders, leading them to make large exchange deposits at a loss.

Bitcoin Short-Term Holders Have Transferred Huge Volume In Loss To Exchanges

As analyst James Van Straten pointed out in a post on X, the BTC short-term holders have recently participated in a large amount of loss-taking. The “short-term holders” (STHs) are the Bitcoin investors who bought their coins within the past 155 days.

The STHs make up one of the two main divisions of the BTC market, which is done on the basis of holding time, with the other cohort being known as the long-term holders (LTHs).

Statistically, the longer an investor holds onto their coins, the less likely they become to sell them at any point. As such, the STHs would reflect the weak-minded side of the market, while the LTHs would be the persistent diamond hands.

Given their fickle nature, the STHs usually easily react whenever a notable sector change occurs, like a price rally or crash. Recently, BTC has registered a significant drawdown, so these investors would likely have made some moves.

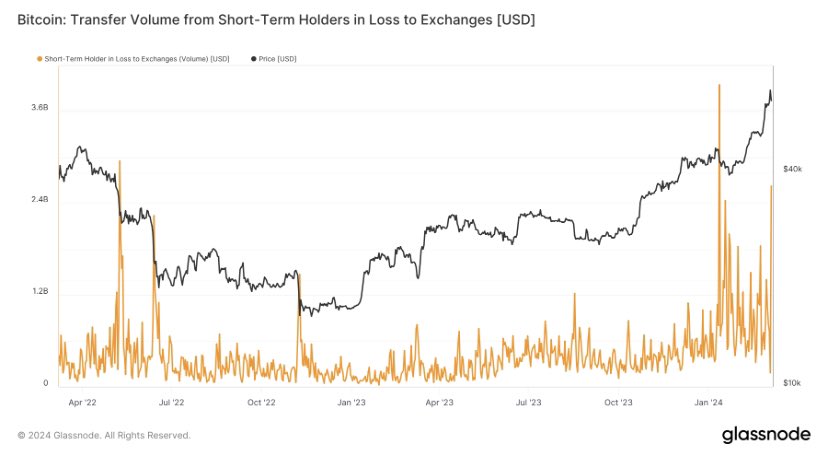
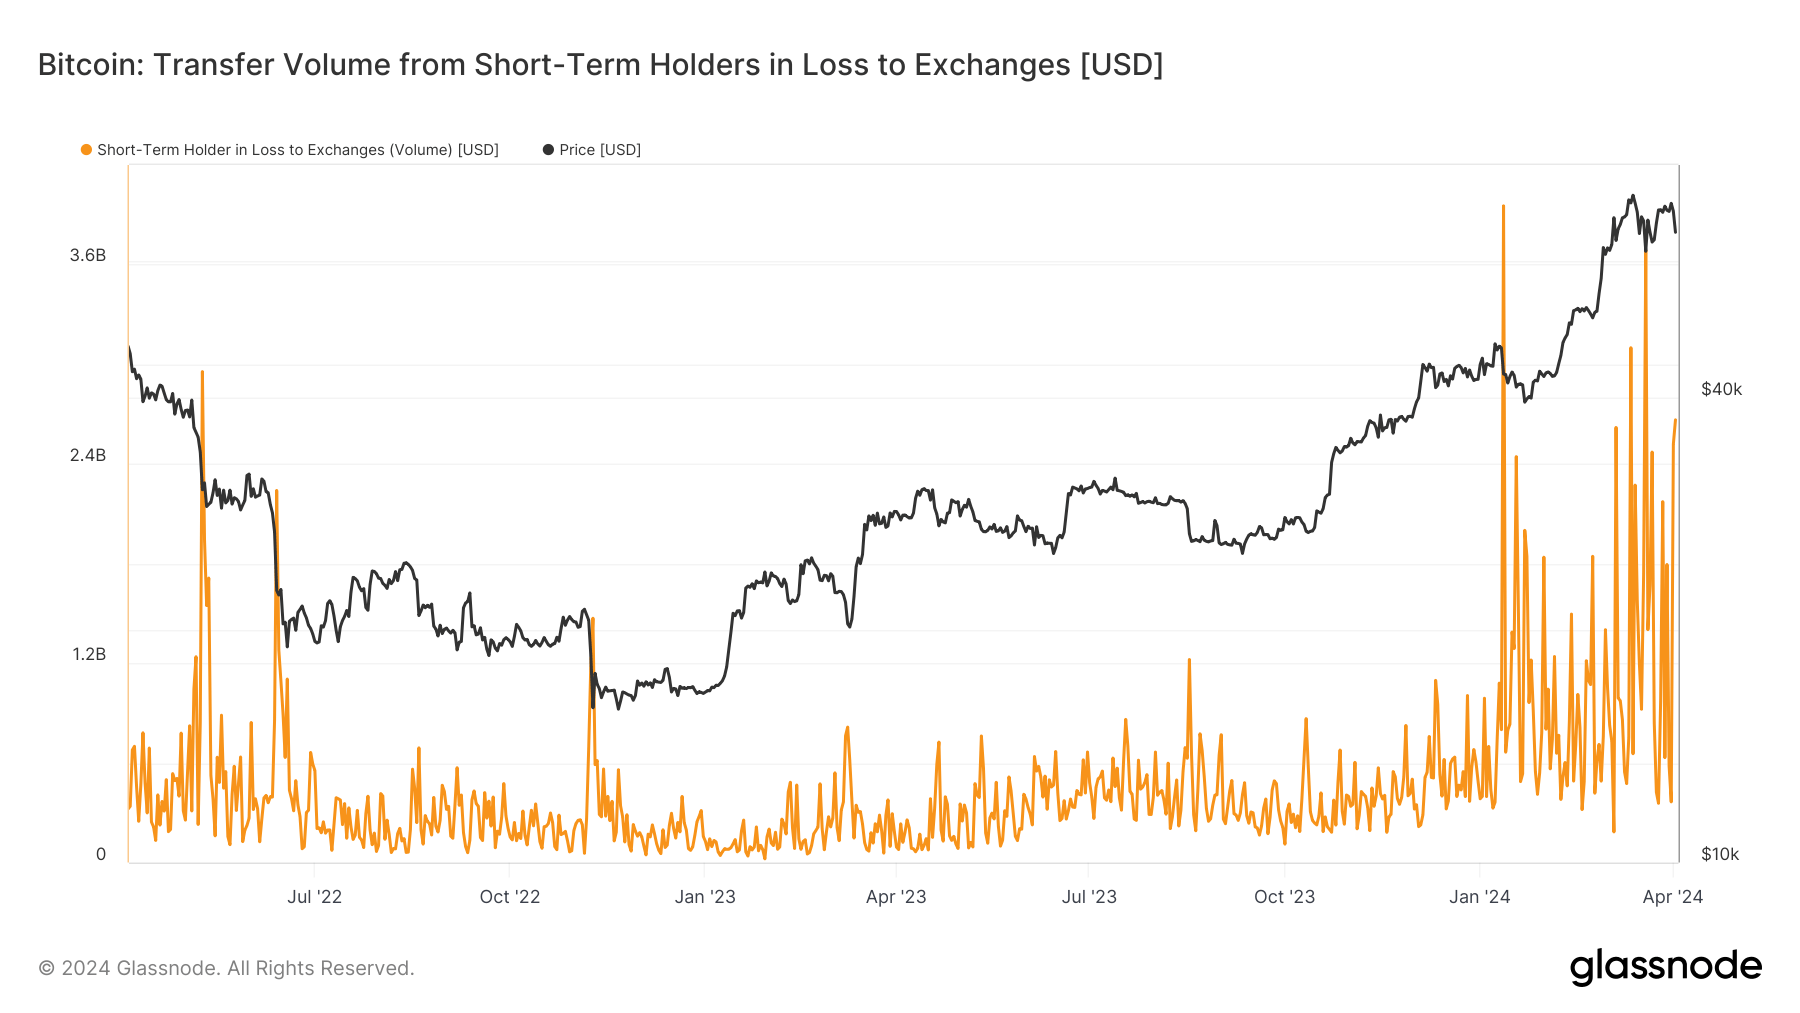
Indeed, on-chain data would confirm this. Below is a Glassnode chart shared by Straten, which reveals the trend in the transfer volume in loss (in USD) going from the wallets of the STHs to centralized exchanges.

Bitcoin STH Capitulation

As displayed in the above graph, Bitcoin short-term holders have recently deposited a large number of tokens holding a loss into exchange-affiliated wallets.

Exchange inflows usually suggest demand for using the services these platforms provide, which can include selling. As these latest deposits from the STHs have come following a sharp drop in the price, it would appear possible that the panic-sellers indeed made these inflows.

As the Bitcoin price is currently near the all-time high (ATH), most of the STH group would be holding a profit. So, all this loss volume can only come from those who bought at the recent highs.

This isn’t the first time the market has observed such quick capitulation from FOMO buyers this year. The chart shows that the exchange transfer volume in loss from the STHs also spiked very high during the plunge that followed the latest price ATH.

The spike back then was even greater in scale than the one witnessed recently and suggested the shakeout of the holders who the news of the ATH had driven in.

In the latest capitulation event, the Bitcoin STHs have deposited $5.2 billion worth of underwater coins to the exchanges within a two-day window.

BTC Price

Since the plunge a few days ago, Bitcoin has been unable to find any significant upward momentum, as its price has only been able to recover to $66,500.

Bitcoin Price Chart

Bitcoin Traders Capitulate: Here’s What Happened Last 2 Times

On-chain data shows the Bitcoin investors have been capitulating recently, a sign that FUD has been gripping the market.

Bitcoin Total Amount Of Holders Has Seen A Drop Recently

According to data from the on-chain analytics firm Santiment, the Bitcoin Total Amount of Holders has registered a notable decline recently. The “Total Amount of Holders” here is an indicator that measures the total number of addresses on the BTC blockchain that are carrying some non-zero balance right now.

When the value of this metric trends up, it can mean that fresh hands are potentially investing into the cryptocurrency, opening new addresses and adding coins to them.

The indicator would naturally also increase if any investors who had left the asset before are returning back to it and filling up their wallets again. Another possible reason for the trend can also be due to holders breaking up their holdings into multiple wallets, for purposes like privacy.

In general, though, an increase in the Total Amount of Holders is usually a sign that net adoption of the coin is taking place, which can be a bullish sign in the long term.

On the other hand, a decline in the indicator can signal that some investors have decided to leave the cryptocurrency behind, as they have completely liquidated their holdings.

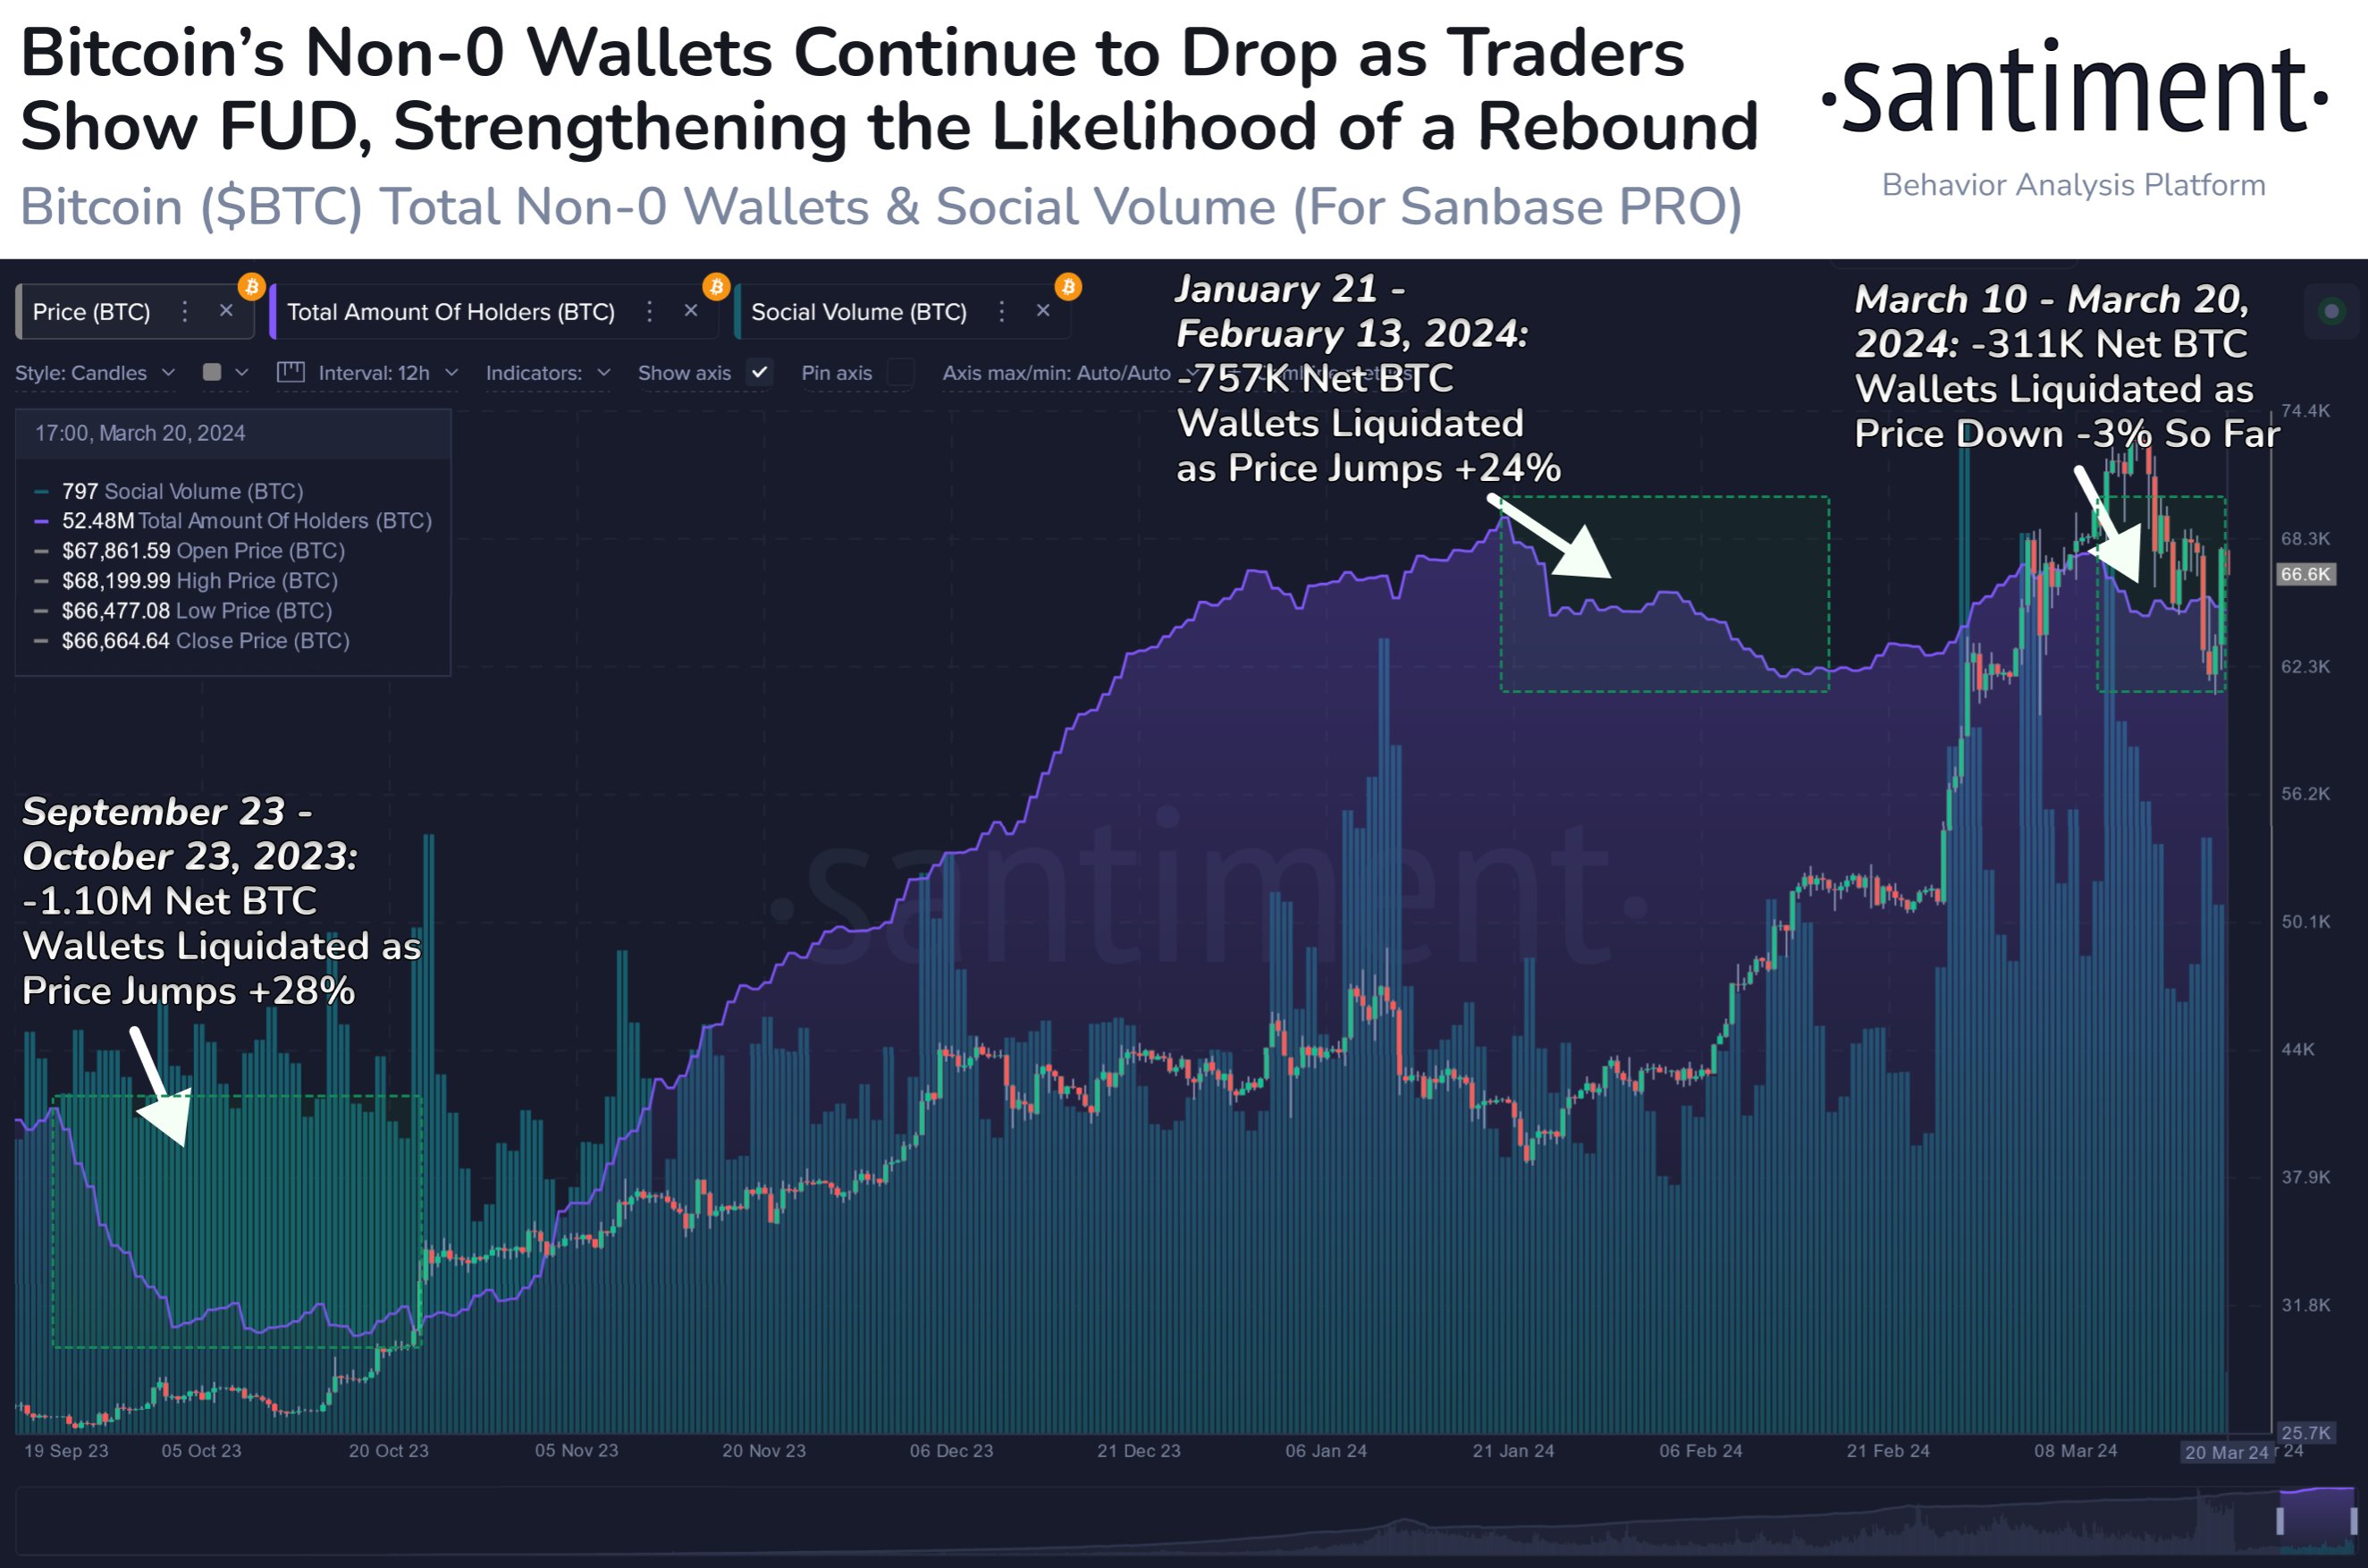
Now, here is a chart that shows the trend in the Bitcoin Total Amount of Holders over the past few months:

Bitcoin Total Amount of Holders

As displayed in the above graph, the Bitcoin Total Amount of Holders has suffered a decrease during the past 10 days or so. In all, 311,000 addresses have completely emptied themselves inside this window.

“To a novice trader, this may appear to be a concern with less overall active participants. However, historically this stat has reflected FUD moments in the market, indicating small BTC wallets are typically capitulating as large wallets scoop up their coins,” explains Santiment.

From the chart, it’s visible that there have also been two other instances of mass capitulation within the past few months. More specifically, 1.1 million addresses exited between the 23rd of September and 23rd of October, while 757,000 capitulated between the 21st of January and 13th of February.

Interestingly, during these capitulation events, the price went up 28% and 24%, respectively. So far since the latest selloff from the small hands has started, the cryptocurrency is down about 3%.

“If history is any indication, Bitcoin has a strong chance of putting up positive returns before this exodus of non-0 wallets this round (due to traders thinking the top is in) finally stops,” notes the analytics firm.

BTC Price

Since Bitcoin’s low at $60,600, the asset has enjoyed some sharp recovery as its price has now surged to the $66,800 level.

Bitcoin Price Chart

Bitcoin Short-Term Holders Panic Capitulate $2.6 Billion In BTC Crash

On-chain data shows that Bitcoin short-term holders have panic sold $2.6 billion worth of coins in the crash following the new all-time high.

Bitcoin Short-Term Holders Have Sent Huge Volume In Loss To Exchanges

As analyst James V. Straten explained in a new post on X, Bitcoin short-term holders have shown signs of capitulation during the latest drop in the cryptocurrency’s price.

The “short-term holders” (STHs) refer to the BTC investors who bought their coins within the past 155 days. The STHs make up one of the two main divisions of the market, the other one being the “long-term holders” (LTHs).

Statistically, the longer an investor holds onto their coins, the less likely they are to sell at any point. This means that the STHs, who are relatively new hands, generally sell quickly whenever an asset crash or rally occurs. The LTHs, on the other hand, usually show resilience, only selling at specific points.

One way to track whether either of these groups is selling is through the transfer volume they are sending to exchanges. First, here is a chart that shows the trend in the Bitcoin exchange inflow volume precisely for the STHs in loss:

Bitcoin Short-Term Holders

As displayed in the above graph, the Bitcoin STHs have transferred around $2.6 billion worth of coins in loss to exchanges in the past day, implying that some members of this cohort have capitulated.

This spike is huge, but it’s less than the loss-taking event that took place back during the price drawdown that followed the BTC spot exchange-traded fund (ETF) approval.

These loss sellers would be those who FOMO’d into the rally that took BTC to a new all-time high beyond the $69,000 level, but their conviction wasn’t strong enough that they were able to hold past the sharp crash that BTC observed shortly after.

The STHs aren’t the only ones who have exited the market in this latest price volatility; it would appear that the LTHs have also done some selling. The difference, however, is that these HODLers have made profits.

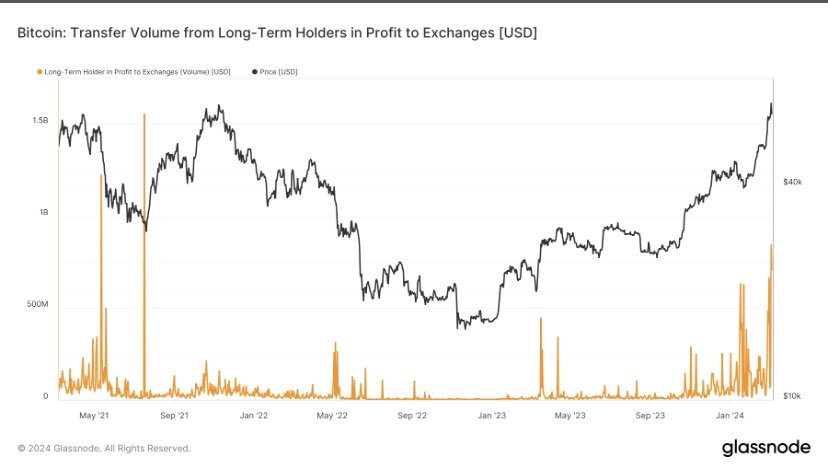
The chart below shows how the exchange transfer volume for the LTHs in profit has looked like recently.

Bitcoin Long-Term Holders

The graph shows that the Bitcoin LTHs have participated in their largest profit-taking event since July 2021, transferring tokens worth $1.5 billion to exchanges.

Thus, it would appear that this recent volatility has shaken up the conviction of even some of the diamond hands, although these HODLers have at least still been rewarded with profits.

BTC Price

At the time of writing, Bitcoin is trading around the $65,800 mark, up 8% in the past week.

Bitcoin Price Chart

Bitcoin Capitulation: Holders Flee BTC As Post-ETF Disappointment Hits

On-chain data shows that Bitcoin investors have been clearing out their wallets recently as the asset continues to be disappointing in this post-ETF era.

Bitcoin Small Wallets Have Been Displaying Signs Of Capitulation

According to data from the on-chain analytics firm Santiment, the number of small BTC wallets has seen a sharp decline during the last few days. The indicator of relevance here is the “Supply Distribution,” which tells us about the amount of wallets that currently belong to the different holder groups on the Bitcoin network.

The addresses are divided into these groups based on the number of coins they are carrying in their balance right now. A wallet carrying 0.5 BTC, for instance, would belong inside the 0 to 1 BTC cohort.

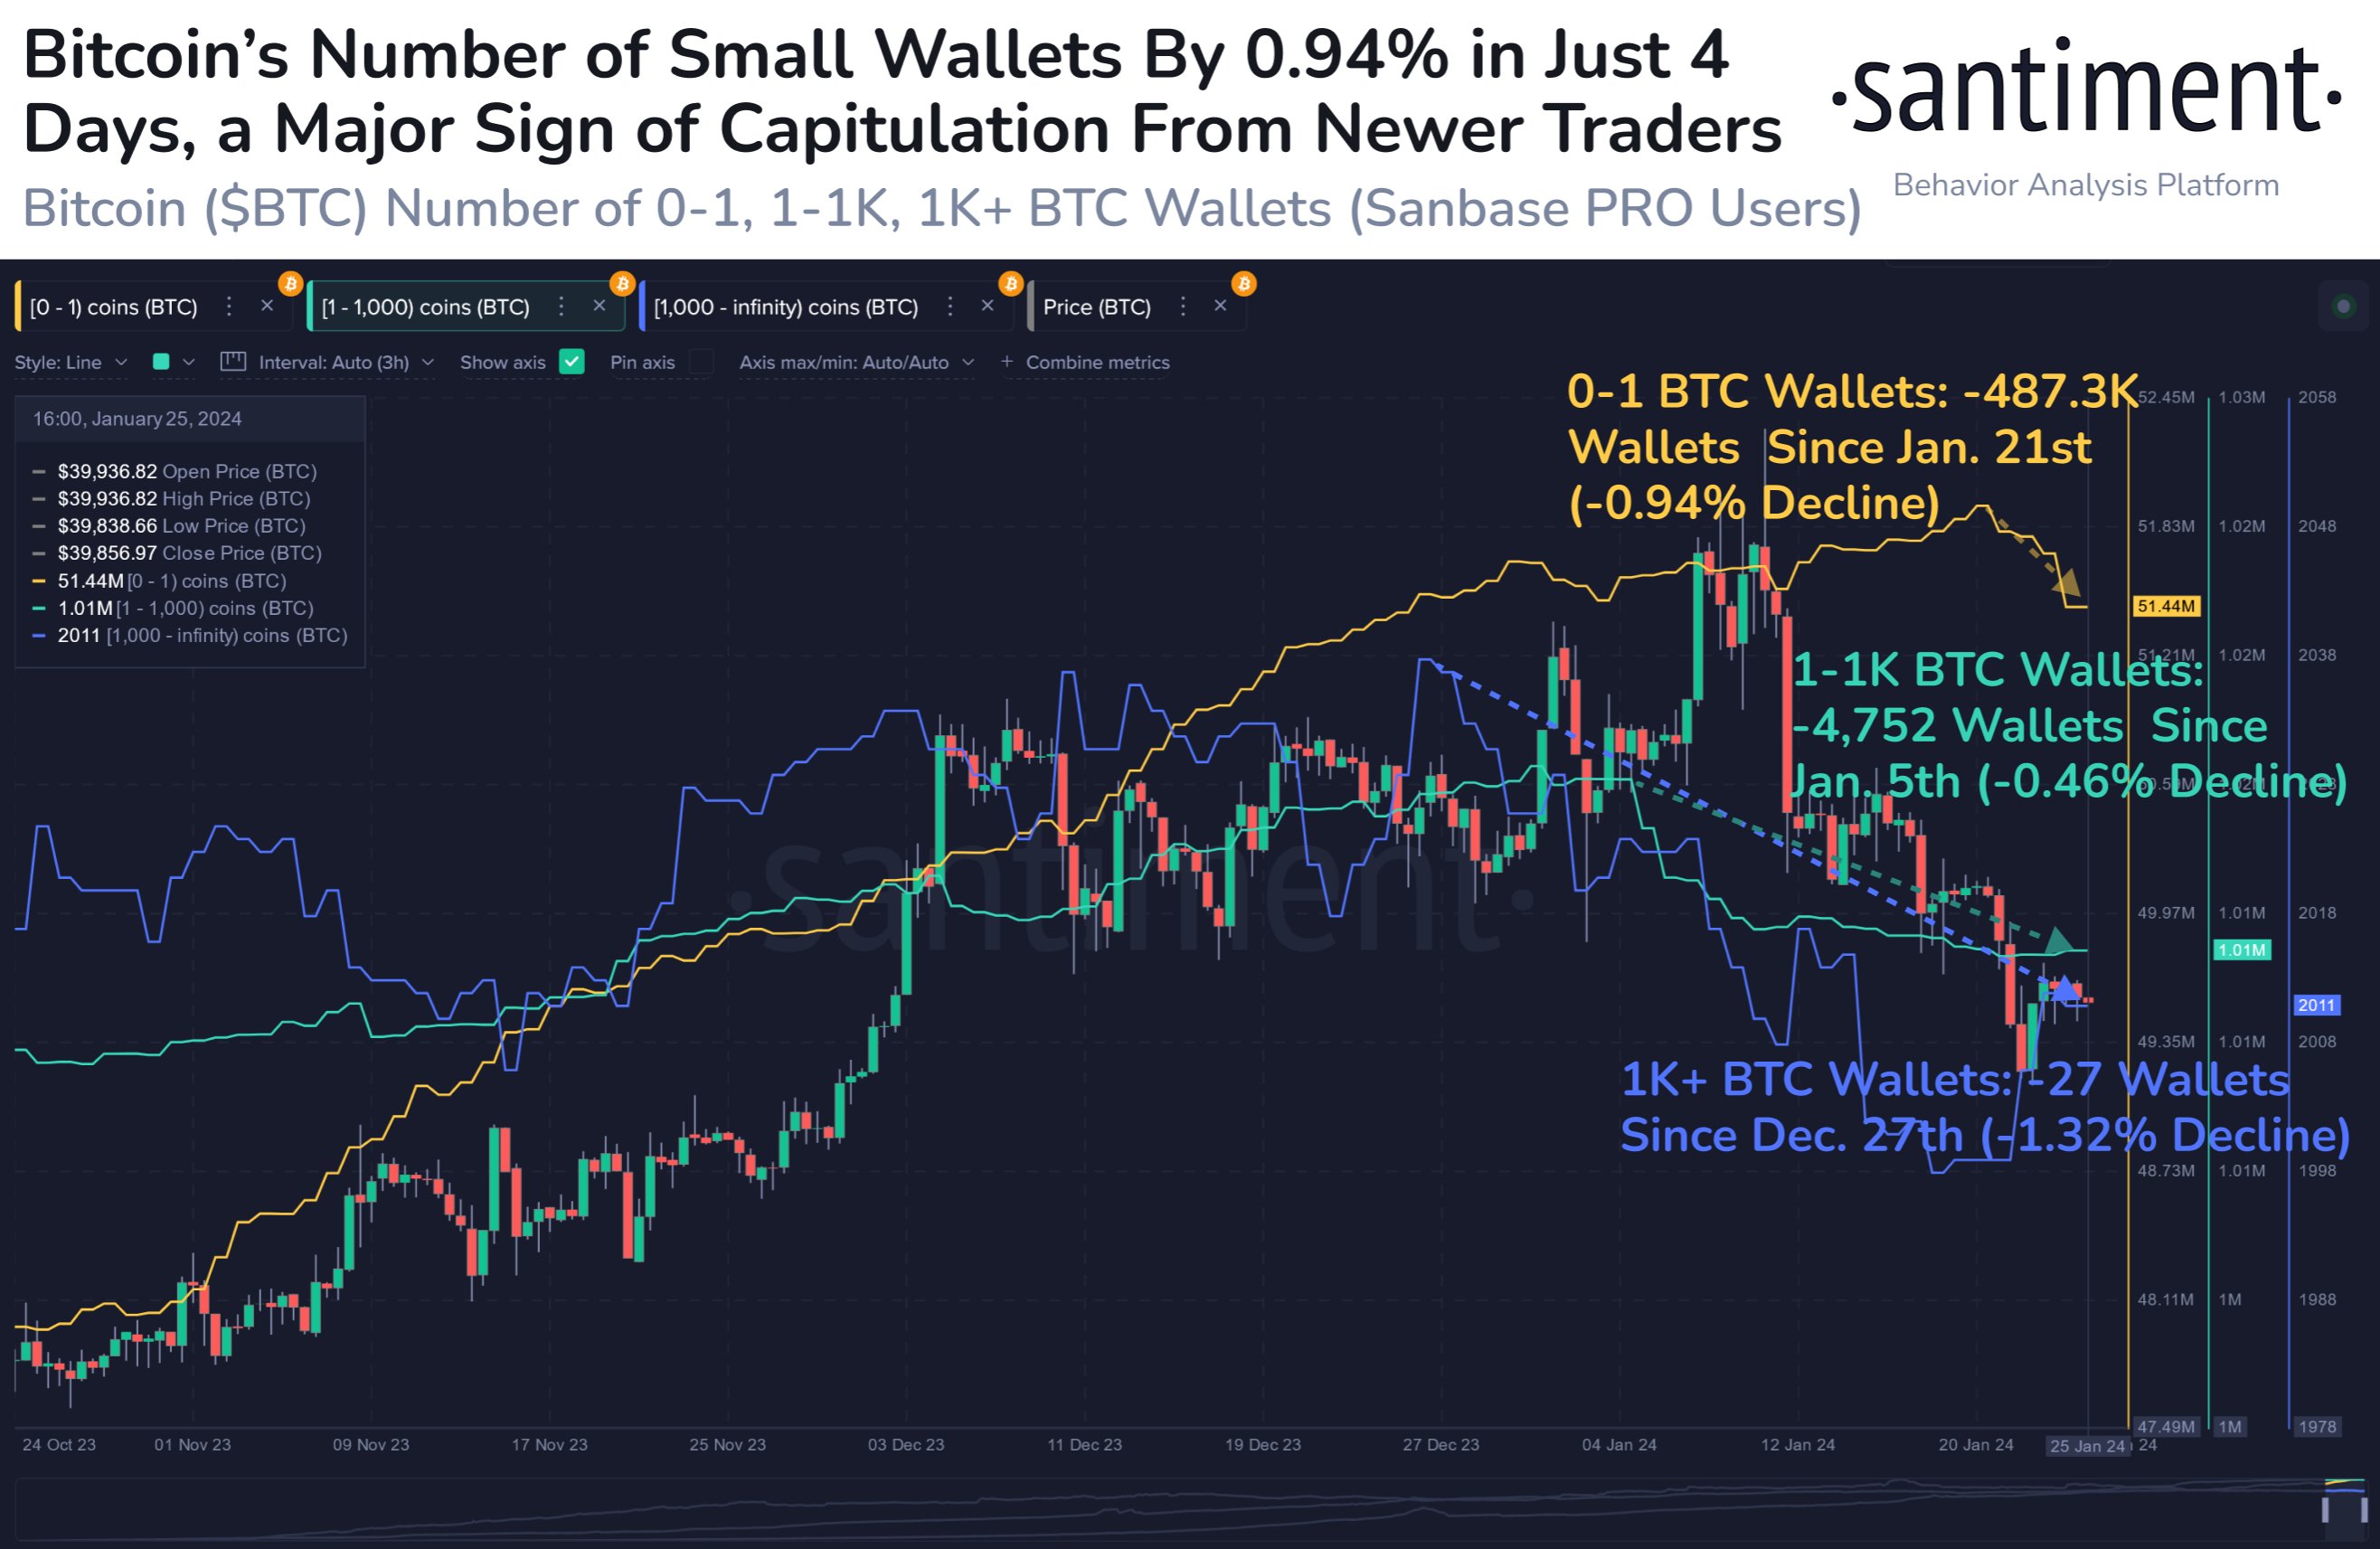
Now, here is a chart that shows the trend in the Supply Distribution for three different Bitcoin wallet groups over the last few months:

Bitcoin Supply Distribution

The first wallet group on the chart is the “0 to 1” coins cohort. The owners of such small wallets are usually the retail investors, popularly known as the “shrimps.”

From the graph, it’s visible that these small hands have seen the total number of their wallets go down in the last few days. To be more specific, around 487,300 shrimps have cleared out their wallets in this selloff, a decline of almost 1%.

“History tells us that this is typically a sign of capitulation, which can lead to a market price bounce until smaller traders begin to get optimistic toward crypto as an investment vehicle once again,” explains the analytics firm.

“The disappointment of market performances since the 11 ETF approvals over 2 weeks ago is largely attributed as the cause for these wallet liquidations,” Santiment adds.

The spot ETFs have been one of the main topics in the cryptocurrency community during the last few months, and the price rally in Bitcoin was in part driven by anticipation around them. Unlike what some investors had imagined, though, the market sold at the news, and BTC has been unable to recover so far.

The shrimps aren’t the only ones that have capitulated recently, though, as the 1-1,000 coins group has seen a decline of 4,752 wallets since January 5th, while the 1,000+ BTC entities have shed 27 addresses since December 27.

The former group includes the mid-sized Bitcoin holder groups like the “sharks,” while the latter cohort includes the largest of the hands on the network: the “whales.”

Clearly, however, these larger entities had started selling ahead of the spot ETF approvals, while the shrimps had still been optimistic about the event. And interestingly, since the smallholders have started their latest capitulation, the whales have, in fact, seen some growth in their addresses.

BTC Price

Bitcoin has seen some sharp recovery push in the past day as the asset’s price has now bounced back to the $40,800 mark.

Bitcoin Price Chart

Bitcoin Capitulation Deepens As aSOPR Metric Plunges To Dec 2018 Lows

On-chain data shows the Bitcoin aSOPR metric has dropped to lows not seen since December 2018, suggesting that holder capitulation is deepening.

Bitcoin aSOPR Plummets To Lows Not Observed Since Almost 4 Years Ago

As pointed out by an analyst in a CryptoQuant post,  the current capitulation is deeper than during both the 2015 bear and the COVID crash.

The “Spent Output Profit Ratio” (or the SOPR in short) is an indicator that tells us whether Bitcoin investors are selling at a loss or at a profit right now.

When the value of this metric is greater than 1, it means the overall market is realizing some amount of profit currently.

On the other hand, the indicator having values below the threshold implies the average holder is selling at a loss at the moment.

Naturally, the SOPR being exactly equal to 1 suggests the investors as a whole are just breaking even right now.

A modified version of this metric is the “Adjusted SOPR” (aSOPR), which doesn’t take into account any selling of coins that was done within 1 hour of the purchase of said coins. By doing so, the indicator filters any noise from the data that wouldn’t have had any significant consequences on the market.

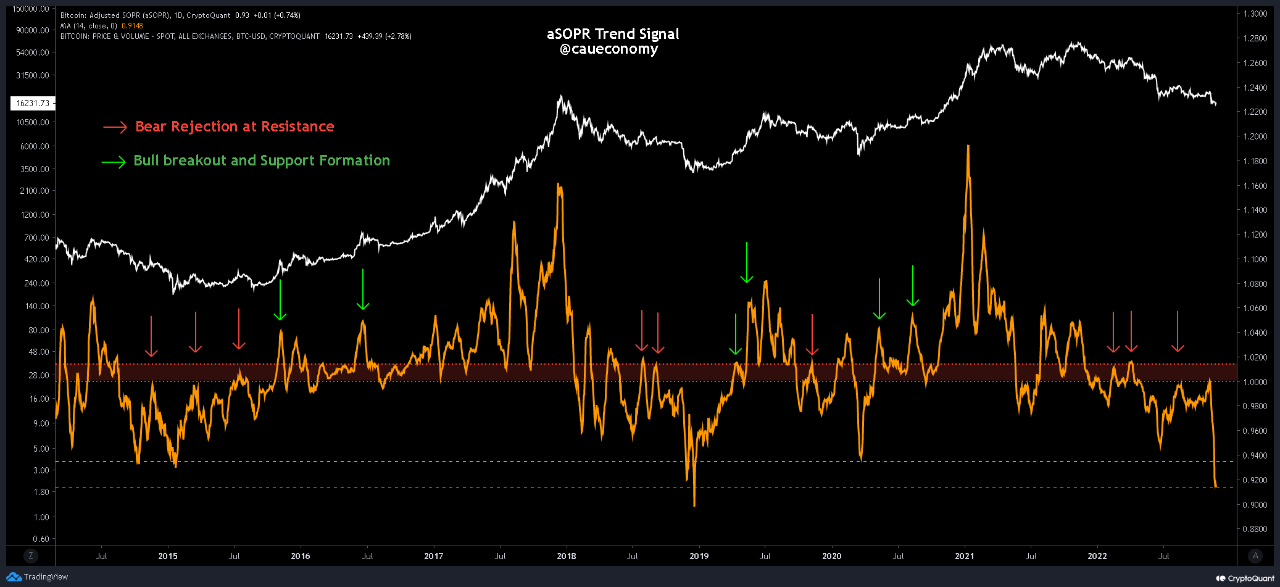
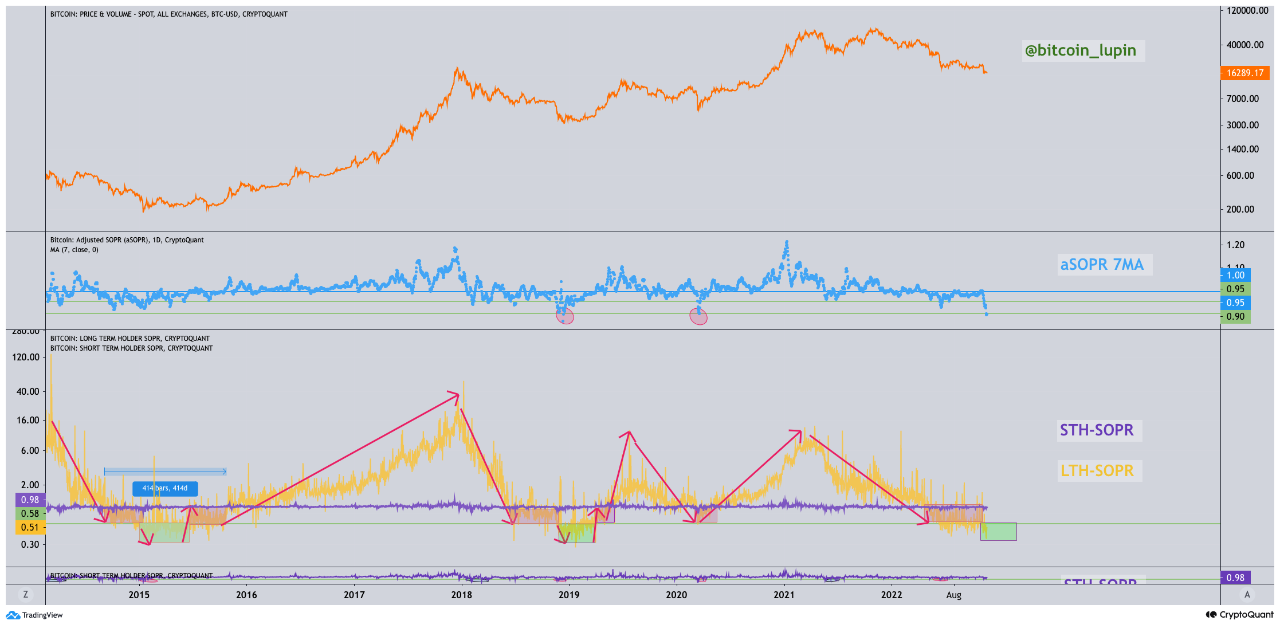
Now, here is a chart that shows the trend in the Bitcoin aSOPR since the year 2014:

Bitcoin aSOPR

The value of the metric seems to have seen a heavy drawdown in recent days | Source: CryptoQuant

As you can see in the above graph, the Bitcoin aSOPR has observed a rapid downwards trajectory below the 1-level recently. This means that BTC investors have been selling their coins at huge losses.

The indicator’s value is now the lowest it has been since the December of 2018, when the bear market of the previous cycle saw its bottom.

These current levels of the metric are also lower than they were during both the 2015 bear market bottom as well as the COVID black swan crash.

Plummets in the aSOPR like the one now indicate that there is widespread capitulation going in the Bitcoin market. Such deep loss realizations have historically lead to the formation of lows in the price as they result in a shift in coins from weak hands to strong hands.

Since the indicator is currently at historical lows, it’s possible the market is approaching a bottom for this cycle. However, it’s worth noting that the 2018 bottom saw even deeper values than now, so it’s uncertain whether the current cycle will also see similar lows or not, before the true bottom is in.

BTC Price

At the time of writing, Bitcoin’s price floats around $16.5k, up 1% in the last week.

Bitcoin Price Chart

BTC has shown strong uptrend in the last two days | Source: BTCUSD on TradingView
Featured image from 愚木混株 cdd20 on Unsplash.com, charts from TradingView.com, CryptoQuant.com

Bitcoin Holders Selling At Large Losses, Is Final Capitulation Here?

On-chain data shows Bitcoin holders have been selling at large losses on the level of previous bottoms, suggesting that the final capitulation for the cycle may be here.

Bitcoin 7-Day MA aSOPR Has Sharply Gone Down Recently

As pointed out by an analyst in a CryptoQuant post, the BTC market participants may be coming close to surrendering.

The relevant indicator here is the “Spent Output Profit Ratio” (SOPR), which tells us whether Bitcoin investors are selling their coins at a profit or at a loss right now.

When the value of this metric is greater than 1, it means the average holder is moving their coins at a profit currently.

On the other hand, the indicator having values less than the threshold suggests the market as a whole is realizing some amount of loss at the moment.

Naturally, the SOPR having values exactly equal to 1 implies the investors are just breaking-even on their selling.

The “Adjusted SOPR” (aSOPR) is a modified version of this metric that doesn’t take into account movement of all those coins that were sold within an hour of being bought. This helps remove noise from the data that won’t have any significant impacts on the market.

Now, here is a chart that shows the trend in the 7-day moving average Bitcoin aSOPR over the last several years:

Bitcoin aSOPR

Looks like the 7-day MA value of the metric has declined in recent days | Source: CryptoQuant

As you can see in the above graph, the 7-day MA Bitcoin aSOPR has taken a deep dive below the 1 mark recently. This means that investors are now selling at some big losses.

The current levels of the indicator are the same as those observed back during the 2018-19 bear market bottom, as well as during the COVID crash.

The reason such deep capitulations have usually coincided with major bottoms in the price of the crypto is that they signify an exhaustion of selling pressure as the weak holders give up and dump their holdings at a loss.

Stronger hands then buy these coins up and accumulate at cheap prices, leading to a more positive outcome in the long term.

If the current capitulation really is the final one, then a bottom may be in sight for Bitcoin. However, bullish trend wouldn’t immediately follow the coin; the short term outcome is likely to still be bearish.

BTC Price

At the time of writing, Bitcoin’s price floats around $16.1k, down 5% in the last week.

Bitcoin Price Chart

The value of the crypto seems to have gone down during the past day | Source: BTCUSD on TradingView
Featured image from 愚木混株 cdd20 on Unsplash.com, charts from TradingView.com, CryptoQuant.com

Summary Of The Contagion Event That Brought On The Bear Market

Are we in a bear market? Opinions vary, but it certainly feels like one. Markets across the board and across the world are in the red, and the bitcoin and crypto ones are no exception. If you’ve been paying attention, you know how all of this happened, but a refresher course wouldn’t hurt. Using ARK Invest’s latest Bitcoin Monthly report as a guide, let’s go through the tragic sequence of events and evaluate the bitcoin market as it stands.

According to ARK, the road to the bear market went like this: 

“Beginning with the Terra collapse in early May, contagion spread to major crypto lenders including Blockfi, Celsius, Babel, Voyager, CoinFlex, contributing to the insolvency of the once highly-respected hedge fund, Three Arrows Capital (3AC). Since Terra’s collapse, total crypto market capitalization has dropped ~$640 billion.”

Nevertheless, there seems to be a light at the end of the tunnel. “Promisingly, however, recent fallout (Babel, Voyager, CoinFlex, Finblox) appears lower in magnitude compared to Terra, Celsius, and 3AC.” That doesn’t mean the end of the bear market is near, nor that capitulation is already over. Especially if the Mt. Gox victims receive the rumored 150K BTC.

First, let’s follow ARK as they analyze two of the main players in this drama. Then, let’s check the stats of the bitcoin market to see if we can find signs and clues that point out to the end of the capitulation stage. SPOILER ALERT: The jury is still out on that one. Some signs point to an early end, others to further downside. Aren’t bear markets fun?

Celsius And The Bear Market

When Terra fell, the earth trembled. The Luna Foundation Guard sold nearly all of their 80K BTC reserve trying to defend the UST peg to the dollar. This event could’ve been the catalyst for the bear market. The worst was yet to come, though. Several once-respected institutions were heavily exposed to Terra through its Anchor protocol, and the UST collapse sent them all into a still ongoing death spiral. 

According to ARK, “Celsius froze withdrawals on June 12th in response to significant outflows. Its DeFi debt outstanding is $631 million but the magnitude of its nonDeFi exposure is unclear.” There was still hope for its clients, as the company paid several loans. However, Celsius filed for Chapter 11 bankruptcy, leaving them all high and dry.

The Chief Commercial Officer at Choise.com, Andrey Diyakonov, analyzed the situation for NewsBTC:

“To put things into perspective, we need to turn it upside down, and ask, how much of the recent price action on the markets was influenced by or outright created by Celsius’ actions? What goes around always comes around. It’s so much more ironic given those credible reports that Celsius withdrawals were among those that sent UST and Terra position down the rabbit hole to find out where the bottom is.”

Our team covered that particular claim and the company’s response.

Three Arrows Capital And The Death Spiral

Then, there was “Three Arrows Capital (3AC), a highly regarded crypto hedge fund reportedly managing $18 billion at its peak, appears to be insolvent after taking on too much leverage.” That’s according to ARK, who also says, “Seemingly, 3AC took on excess leverage to try and recover the losses. Its creditors included major players in the industry like Genesis, BlockFi, Voyager, and FTX.”

All of those companies except FTX seem to be counting down to extinction. 

BTC price chart for 07/15/2022 on Velocity | Source: BTC/USD on TradingView.com
Is The Bear Market Just Beginning Or About To End?

Is the bottom in? Opinions vary. In a section titled “Market Contagion Sets Bitcoin Into Capitulation,” ARK analyzes all of the indicators and can’t reach a final conclusion. The numbers are extremely interesting, though.

  • “Down 70% from its all-time high, bitcoin is trading at or below some of its most important levels: its 200-week moving average, the general cost basis of the market (realized price), the cost bases of long-term (LTH) and short-term holders (STH), and its 2017 peak.”

This “suggests extremely oversold conditions,” which is a great sign. However…

  • “Historically, global bottoms occur when the MVRV of short-term holders exceeds the MVRV of long-term holders. That condition has not been met, suggesting the potential for more downside.”

The “condition has not been met,” but it’s close. Very close.

  • “This month, miners generated revenues only 45% of that for the last twelve months, breaching a threshold that usually correlates with market bottoms.”

Miners who didn’t practice proper risk management have been selling at the present low levels. Miners who know what they’re doing will keep holding until we come out of the bear market. The question is, how many companies are in the first group and haven’t sold just yet? 

  • “Net realized losses in bitcoin recently reached a 2-year low, breaching 0.5% for only the fourth time since 2013.”

Historically, this suggests capitulation is over. Or is it?

  • “Bitcoin’s net unrealized loss has hit a 3-year low, highlighting that its current market value is nearly 17% lower than that of its aggregate cost basis. Historically, global bottoms have formed when losses hit 25%+.”

If we’re going to reach 25%, that means there’s still a long way to go.

Is the bear market just beginning or about to end? The data is unclear. But capitulation seems to be nearing its end, which would be the first step in the right direction.

Featured Image by Marc-Olivier Jodoin on Unsplash | Charts by TradingView

Bitcoin Long-Term Holder Capitulation Approaching Bottom Zone, But Not Quite There Yet

On-chain data shows Bitcoin long-term holder capitulation has deepened recently, but has not entered into the historical bottom zone yet.

Bitcoin Long-Term Holder SOPR Continues To Observe Deep Values Below ‘1’

As explained by an analyst in a CryptoQuant post, BTC long-term holders have been realizing losses in recent weeks.

The “spent output profit ratio” (or SOPR in short) is an indicator that tells us whether Bitcoin investors are currently selling at a profit or at a loss.

The metric works by checking the on-chain history of each coin being sold to see what price it was last moved at. If this last selling value of any coin was less than the current BTC price, then that coin has now been sold at a profit.

Related Reading | Can This Bitcoin Ratio Have Hints For A Bottom?

On the other hand, the previous price being more than the one right now would imply the coin has realized some loss.

When the SOPR is greater than one, it means the overall Bitcoin market is harvesting some profits at the moment. On the contrary, a value less than that implies loss realization is going on among BTC investors right now.

“Long-term holder” group includes all BTC investors that held their coins for at least 155 days before selling or moving them. The below chart shows the trend in the 14-day MA SOPR specifically for these LTHs:

The value of the metric seems to have been going down recently | Source: CryptoQuant

As you can see in the above graph, the quant has marked all the relevant points of trend for the 14-day MA Bitcoin long-term holder SOPR.

It seems like the major bottoms in the history of the crypto were formed whenever the indicator’s value sank to a value of around 0.48 (denoted by the green line in the chart).

Related Reading | $15k Possible Bottom For Bitcoin? “Delta Cap” Says So

This kind of value occurs when LTHs go into deep capitulation. Since this is the BTC cohort least likely to sell at any point, large loss realization from them can signal that the bear bottom is coming near.

Currently, the indicator is also below 1, but it still has a value of about 0.62, a bit higher than the historical bottom zone. This would suggest that while Bitcoin may be heading towards a bottom, it’s not quite there yet.

BTC Price

At the time of writing, Bitcoin’s price floats around $19.4k, down 9% in the past week. The below chart shows the trend in the value of the crypto over the last five days.

Looks like the price of the coin has been moving sideways over the last few days | Source: BTCUSD on TradingView
Featured image from Brent Jones on Unsplash.com, charts from TradingView.com, CryptoQuant.com

Bitcoin LTHs Realized Significant Losses Recently, Final Capitulation Here?

Data shows Bitcoin long-term holders have realized a significant amount of losses recently, a sign that the final capitulation before the bottom may be here.

Bitcoin Long-Term Holder SOPR Shows Average of 27% Losses Being Realized This Week

According to the latest weekly report from Glassnode, BTC long-term holders seem to have harvested some losses this week.

The “spent output profit ratio” (or the SOPR in short) is an indicator that tells us whether Bitcoin investors are selling at a profit or a loss right now.

The metric works by looking at the on-chain history of each coin being sold to see what price it last moved at. If this price was less than the current one, then the coin has been sold at a profit.

On the other hand, the last selling price being more than the latest would imply the sale of the coin has realized a loss.

When Bitcoin SOPR values are greater than one, it means coins moving right now are, on average, selling at a profit.

Related Reading | Bitcoin On-Chain Data Signals A Long Squeeze Brewing In Futures Market

While the value of the indicator being less than one suggests the overall market is selling at a loss at the moment. Naturally, the ratio being exactly equal to 1 signifies that investors are breaking even on average.

Now, here is a chart that shows the trend in the Bitcoin SOPR for long-term holders, a cohort that holds their coins for at least 155 days before selling.

Looks like the 7-day average value of the metric has sunk recently | Source: Glassnode’s The Weekly Update – Week 22, 2022

As you can see in the above graph, the Bitcoin long-term holder SOPR has been observing a negative value during this past week.

The current value of the indicator suggests that each LTH coin spent in the last seven days has realized an average of 27% loss.

Related Reading | Billionaire Tim Draper On What Will Trigger The Next Bitcoin Bull Market

The report notes that in the history of the coin, similar values of the metric have only been observed during the final capitulation lows of bear markets.

This may suggest that the current Bitcoin market could also be nearing a bottom. However, both during 2015 and 2018, the LTH SOPR dipped even deeper and the price corrected further before the low was reached.

BTC Price

At the time of writing, Bitcoin’s price floats around $31.7k, up 9% in the last seven days. Over the past month, the crypto has lost 18% in value.

The below chart shows the trend in the price of the coin over the last five days.

The value of Bitcoin seems to have shot up over the past couple of days | Source: BTCUSD on TradingView
Featured image from Unsplash.com, charts from TradingView.com, Glassnode.com

Bitcoin Long-Term Holders Start Capitulating Amid Panic

On-chain data suggests Bitcoin long-term holders have started to capitulate recently as the sharp price drop causes panic in the market.

Bitcoin CDD Inflow Indicator Jumps Up, Showing Long-Term Holders Have Been Selling

As pointed out by a CryptoQuant post, the recent price drop has pushed long-term holders towards selling their BTC.

“Coin days” are the number of days a Bitcoin has remained dormant for. An example: if 1 BTC doesn’t move for 5 days, it accumulates 5 coin days.

When such a coin would be transferred or moved, its coin days would be “destroyed” as the number will reset back to zero.

Related Reading | Bitcoin Slips Below $33k As Exchange Inflows Reach Highest Value Since July 2021

The “coin days destroyed” (CDD) metric naturally measures how many of these coin days are being destroyed in the entire market at any given time.

A modification of this indicator, called the “Bitcoin exchange inflow CDD,” tells us about only those coin days that were destroyed by a transfer to exchanges.

A high value of the inflow CDD generally suggests that long-term holders (who accumulate a large number of coin days) are moving their coins to exchanges.

Investors usually transfer their Bitcoin to exchanges for selling purposes, so LTHs transferring a large number of their coins can be bearish for the price of the crypto.

Now, here is a chart that shows the trend in the BTC inflow CDD over the past month:

The value of the indicator seems to have spiked up recently | Source: CryptoQuant

As you can see in the above graph, the Bitcoin exchange inflow CDD has observed some high values over the last few days.

This shows that long-term holders have been selling amid the recent panic in the market due to the price drop from $38k to below $30k.

Related Reading | Terra Beats Tesla As Second-Largest Corporate Bitcoin Holder After $1.5B Purchase

The especially large spikes in the last two days suggest LTHs may have started to go through a phase of capitulation.

Since LTHs usually make up the Bitcoin cohort that is the least likely to sell, capitulation from them is a negative sign for the price of the coin.

BTC Price

At the time of writing, Bitcoin’s price floats around $31.6k, down 18% in the last seven days. Over the past month, the crypto has lost 26% in value.

The below chart shows the trend in the price of the coin over the last five days.

Looks like the price of BTC has observed a plunge in the past few days | Source: BTCUSD on TradingView

Bitcoin’s drop has continued today as the crypto briefly touched below $30k for the first time since July of last year, before rebounding back to the current level.

Featured image from Unsplash.com, charts from TradingView.com, CryptoQuant.com

Glassnode’s RHODL Ratio May Suggest Bitcoin Market Is Near Capitulation

Glassnode data shows the RHODL Ratio’s current trend suggests that the Bitcoin market could be near capitulation.

Data Shows Bitcoin RHODL Ratio Has Observed Decline Recently

As per the latest weekly report from Glassnode, the supply of coins older than one year has significantly risen recently.

To understand the RHODL ratio, you first need to have a look at the “realized cap HODL waves.” This indicator measures the USD-dominated amount of Bitcoin held by investors hodling since different periods of time.

For example, the wave band for coin age more than 1+ year shows the total amount of coins all investors hodling since at least a year currently own.

The “realized HODL” (or RHODL in short) ratio is a metric that tells us the ratio between the wave bands of 1-week old and 1-year old Bitcoin supplies.

When the value of this indicator reaches a high, it means new holders hold a majority of the supply at the moment. Such values usually occur during price tops.

Related Reading | Research Explains Bitcoin Mining Could Be Helpful For US Energy Independence

On the other hand, low values of the metric suggest 1+ year old age bands currently own a larger part of the total Bitcoin supply. These values of the indicator have historically been observed near market bottoms.

Now, here is a chart that shows the trend in the BTC RHODL Ratio over the history of the crypto:

Looks like the value of the indicator has seen decline recently | Source: Glassnode’s The Week Onchain – Week 13, 2022

As you can see in the above graph, the Bitcoin RHODL Ratio has observed some sharp downtrend in recent months.

This trend means that the supply of 1+ year old holders is going up, while that of one-week old coins is declining.

Related Reading | Bitcoin Likely To Continue Upward Trajectory, Is $50K Its Next Target?

Also, as the chart shows, such a trend with the Bitcoin RHODL ratio heading down after a bull run has historically signaled that the market is near capitulation.

Back in 2012, however, it was rather a sign of the early bull market rather than an approach to the late stages of the bear market.

So, the current trend can go both ways, but the near capitulation phase is when these values of the indicator were observed the last two times.

BTC Price

At the time of writing, Bitcoin’s price floats around $47.8k, up 11% in the last seven days. Over the past month, the crypto has gained 27% in value.

The below chart shows the trend in the price of the coin over the last five days.

BTC’s price seems to have surged up over the last couple of days | Source: BTCUSD on TradingView
Featured image from Unsplash.com, charts from TradingView.com, Glassnode.com

82% Of Bitcoin Short-Term Holder Supply Now In Loss, Capitulation Ahead?

On-chain data shows around 82% of the Bitcoin short-term holder supply is currently in loss, suggesting that capitulation may occur soon.

82% Of Bitcoin Short-Term Holder Supply Now In Loss, While Total STH Supply Declines

According to the latest weekly report from Glassnode, the BTC STH supply is nearing all-time lows at the moment. However, 82% of it is being held at a loss.

The “BTC short-term holder supply” is that part of the total Bitcoin supply that has been held for less than 155 days.

The investors holding this supply are usually the likeliest to sell their coins off during market volatility, and especially when a capitulation flush out occurs.

An on-chain indicator, the Bitcoin STH supply in profit/loss, tells us the percentage distribution between these coins being held at a profit and those being held at a loss.

When a high amount of this supply is in loss, there may be more sell-side pressure in the market as short-term holders capitulate easily.

Related Reading | Bitcoin MPI Rises To Highest Value Since March 2021, Bull Rally Soon?

Now, here is a chart that shows the trend in the BTC STH supply over the history of the coin:

Looks like the value of the indicator has declined over the years | Source: Glassnode’s The Week Onchain – Week 11, 2022

As you can see in the above graph, the Bitcoin STH supply has been observing a constant downtrend over much of the history of the coin, and is currently near all-time low values. The decrease in this supply happens when some of the coins mature beyond the 155-day cutoff, thus becoming part of the “long-term holder supply” instead.

Since short-term holders can be a big source of sell-side pressure, the number of coins held by them severely going down can be bullish for the price of the crypto.

Related Reading | Bitcoin Hashrate Swells 15% Since Last Week As Analysts Expect Mining Difficulty To Increase

However, while the supply is low right now, around 82% of it is currently in loss. So despite the decline in total supply, these coins in loss still amount to around 2.5 million BTC, and thus they can add quite significant sell pressure to the market.

As macro uncertainties like the Russian invasion of Ukraine continue to loom over the Bitcoin market, these short-term holders may finally break and capitulate in case their coins remain in the red or go even deeper.

BTC Price

At the time of writing, Bitcoin’s price floats around $38.5k, down 1% in the last seven days. Over the past month, the crypto has lost 10% in value.

The below chart shows the trend in the price of BTC over the last five days.

BTC’s price seems to have been in consolidation for a few days now | Source: BTCUSD on TradingView
Featured image from Unsplash.com, charts from TradingView.com, Glassnode.com

Data Shows Bitcoin Top Buyers Already Capitulated, New Bull Rally Here?

On-chain data suggests Bitcoin buyers who entered at the top may have already capitulated. Last time such a trend happened was back in July 2021, following which a new bull rally occurred.

Lackluster Bitcoin Sell-Off Recently May Suggest Top Buyers Have Already Capitulated

As per the latest weekly report from Glassnode, there hasn’t been any significant loss realization recently despite world-changing events taking place this week.

The relevant on-chain indicator here is the “net realized profit/loss,” which tells us whether the overall Bitcoin market is realizing profits or losses right now.

The metric works by looking at each coin on the blockchain to see what price it last moved at. If this price is less than the current price (that is, the selling price), then the coin sold at a profit. Investors harvesting a large amount of profit generally leads to a correction in the price.

On the other hand, the buying price being more than the current one would imply a realization of loss. The Bitcoin market observing a significant amount of losses being realized can be a sign of widespread capitulation.

Now, here is a chart that shows the trend in the BTC net realized profit/loss over the past year:

The value of the indicator seems to have been slightly negative recently | Source: Glassnode’s The Week Onchain – Week 9, 2022

As you can see in the above graph, it looks like a net amount of loss has been realized recently. However, despite the massive bearish event that is the Russia-Ukraine war taking place this week, the magnitude of these losses is pretty small.

Usually, during such events, capitulation happens in the market where a huge negative spike in the indicator is observed.

Related Reading | Despite Struggling Price, Bitcoin Exchange Reserve Hits Lowest Value Since Sept 2018

An absence of such a spike may be a sign that those who bought Bitcoin at the top had already dumped their Bitcoin during the two capitulation events that preceded this one.

The report has also highlighted a similarity in the chart between the current trend and the one during the May-July mini-bear period.

Related Reading | Battle Of The Hedges: How Gold And Bitcoin Have Performed With Russia-Ukraine Conflict

Before the rally started, It looks like there were three negative spikes back then, with the third being much smaller in magnitude. This trend is quite similar to now.

If there is a pattern here, then the current third spike would mean a fresh Bitcoin bull rally may be beginning soon.

BTC Price

At the time of writing, Bitcoin’s price floats around $43.5k, up 15% over the last week.

Looks like the price of Bitcoin has shown a sharp surge over the past day | Source: BTCUSD on TradingView
Featured image from Unsplash.com, charts from TradingView.com, Glassnode.com

This Crypto Fund Manager Claims Bitcoin Drop Was “Capitulation”

It’s widely believed that even experts can only identify capitulation after it’s already happened. The thing is, in regulated markets, unscrupulous Billionaires/ Bond villains have the decency to manipulate the market behind closed doors. Traditional markets don’t have as strong a sign as infamous Elon’s tweet. 

The CEO of investment advisory firm Vailshire Capital Management, Dr. Jeff Ross, proposes the theory that Elon’s attack on the Bitcoin network generated a “short-term capitulation.” That means, everybody who was ready to sell their Bitcoin at the slight sign of trouble, already did it. The weak hands and short-term traders are out of the game.

Is this Bitcoin’s new bottom?

Of course, so far, the capitulation is just a theory. We can’t really be sure. But, if this is what’s happening, that also means that we’re seeing the new bottom of the Bitcoin market. And other indicators point in that direction. Capriole investment’s founder Charles Edwards identified a dip below 100 Simple Moving Average yesterday, which usually means one thing.

This, of course, has happened before. After 2020’s Bitcoin halving, capitulation hit the market and NewsBTC was there to ease everyone’s minds:

While “capitulation” sounds scary, especially since it has been affiliated with the late-2018 Bitcoin crash, it’s not exactly a bad thing.

As prominent finance podcaster and Bitcoin bull Preston Pysh explained in response to D’Souza’s analysis:

“During the 2016 halving, the price went sideways for 9 days and then had a 28% drop, and it took 100 days to get back to the halving price. Mentally prepare yourself for the efficiency cleansing and difficulty adjustment as the protocol prepares all passengers for launch.”

Related Reading | Was Bitcoin Crash Orchestrated? These 4 Theories Scream Beware

So, summarizing, if capitulation happened and we’re watching a new bottom, we might see the world’s favorite digital asset bounce and climb to new and incredible heights.

BTCUSD chart for 05/15/2021 - TradingView

BTC price chart on Bitstamp | Source: BTC/USD on TradingView.com

How will Bitcoin bounce after such a catastrophic capitulation?

This is the easiest question to answer. And with it, we can also answer another burning question: Did Tesla not do their due diligence before investing more than $1B in BTC? Did Elon just find out about the supposed dangerous levels of energy consumption that the Bitcoin network needs to secure itself? Probably not.

For a possible explanation, we give the mic to Mark Yusko, Morgan Creek Capital Management’s CEO:

Related Reading | Lesson Learned: Teacher Loses Life Savings To Elon Musk Bitcoin Scam

Bitcoin will bounce back with institutional money snatching every coin from scared retail investor’s hands. In fact, the process is probably already happening.

Other theories about Elon Musk’s possible motives include Tesla trying to get tax breaks from the US government’s green policies and that this is the rollout for a renewable-energy-powered mining rig. To learn more about both, jump to our sister site Bitcoinist.

Featured Image by ShutterStock - Charts by TradingView