Buy Or Sell Bitcoin? Quant Reveals What Leading Metric Says

A quant has explained what a potential leading Bitcoin indicator could say about what’s next for the cryptocurrency’s price.

Bitcoin Coinbase Premium May Hold The Answer To Where BTC Goes Next

In a CryptoQuant Quicktake post, an analyst has talked about the trend currently taking place in the Bitcoin Coinbase Premium. “We can use the trend of Coinbase Premium as a leading indicator of the future direction of BTC price,” notes the quant.

The “Coinbase Premium” is a metric that keeps track of the difference between the Bitcoin price listed on the cryptocurrency exchanges Coinbase (USD pair) and Binance (USDT pair).

When the value of this indicator is positive, it means that the price listed on Coinbase is higher than on Binance right now. Such a trend suggests the buying pressure is higher (or the selling pressure is lower) on the former platform than on the latter.

On the other hand, the negative premium implies Coinbase might be observing a higher amount of selling than Binance, as the asset is currently trading at a lower price there.

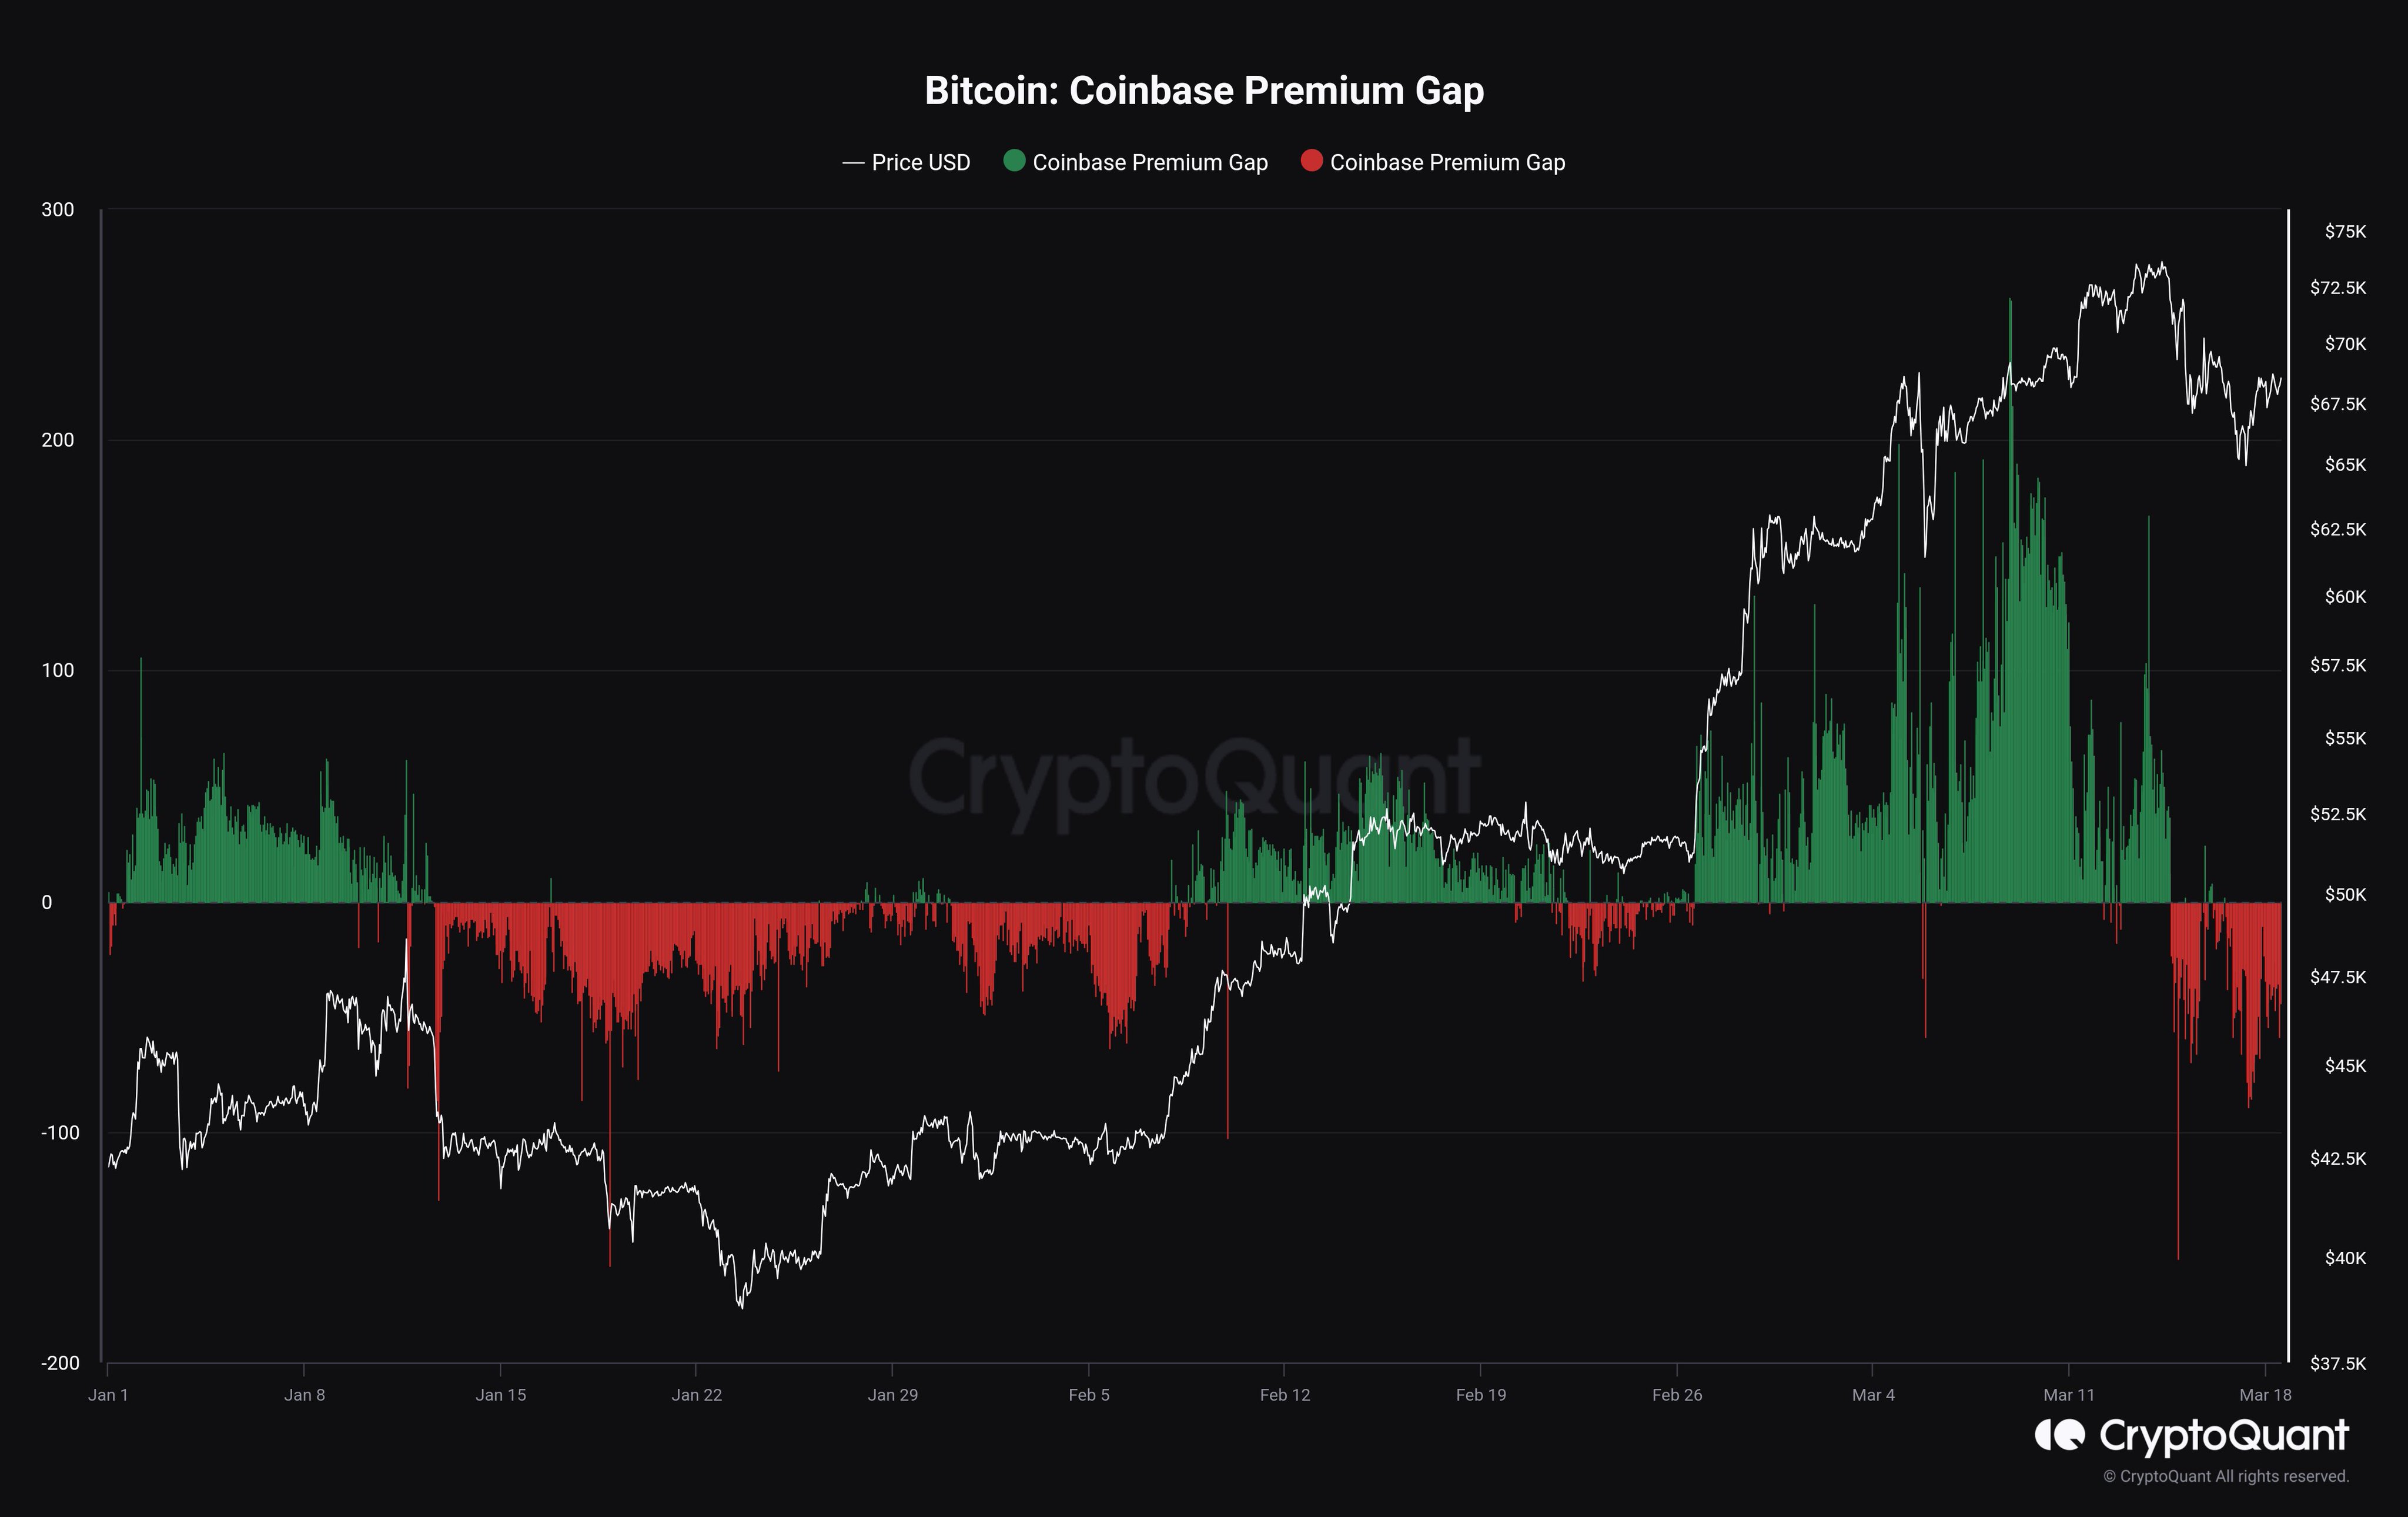
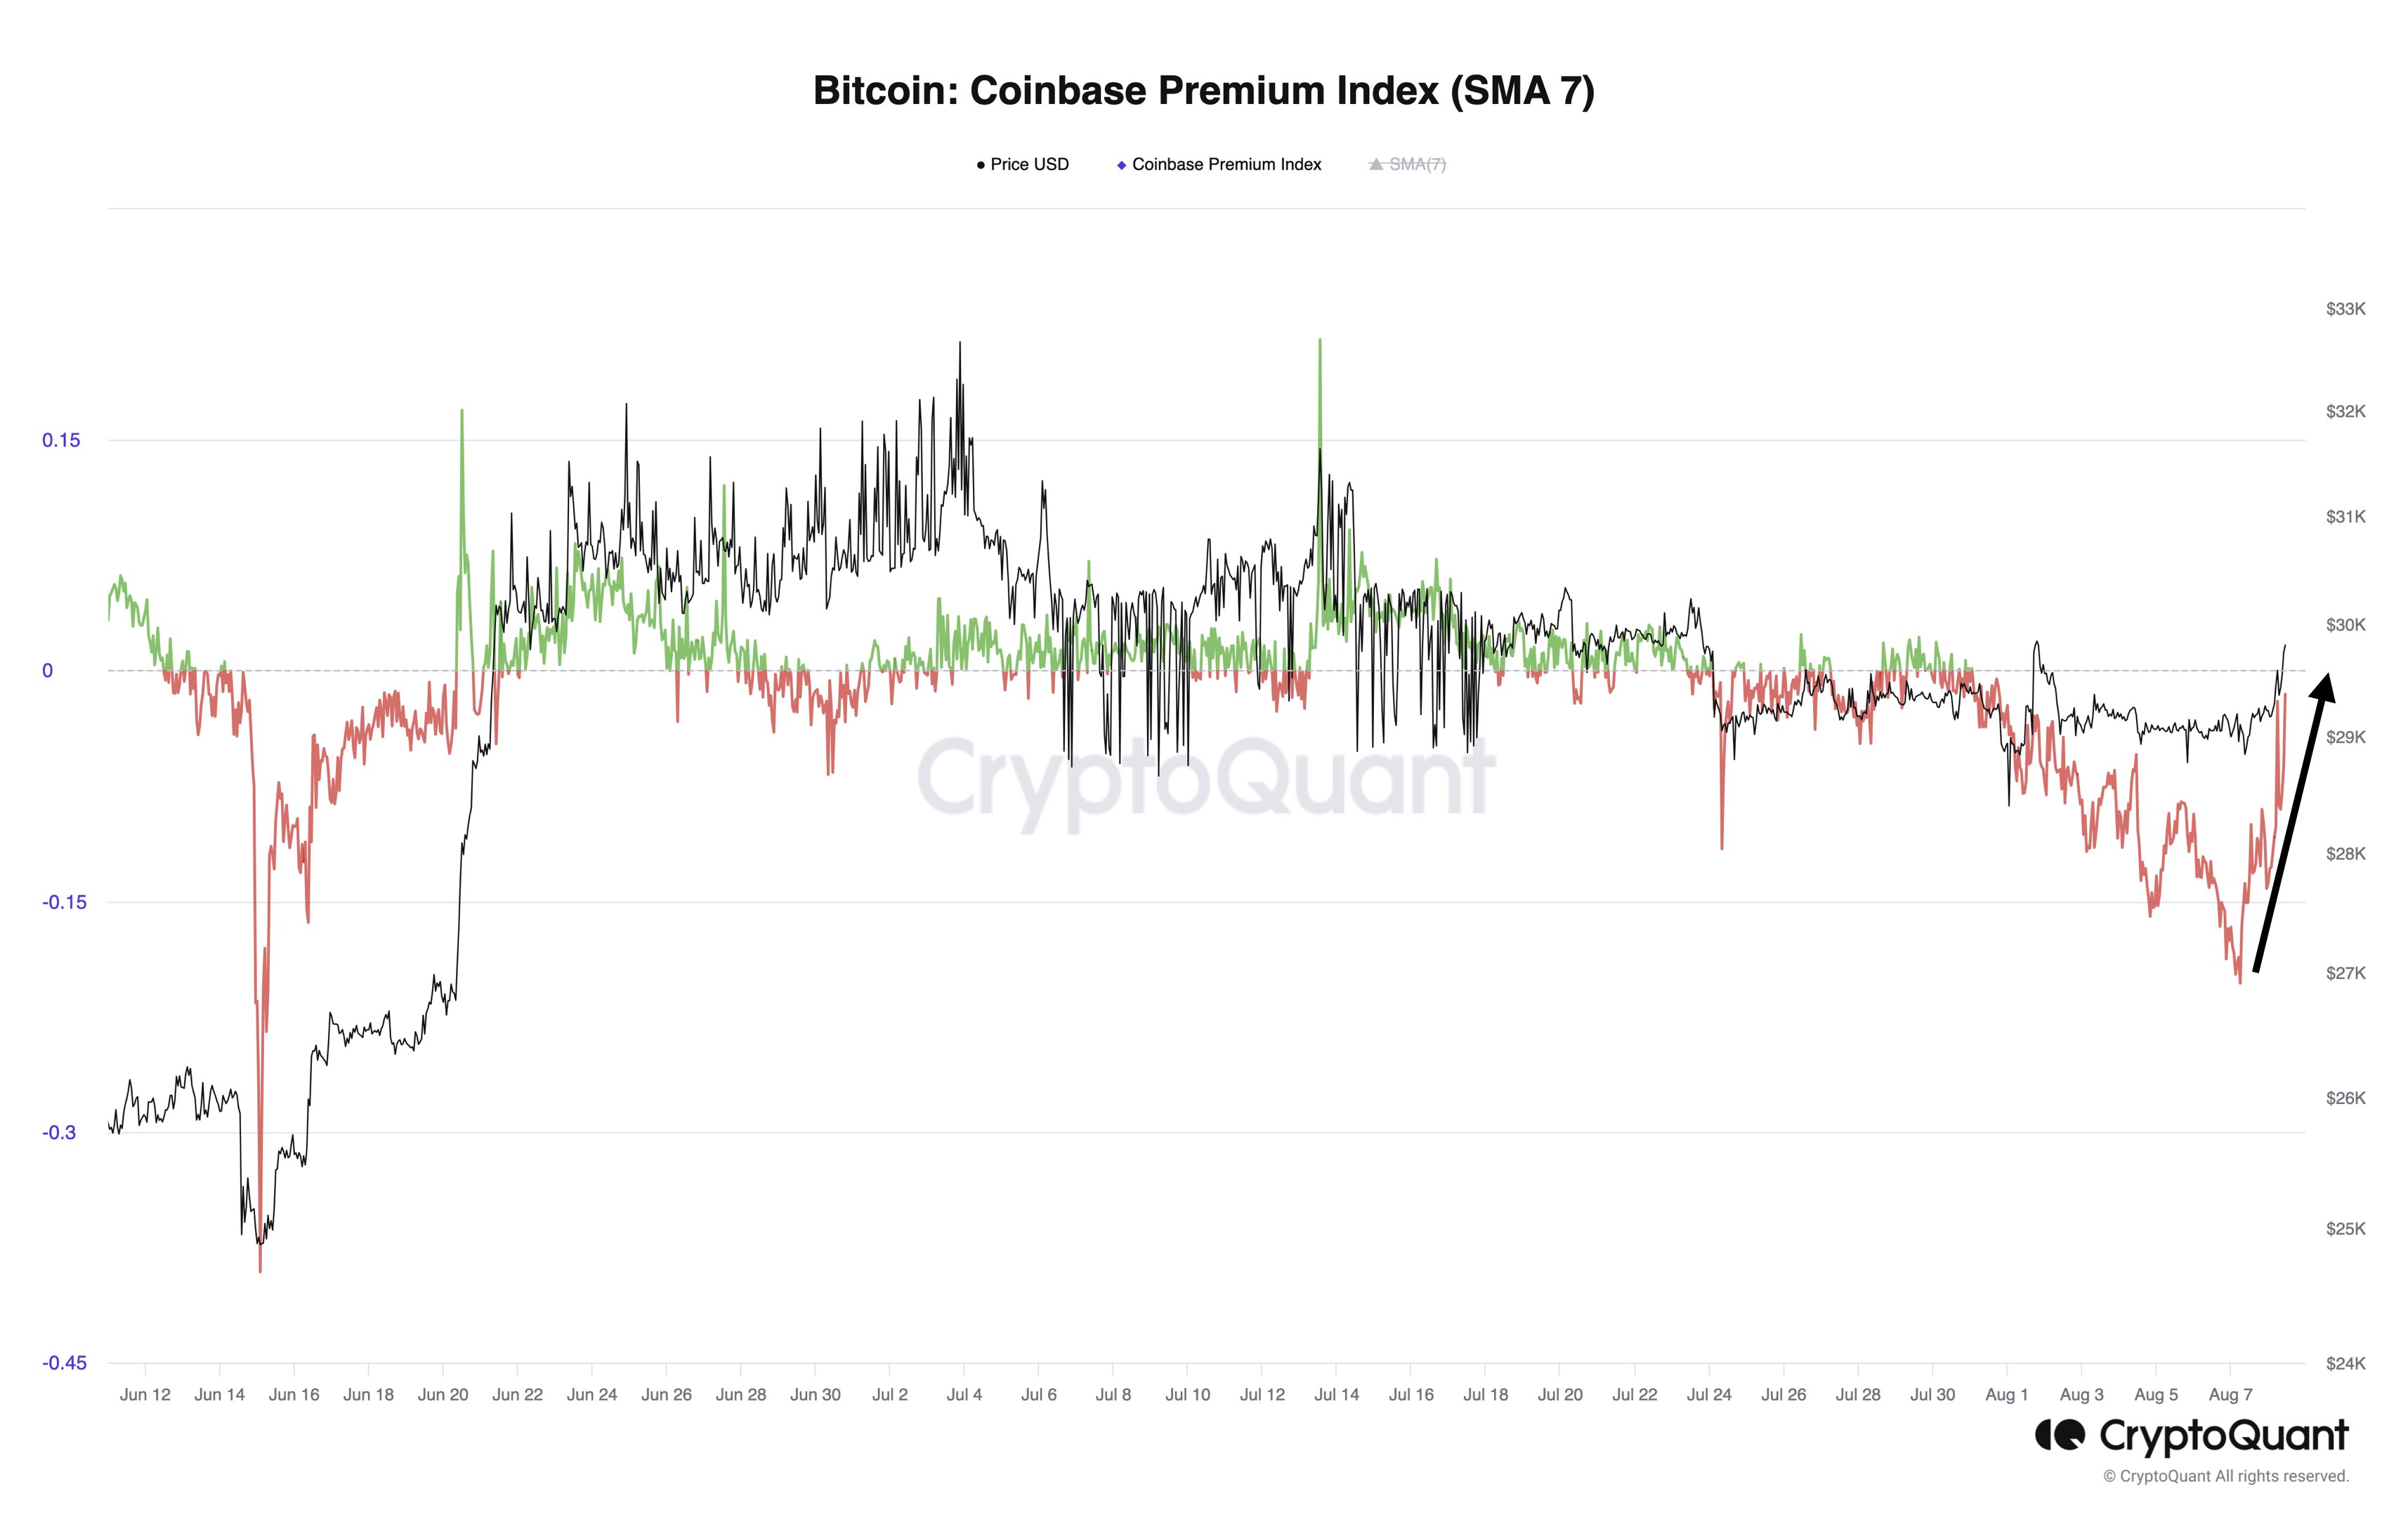
Now, here is a chart that shows the trend in the 30-day moving average (MA) of the Bitcoin Coinbase Premium over the last couple of years:

Bitcoin Coinbase Premium

As displayed in the above graph, the 30-day MA Bitcoin Coinbase Premium has been positive recently, suggesting that Coinbase users have supported the asset through the rally.

Coinbase is popularly known as the preferred platform of the US-based institutional entities, while Binance has a more global user base. As such, the premium’s value can provide hints about how the behavior of the American whales differs from that of the rest of the world.

From the chart, it’s visible that the buying pressure from these institutional traders peaked alongside the price top but has since been declining. The metric continues to be positive overall, although it’s now quite close to the neutral zero mark.

In the graph, the quant has highlighted an interesting pattern that the cryptocurrency has followed regarding the Coinbase Premium during the last two years. It would appear that whenever the indicator has hit bottom in negative territory and reversed back to an uptrend, the coin’s price has observed a rebound.

An example of this trend also played out just earlier in the year, when a reversal in the indicator led to Bitcoin observing a rally in which the asset would eventually break its all-time high.

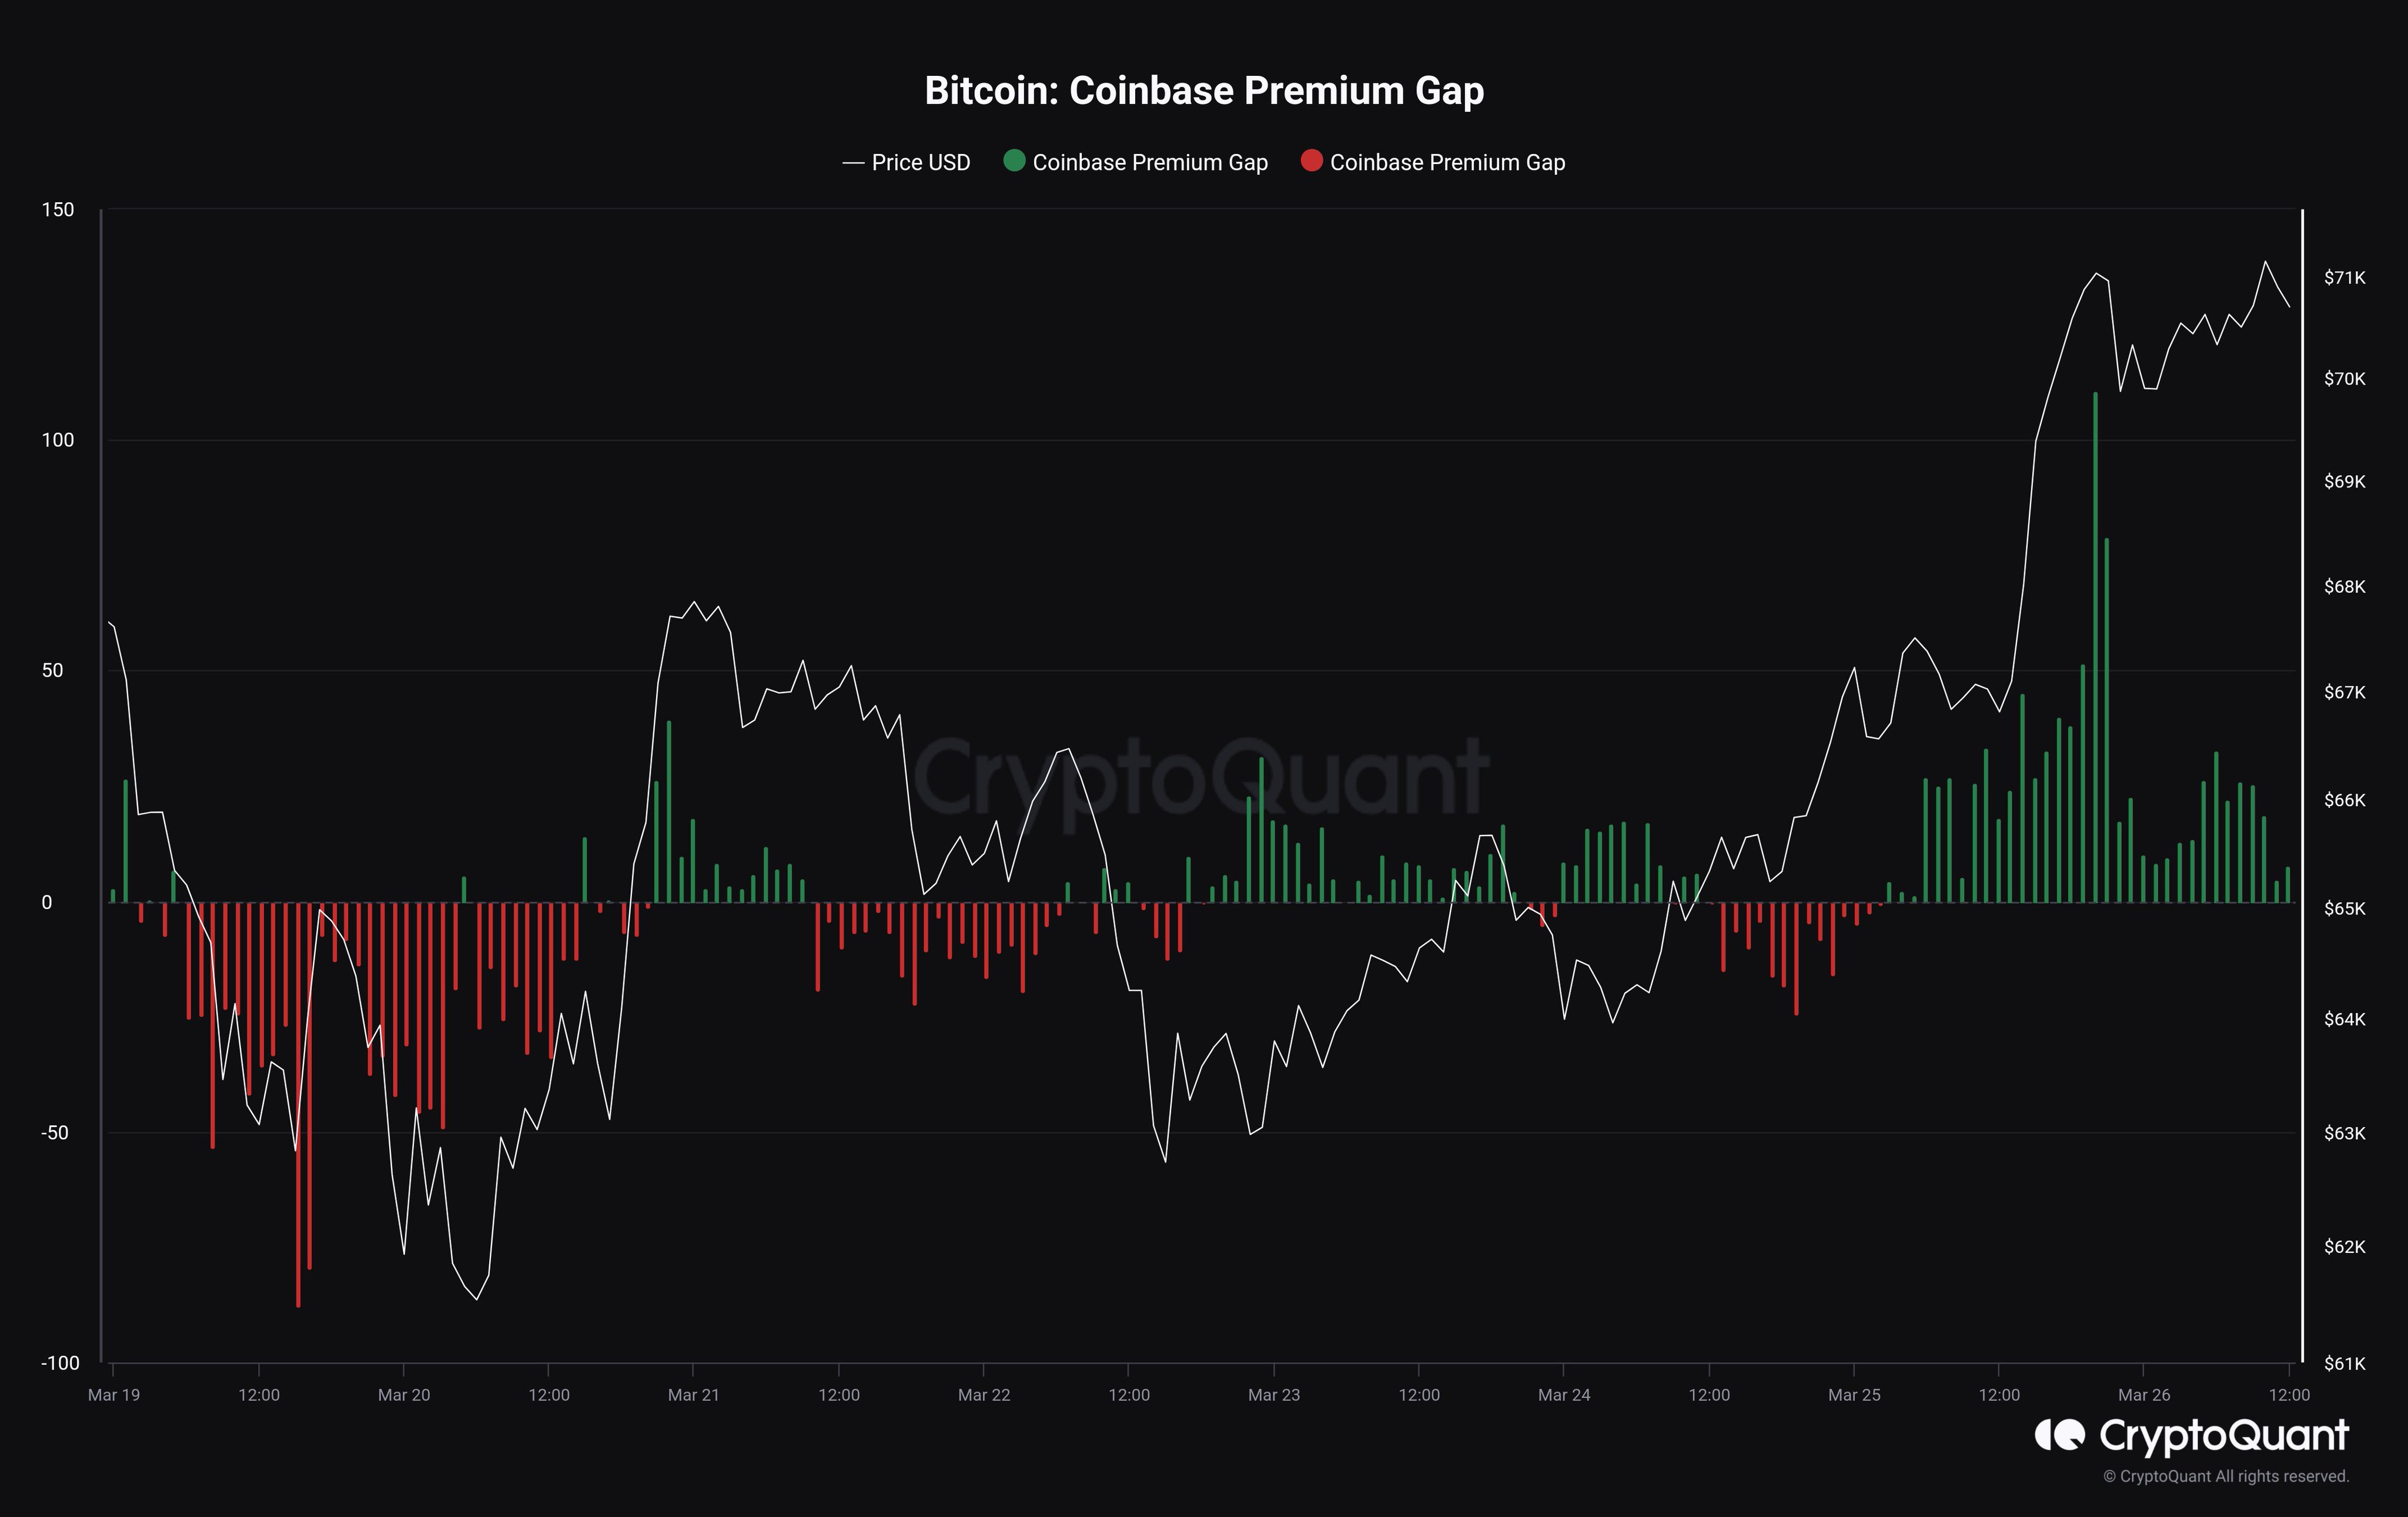
The Coinbase Premium is currently riding a downtrend, but it’s yet to dip into negative territory. The analyst explains that BTC is in a “wait and see” phase, where a rebound might be a bit longer out. The metric has to first decline more and reach a reversal point, at least if the historical pattern has to repeat.

BTC Price

Bitcoin had slipped under $61,000 earlier, but the asset has found a slight rebound in the past day, returning above $62,700.

Bitcoin Price Chart

Bitcoin Coinbase Premium Returns To Neutral: Buying Push Already Over?

The positive Bitcoin Coinbase Premium that drove the latest rally above $70,000 has dissipated, suggesting buying has already slowed down.

Bitcoin Coinbase Premium Gap Has Returned To Neutral Levels

CryptoQuant Netherlands community manager Maartunn explained in a post on X that the Bitcoin Coinbase Premium Gap has declined back toward the neutral line.

The “Coinbase Premium Gap” here refers to a metric that keeps track of the difference between the BTC prices listed on cryptocurrency exchanges Coinbase (USD pair) and Binance (USDT pair).

When the value of this metric is positive, it means that the price listed on Coinbase is greater than that on Binance right now. Such a trend implies that the buying pressure on the former is higher than that on the latter platform (or alternatively, the selling pressure on there is just lower).

On the other hand, a negative value can imply the selling pressure on Coinbase is higher than on Binance as the price of the cryptocurrency listed there is lower.

Now, here is a chart that shows the trend in the Bitcoin Coinbase Premium Gap over the past few days:

Bitcoin Coinbase Premium Gap

The chart shows that the Bitcoin Coinbase Premium Gap had taken to notably positive values as the latest upward push in the asset’s price had occurred. Since then, though, the metric has fallen, with its value approaching zero.

It would seem that the buying pressure on the platform contributed to the surge. The fact that the rally has slowed since the metric returned to neutral levels may add further evidence.

This isn’t unnatural for this year, however, as the Bitcoin price and Coinbase Premium Gap have shown a pretty tight relationship since the start of 2024.

Coinbase is popularly known as the preferred platform of American institutional investors, while Binance hosts more global traffic. As such, the premium’s value provides insight into how the behavior of the US-based large holders differs from that of world users.

Since the Coinbase Premium Gap has been the driver of the recent price surges, buying from these institutional entities could potentially have provided the fuel.

As the indicator’s value has now neared the neutral mark, it would imply that these whales have lifted their foot off the gas. Given the close relationship the metric and BTC price have held recently, it may be worth keeping an eye on how things develop in the coming days.

BTC may register some decline if the premium flips into the red from here. Naturally, a continuation of positive values would be a bullish sign instead.

BTC Price

At the time of writing, Bitcoin is trading around the $70,100 level, up more than 11% over the past week.

Bitcoin Price Chart

Bitcoin Has Undergone This Bearish Structure Change, Analyst Explains

An analyst has explained that the recent trend in the Bitcoin Coinbase Premium Gap suggests a significant change in the asset’s structure.

Bitcoin Coinbase Premium Gap Has Continued To Be Negative

In a new post on X, analyst Maartunn discussed how the Bitcoin Coinbase Premium Gap is still negative. The “Coinbase Premium Gap” here refers to a metric that tracks the difference between the Bitcoin prices listed on cryptocurrency exchanges Coinbase (USD pair) and Binance (USDT pair).

This indicator’s value provides hints about how the behavior of the former’s userbase currently differs from that of the latter platform.

Below is the chart shared by the analyst that reveals the trend in the Bitcoin Coinbase Premium Gap since the start of the year.

Bitcoin Coinbase Premium Gap

As the graph shows, the Bitcoin Coinbase Premium Gap had been mostly positive as Bitcoin had gone through its journey from $44,000 to beyond the $73,000 level.

This would imply that the price listed on the exchange was higher than on Binance during this period. Such a trend naturally suggests that the buying pressure on the former was greater than on the latter.

Coinbase is widely known to be the preferred platform of US-based institutional investors, while Binance has global traffic. Thus, the green positive premium values would imply these large American entities had been buying and supporting the rally.

Recently, however, the indicator’s value turned negative as these investors took to selling instead. Since then, the metric has continued to assume such values. Alongside this selloff, the BTC price has experienced a notable decline.

The Bitcoin Coinbase Premium Gap followed a similar pattern during the first month or so of the year. In the first 10 days of January, the metric had been positive as buying had occurred in anticipation of the spot exchange-traded funds (ETFs). Still, after the ETFs had been approved, the indicator had turned negative.

The red premium values had maintained for a few weeks, during which the cryptocurrency price had struggled. Based on this pattern and the recent trend, it would seem that American institutional traders have driven the price action this year.

As such, so long as the current bearish structure in the Bitcoin Coinbase Premium Gap exists, it’s possible that the price may not be able to amass too much upward momentum.

BTC Price

At the end of the positive Coinbase Premium Gap streak, Bitcoin had been able to achieve a new all-time high above $73,800, but as traders have switched to selling on the platform, the coin has dropped almost 9%, with its price now trading around $67,300.

Bitcoin Price Chart

Bitcoin Coinbase Premium Is Negative: What It Means For Price Recovery

Data shows the Bitcoin Coinbase Premium Gap is currently negative. Here’s what this could mean for the asset’s recent attempt at recovery.

Bitcoin Coinbase Premium Gap Has Been Deep Red Recently

An analyst in a CryptoQuant Quicktake post pointed out that the Coinbase Premium Gap has been negative recently. The “Coinbase Premium Gap” here refers to an indicator that tracks the difference between the Bitcoin prices listed on cryptocurrency exchanges Coinbase (USD pair) and Binance (USDT pair).

When the value of this metric is positive, it means that the price listed on Coinbase is greater than that on Binance right now. Such a trend implies that the former platform is currently witnessing a higher buying pressure or a lower selling pressure than the latter.

On the other hand, the negative indicator suggests Coinbase is witnessing relatively high selling pressure as the price listed here is lower than on Binance.

Now, here is a chart that shows the trend in the Bitcoin Coinbase Premium Gap over the last few years:

Bitcoin Coinbase Premium Gap

As displayed in the above graph, the Bitcoin Coinbase Premium Gap has plunged into negative values recently, implying that the selling pressure on Coinbase has risen.

Earlier, the metric had a notable positive streak, and this run coincided with a rally in the cryptocurrency’s price. The asset fell as the indicator flipped towards red, suggesting increased selling pressure may have contributed.

US-based institutional investors commonly use Coinbase, while Binance has a more global audience. As such, the Premium Gap can provide hints about American whales’ buying or selling behavior.

It would appear that these institutional players were buying during the recent rally, but as soon as they switched towards selling, the price suffered for it. The last bull market also saw significant buying pressure from these investors, while the bear market saw the indicator restricted to negative or neutral levels.

Bitcoin has been trying to recover from its recent drawdown, but from the chart, it’s apparent that the Coinbase Premium Gap is still at deep red values.

Thus, the fact that large American investors are falling behind in buying pressure may not bode well for this recovery attempt if the recent pattern followed by the metric is anything to go by.

BTC Price

Since the visit below the $39,000 level, Bitcoin has seen a notable rebound below the $43,000 mark. The chart below shows how the coin has performed over the past month.

Bitcoin Price Chart

This recovery has stood so far, but given the negative Coinbase Premium Gap, the cryptocurrency may encounter some resistance soon.

Analyst Says “Rapid Price Recovery” Is Likely For Bitcoin, Here’s Why

An analyst has explained that a Bitcoin price recovery may be highly likely based on this pattern forming in a metric.

Bitcoin Coinbase Premium Gap Is Becoming Less Negative

In a CryptoQuant Quicktake post, an analyst pointed out how the selling pressure on Coinbase has been diminishing recently. The relevant indicator here is the “Coinbase Premium Gap,” which keeps track of the difference between the Bitcoin prices listed on cryptocurrency exchanges Coinbase and Binance.

When the value of this metric is positive, it means that the price listed on Coinbase is greater than that on Binance right now. Such a trend suggests either the buying pressure on the former is higher or the selling pressure is lower.

On the other hand, negative values imply the buying pressure on Binance may be greater as the price of the cryptocurrency listed there is higher.

Now, here is a chart that shows the trend in the Bitcoin Coinbase Premium Gap over the last couple of weeks:

Bitcoin Coinbase Premium Gap

Between the start of the month and around the time the Bitcoin spot ETFs went live, the Coinbase Premium Gap had remained optimistic, implying that buying pressure on the exchange had been stronger.

The exchange is popularly known to be used by US institutional investors, so it’s possible that the positive premium was due to these large entities constantly accumulating in the leadup to the ETFs.

The chart reveals that the Coinbase Premium Gap took a sharp plunge into negative territory once this event was over, implying that the American holders significantly increased their selling pressure.

Coinciding with this negative spike, Bitcoin observed its first major post-ETF plunge. This event started the indicator’s extended run inside the red zone, a sharp contrast to its trend in the year thus far.

Almost a week after this first crash, the cryptocurrency registered another sharp plummet, and with this drawdown, too, the selling pressure on Coinbase went up.

During the past few days, BTC has experienced another wave of price drops, but this time, the Coinbase Premium Gap hasn’t reached highly negative values. Instead, the indicator even briefly revisited the neutral mark during this plunge.

This would imply that the selling pressure from the US institutional traders may now be weakening. While they are still likely selling, the degree of their selling isn’t much higher than that of the global investors who use Binance.

“In the current range, there is a high likelihood of a rapid price recovery,” the analyst says, based on this pattern that has taken shape in the Coinbase Premium Gap.

BTC Price

Following the latest drawdown, Bitcoin has broken under the $39,000 level for the first time since the start of December.

Bitcoin Price Chart

Bitcoin Erases $49,000 ETF Rally As Coinbase Users Take To Selling

Bitcoin had earlier shown a sharp rally toward the $49,000 mark, but the asset was quick to retrace the entire surge as the Coinbase Premium turned negative.

Bitcoin Coinbase Premium Gap Plunged Into Negative During Past Day

As pointed out by CryptoQuant Netherlands community manager Maartunn in a post on X, the Coinbase Premium Gap has now turned notably negative after being mostly positive for the last few days.

The “Coinbase Premium Gap” refers to the difference between the Bitcoin prices listed on the cryptocurrency exchanges Coinbase (USD pair) and Binance (USDT pair).

This indicator’s value basically provides hints about how the buying or selling behaviors on these two largest platforms in the sector differ from each other right now.

When the metric has a positive value, it means that the price listed on Coinbase is higher than on Binance currently. Such a trend implies the former platform’s users are participating in a higher amount of buying (or lower amount of selling) than the Binance users.

On the other hand, the indicator being positive suggests that Binance might be observing a higher degree of buying pressure at the moment as the price listed on the exchange is greater.

Now, here is a chart that shows the trend in the Bitcoin Coinbase Premium Gap since the start of the year:

Bitcoin Coinbase Premium Gap

As displayed in the above graph, the Bitcoin Coinbase Premium Gap has observed a sharp plunge down into the negative territory during the past day or so. Before this plummet, the indicator had been mostly at positive values since the start of the year.

There were a few dips into the red zone earlier as well, but the indicator only attained minor negative values during these drops. This time, though, the premium is down to significantly negative levels.

The price surges this year were being driven by the buyers on Coinbase, as the price rose every time the premium did as well. Coinbase is popularly known to be used by US institutional investors, so the green premium suggested that these large entities were buying, most likely in anticipation of the ETFs, which finally gained approval on January 10th.

A while after this approval, BTC went on to sharply rally toward the $49,000 level, but the asset’s run was very short-lived as its price plummeted hard back towards the price prior to the move, thus erasing all the gains.

The Coinbase Premium Gap had been notably positive alongside the surge, but the indicator then showed its plunge into the negative territory alongside this quick retrace. It would appear that some American institutional traders may have used the opportunity to harvest their profits.

BTC Price

Bitcoin has been moving sideways since the quick rally and drawdown, as its price is still floating around the $45,800 level.

Bitcoin Price Chart

Bitcoin Blasts Off As Institutionals Continue Buying On Coinbase

Bitcoin has observed a sharp rally beyond the $47,000 level as data shows buying pressure on Coinbase has displayed no signs of letting off.

Bitcoin Has Surged More Than 4% In Last 24 Hours As ETF Deadline Nears

After the asset’s indecisiveness over the last few days, the cryptocurrency has appeared to have picked its direction in the last 24 hours, as its price has increased sharply.

At the peak of this surge, the coin had crossed beyond the $47,300 mark, but since then, the coin has registered some pullback as it’s now down to $46,500. The below chart shows how Bitcoin has performed during the last few days.

Bitcoin Price Chart

With this surge, the coin is up over 4% in the last 24 hours. The only cryptocurrencies in the top 20 market cap list that have attained better returns during this period are Solana (SOL) and Bitcoin Cash (BCH).

This latest rally to levels not visited since March 2022 has come for the cryptocurrency as the US SEC deadline for a decision on BTC spot ETFs is approaching fast.

With the expectation in the market widely being that the ETFs would get approved, it’s not surprising that buyers may be jumping in, expecting the asset to rally further after the ETFs start trading.

Data of an indicator could also point towards large entities being involved in accumulation in this leadup to the day of decision.

BTC Coinbase Premium Gap Has Been Positive For More Than A Week Now

As CryptoQuant Netherlands community manager Maartunn pointed out in a post on X, the Bitcoin Coinbase Premium Gap has been positive for several consecutive days.

The “Coinbase Premium Gap” refers to a metric that keeps track of the difference between the Bitcoin prices listed on cryptocurrency exchanges Coinbase (USD pair) and Binance (USDT pair).

This indicator’s value tells us about the difference in the buying (or selling) behaviors on the two largest platforms in the sector. Below is a chart showing the recent trend in this metric’s 14-day simple moving average (SMA).

Image

As displayed in the above graph, the Bitcoin Coinbase Premium Gap has been positive for almost 2024, with only one dip in the metric coming on the first day of the year.

This suggests that the buying pressure on Coinbase has been greater than on Binance for over a week now. US-based institutional investors widely use the former, while the latter hosts more global traffic.

Thus, this indicates that large institutional traders have possibly been going shopping recently. Another indicator that suggests accumulation from the whales is the “large holders netflow” metric from IntoTheBlock, which has displayed positive spikes recently.

Bitcoin Large Holders Netflow

“Large holders bought the dip! Bitcoin holders holding >1% of the supply accumulated more than 14k BTC over the past week as prices dipped below $43k,” explains IntoTheBlock.

Bitcoin Coinbase Premium Surges, Recovery Being Driven By US Investors?

Data shows the Bitcoin Coinbase Premium Index has recently seen a surge, a sign that buying from US investors may contribute to the recovery.

Bitcoin Coinbase Premium Index (7-Day SMA) Has Been Going Up Recently

According to data shared by Julio Moreno, the Head of Research at CryptoQuant, the Coinbase Premium Index has been sharply trending up recently. The “Coinbase Premium Index” here refers to a metric that keeps track of the percentage difference between the Bitcoin price listed on Coinbase (USD pair) and that listed on Binance (USDT pair).

This metric can help us know which platform’s user base is buying or selling more of the asset. For example, when the index’s value is greater than zero, it means that an extra amount of buying pressure has been present on Coinbase, which has pushed the asset’s price up on the platform (or just a lower amount of selling pressure than on Binance is there on Coinbase).

Coinbase is known to be used more heavily by US-based investors (especially large institutional traders), while Binance’s traffic is spread around the globe.

Thus, if more buying is happening on Coinbase, it can be a sign that the US-based investors are participating in more buying than the global traders.

Now, here is a chart that shows the trend in the 7-day Simple Moving Average (SMA) Bitcoin Coinbase Premium Index over the past couple of months:

Bitcoin Coinbase Premium Index

As displayed in the above graph, the 7-day SMA Bitcoin Coinbase Premium Index has only been negative this month, implying that the global investors have either outpaced the US traders in accumulation or the Americans have been selling to a higher degree.

Recently, however, as news has started to come out that the probability of the BTC spot ETFs being approved in the US is increasing, the indicator has turned around and is now heading up.

The metric has sharply increased in the past day, suggesting that the US-based institutional traders may now be participating in some heavy buying.

During this same period, Bitcoin has observed a recovery rally in which the cryptocurrency’s price briefly managed to touch the $30,000 mark before falling back to the current levels.

Naturally, the timing of the rally and the 7-day Coinbase Premium Index sharply going up could imply that the buying from the American holders are providing the fuel for the move.

The Grayscale Bitcoin Trust (GBTC) Premium, a metric that checks for whether GBTC is trading at a premium or a discount, has also been trending up recently, implying that the discount on the fund is decreasing (although it’s not near the positive territory yet unlike the Coinbase Premium Index).

Image

GBTC is a fund that allows users to get indirect exposure to Bitcoin in a way that traditional investors would be more familiar with. Thus, this metric holds hints about the buying or selling activity in which the more conventional US institutional traders are currently participating.

BTC Price

At the time of writing, Bitcoin is trading around $29,800, up 1% in the last week.

Bitcoin Price Chart