Is This Cycle’s Bitcoin Bottom In? Analysts Forecast BTC Bounce Back

As May 1st started, Bitcoin (BTC) faced a new correction that made the price stumble under the $60,000 support level. The flagship cryptocurrency has seen several retraces during this bull cycle, with BTC swiftly recovering the crucial support zones each time.

However, in the past 24 hours, the largest cryptocurrency by market capitalization has struggled to regain its momentum. Some analysts believe Bitcoin’s bottom this cycle might be in as this correction officially became its deepest retrace.

Is The Bitcoin Bottom Here?

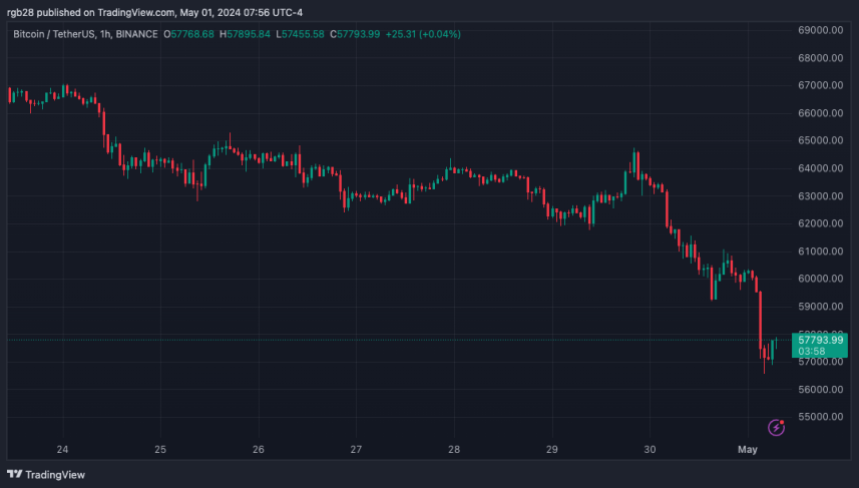
In the early hours of Tuesday, Bitcoin started to plunge from the $64,000 price range. As the day continued, BTC prolonged its fall to briefly trading around $59,958 – $59,191 before recovering.

This time, the recovery didn’t last long as Bitcoin’s price resumed its downward trajectory to $57,000. In an X thread, crypto trader Milkybull examined some data suggesting the bottom might finally be in.

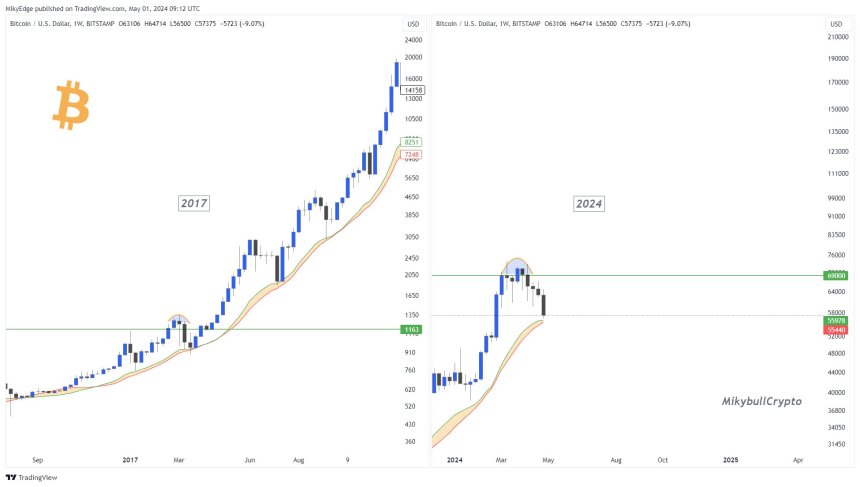
According to the analyst, BTC is “following the 2017 PA.” This would suggest that “either the bottom is in or close.” Moreover, he urged investors to remember that while good news “usually signals the top,” bad news signals a bull market’s bottom.

In the thread, the trader pointed out that the Bitcoin Bull Market Support Band indicator historically serves strong support during BTC’s bull cycles. As a result, he considers that the flagship cryptocurrency might “wick through the support and bounce back.”
Bitcoin, BTC

According to the analyst, Bitcoin and global liquidity are also strongly correlated, with BTC currently at a level it has previously bounced back from. These bouncebacks initiated “huge rallies across the crypto market” in October 2022 and October 2023.

Lastly, the thread highlighted that Bitcoin “is at a critical decision point for the local bottom.” The trader considers that while some call for a $48,000 bottom, the $51,000 support level might be where BTC bounces back to resume its cycle to this cycle’s top.

Bitcoin’s Deepest Retrace This Cycle

According to crypto analyst and trader Rekt Capital, this correction has officially been the deepest BTC retrace this cycle. Per the post, today’s -23.64% retrace surpasses the -22.91% retrace seen in February 2023.

The analyst also compared this cycle’s “Post-Halving” pullback to 2016’s. Moreover, the trader considers that this bullish cycle might be more similar to the 2016 one than investors think.

Previously, Rekt Capital listed three reasons these two cycles might be similar. Per the trader, the resemblances include the “Pre-Halving Re-Accumulation Range Breakout,” the “Pre-Halving Retrace Beginning,” and the “Similar Initial Reaction after the beginning of the Pre-Halving Retrace.”

After today’s retrace, the analyst added the “Continued downside in the three weeks after the Halving” as a fourth similarity between the 2016 and 2024 cycles. Like eight years ago, Bitcoin faces an “additional downside below the Range Low of its Re-Accumulation Range” in the three-week window after Bitcoin’s “Halving.”

Moreover, the analyst suggests that the current price development comes “as no surprise,” as it mirrors 2016’s “post-Halving Danger Zone.”

As of this writing, the flagship cryptocurrency is trading at $57,794.89. This correction represents a 6.2% drop in the past 24 hours. Similarly, BTC is registering 13.4% and 17.7% price decreases in the weekly and monthly timeframes.
BTC, Bitcoin, BTCUSDT

Analysts Bullish On Bitcoin Despite Peter Schiff’s $20,000 Doom Scenario

Over the weekend, the Bitcoin (BTC) crash had the crypto community on its toes. With the price dropping to $60,000, many investors worried that the flagship cryptocurrency was in trouble ahead of the “Halving” event.

Amid the correction, Bitcoin critic Peter Schiff claimed that his previous predictions regarding spot Bitcoin ETFs (exchange-traded funds) were correct and presented the possibility of a doom drop for BTC.

Peter Schiff’s Doomsday Prediction For Bitcoin

Back in March, known Bitcoin opposer Peter Schiff asserted what he thought was the problem with Bitcoin ETFs. According to the economist, the problem with owning these investment products was that liquidity was limited to US market hours, which would mean that investors could not sell if the market crashed overnight.

On Sunday afternoon, Schiff claimed that, as he previously warned, Bitcoin ETF owners would be helpless if the flagship cryptocurrency started selling off that night. BTC traded around $63,460 at the time of his post and recovered in the following hour to trade above the $65,000 support level.

Earlier that day, Schiff had warned of a critical support zone for BTC. To the economist, breaking below $60,000 could “create a formidable triple top.” This trend reversal could lead to an “immediate downside projection” of $20,000.

Following his dooming scenario, Schiff stated that, at that price, MicroStrategy would “have a $2.7 billion unrealized loss on 214K Bitcoin acquired at an average price of $34K.” Additionally, he believes that BTC’s price could increase “before it crashes.”

Analysts Unfazed By BTC’s Correction

Several analysts concurred that the correction was a “minor drop” in the macro picture. According to MacroCRG, Bitcoin’s chart “looks incredible.” The analyst stated: “They threw a full-on war at her and all it managed to do was wick the range low.”

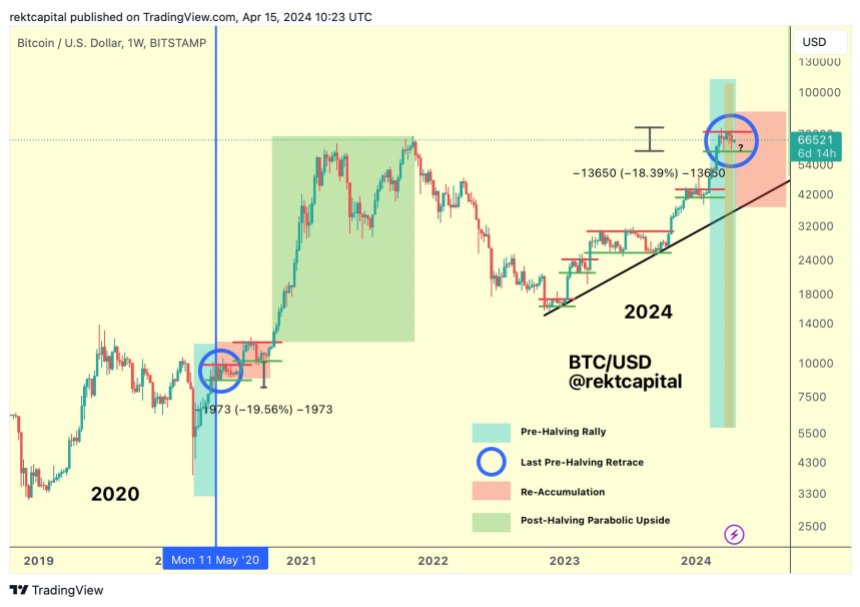
Similarly, trader and analyst Rekt Capital considers that BTC “successfully protected the Range Low of its Re-Accumulation Range as the week of the Bitcoin Halving begins.”

Per the analyst’s chart, Bitcoin is at the “Last Pre-Halving Retrace” during the “Pre-Halving Rally.” If history is to repeat itself, after April 19, BTC will enter the “Re-Accumulation” phase before experiencing the “Post-Halving Parabolic Upside.”

BTC, BTCUSDT, Bitcoin, Crypto

Moreover, Crypto Jelle urged investors to “not get shaken out” as BTC is “consolidating above the previous cycle highs.” The analyst and investor reaffirmed his prediction of $82,000 after the upcoming “Halving” event.

However, Jelle also set a higher target for this bull cycle. The bullish megaphone pattern on BTC’s chart “still has a pattern of $180,000” despite the recent correction, as stated in the post. The analyst claims he wouldn’t be surprised “if the meme pattern plays out once again.”

The correction caused BTC to register bleeding numbers for several periods. The biggest cryptocurrency exhibits an 8.4% and a 3.1% dip in the weekly and monthly timeframes. Similarly, BTC’s market activity has decreased by 32.1% in the past day, with a trading daily volume of $42.56 billion.
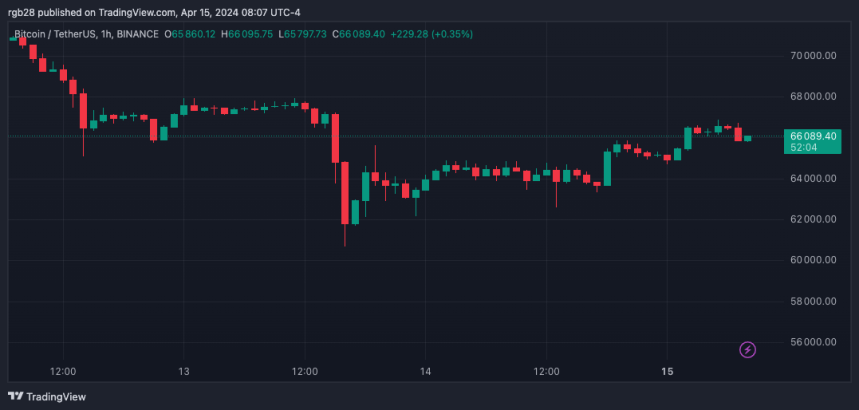
Nonetheless, Bitcoin has recovered 3.5% from its price 24 hours ago, currently trading at $66,275. Since the lowest point of this correction, BTC has surged 10.3%.

BTC, BTCUSDT, Bitcoin

This Bitcoin Indicator Has Hit Levels That Often Lead To Corrections

On-chain data shows a Bitcoin metric has recently hit levels that have historically led to corrections in the cryptocurrency’s price.

Bitcoin Is Currently 40% Above The Cost Basis Of Short-Term Holders

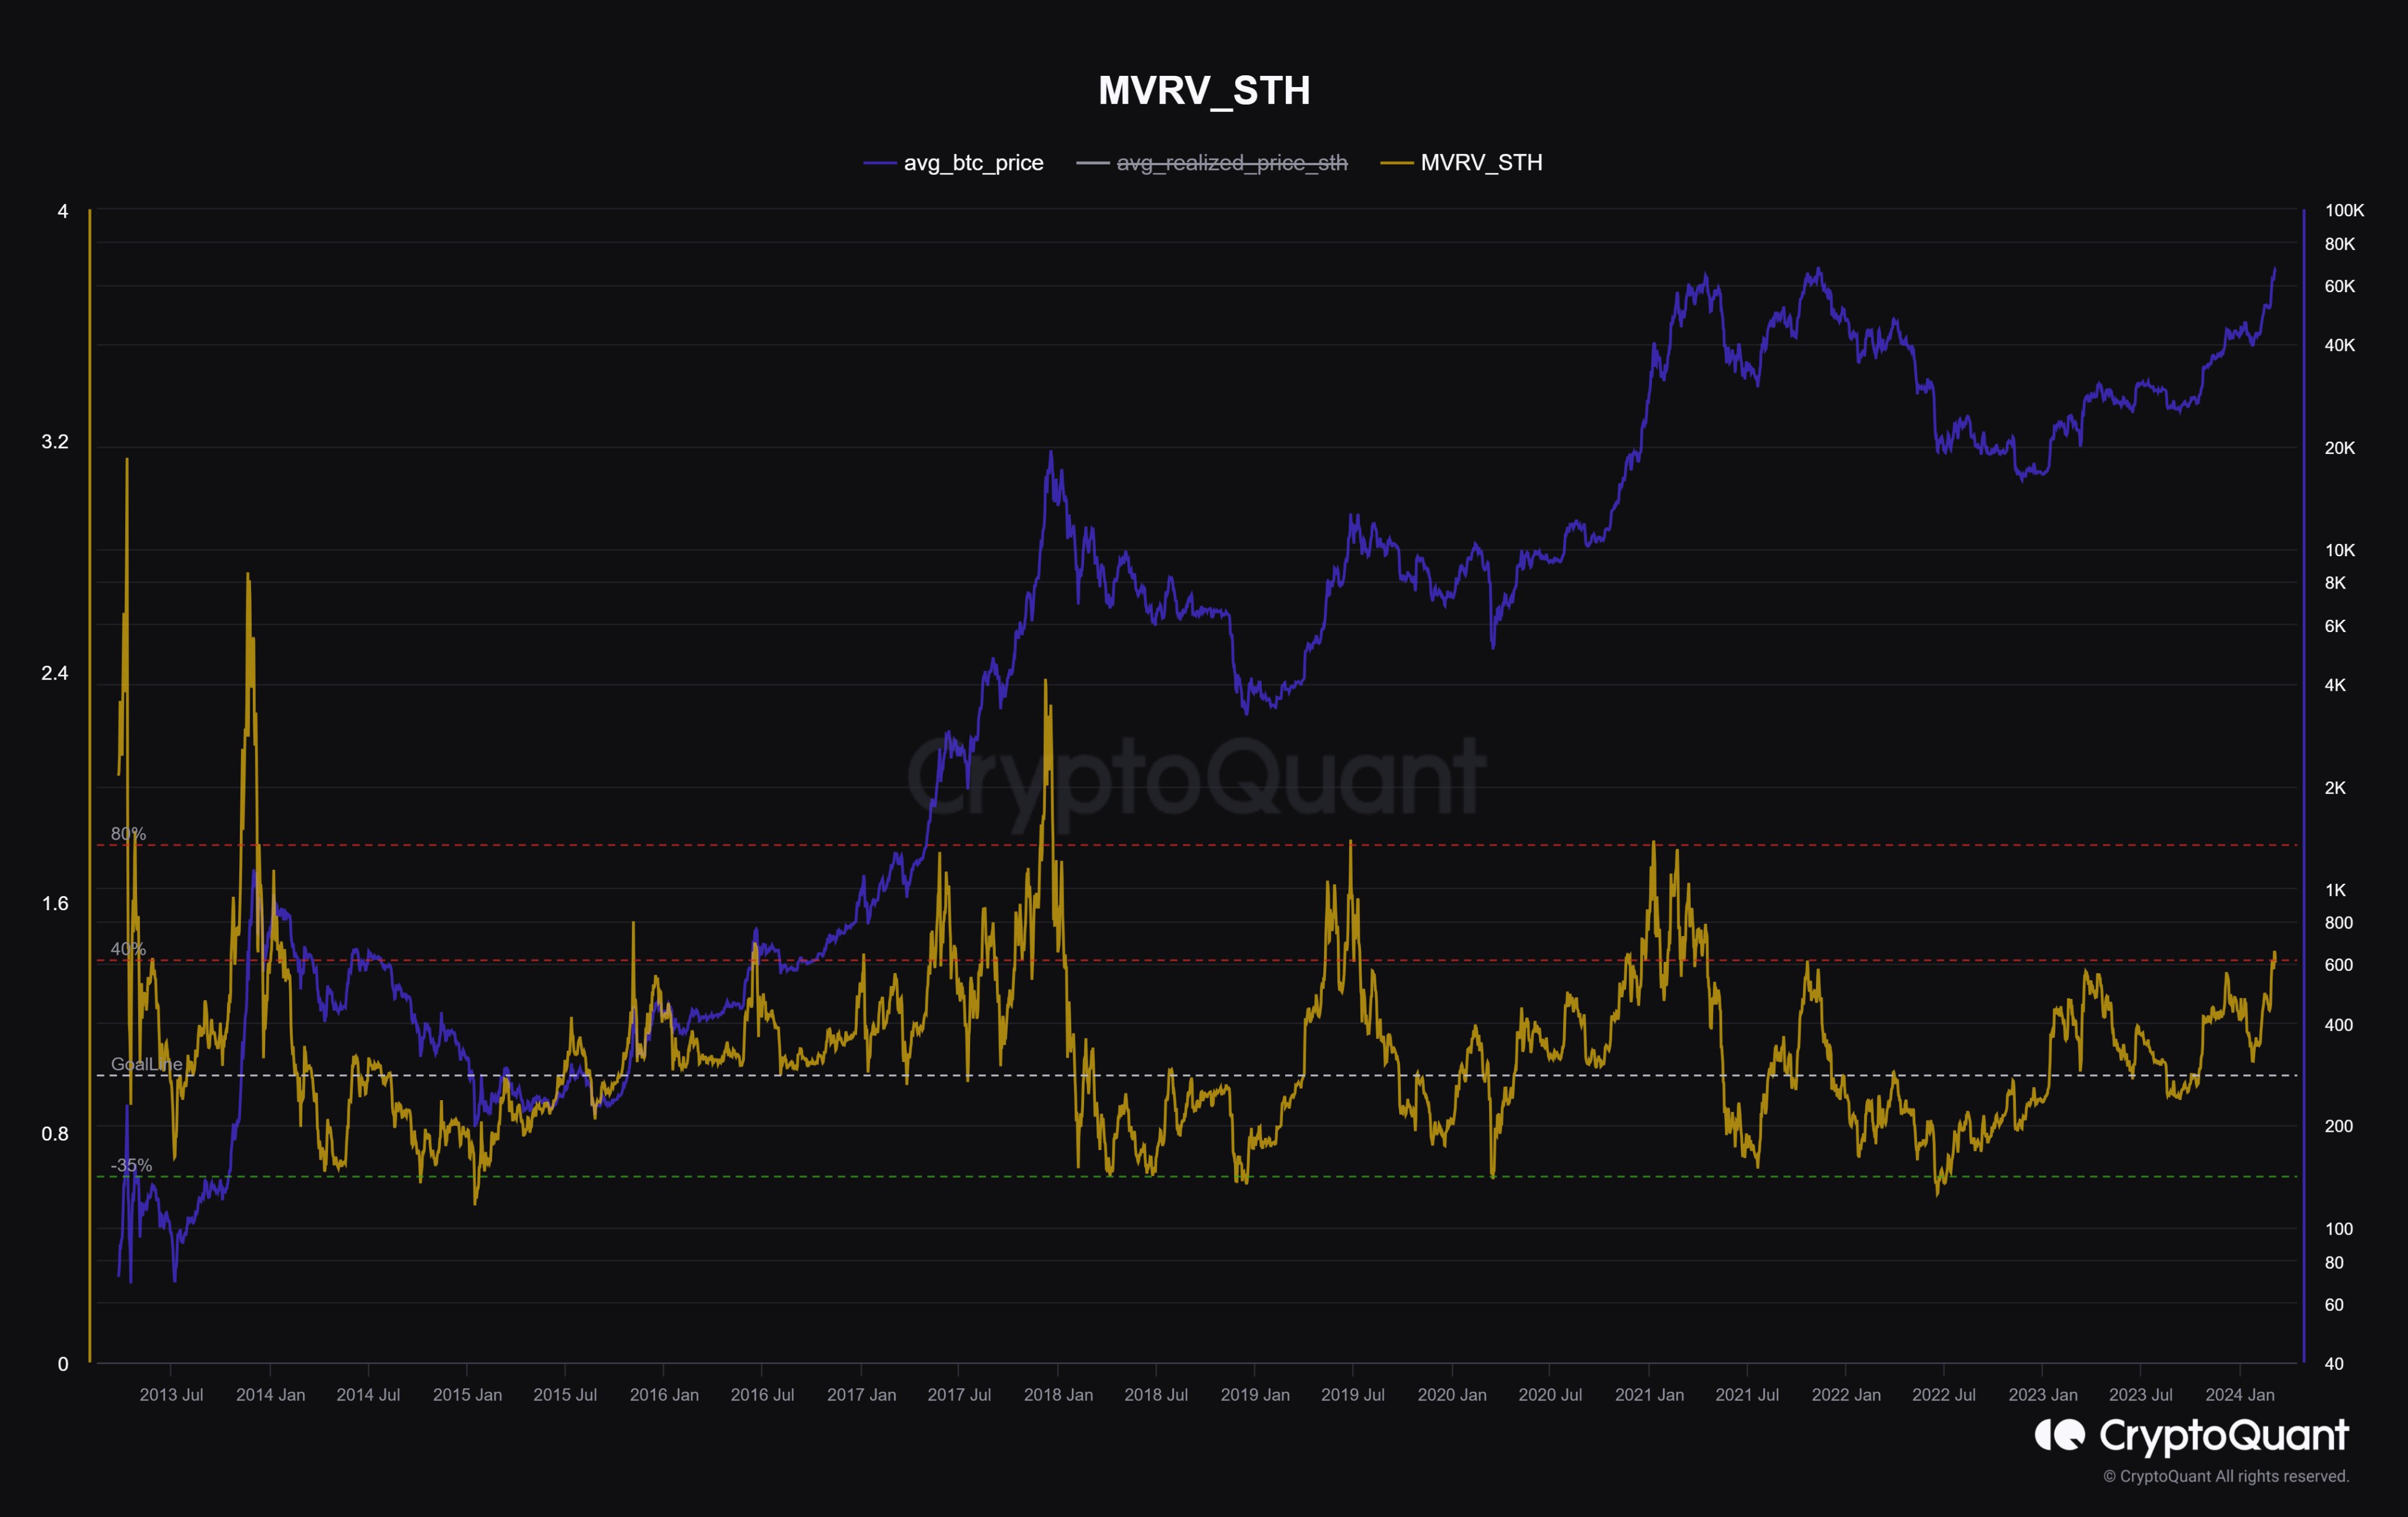
CryptoQuant Netherlands community manager Maartunn explained in a post on X that the BTC price is currently 40% above the cost basis of the short-term holders.

The indicator of interest here is the “Market Value to Realized Value (MVRV) ratio,” which is an indicator that keeps track of the ratio between the Bitcoin market cap and the realized cap.

The “realized cap” refers to a capitalization model for the asset that assumes that the real value of any coin in circulation isn’t equal to the current spot price but rather the price when it was last transacted on the blockchain.

The previous transfer of any coin was likely the last point at which it changed hands, so the price at that time would act as its current cost basis. As such, the realized cap is essentially the sum of the cost basis of the entire supply.

Therefore, the metric’s value can measure the total capital the holders have put into the asset. And since the market cap is the value they are currently carrying, its comparison against the realized cap in the MVRV ratio can tell us about the amount of profits or losses the investors hold.

In the current discussion, the MVRV ratio of the entire market isn’t of interest but rather of a particular segment of it: the “short-term holders” (STHs). The STH cohort includes all investors who bought their coins within the past 155 days.

The below chart shows the trend in the Bitcoin MVRV ratio specifically for these investors over the history of the cryptocurrency:

Bitcoin STH MVRV

As displayed in the above graph, the Bitcoin STH MVRV has been greater than 1 for a while now as the STHs have been carrying net profits, but with the latest rally in the asset, the indicator has shot up to especially high levels.

The BTC spot price has recently been 40% over this cohort’s average cost basis. The chart shows that this same level has led to asset corrections a few times in the past.

Naturally, this doesn’t mean that the coin would necessarily see a correction here, but given the historical pattern, there is a chance one would occur.

The likely reason behind this pattern is that Bitcoin investors are more likely to give in to the allure of profit-taking the larger their profits grow.

BTC Price

Bitcoin has gone through some significant volatility since setting its brand new all-time high above the $69,000 level, with its price now trading around $67,700.

Bitcoin Price Chart

Bitcoin Whales Ramp Up Selling, BTC To Decline Below $32,000?

On-chain data shows the Bitcoin whales have potentially ramped up their selling recently, something that could lead to a drawdown for the asset.

Bitcoin Exchange Whale Ratio Has Spiked Recently

As explained by an analyst in a CryptoQuant Quicktake post, the price of Bitcoin could correct towards the $31,000 to $32,000 range from the current whale selling pressure.

The relevant indicator here is the “exchange whale ratio,” which measures the ratio between the sum of the top 10 transfers to exchanges and the total exchange inflow.

The 10 largest transactions going towards these platforms generally come from the whales, so this ratio can tell us about how the inflow activity of the whales currently compares against the rest of the market.

These humongous investors may transfer their coins to these central entities for a variety of purposes, one of which could be for selling. Thus, whenever the whales occupy a large part of the total exchange inflows, it’s a potential sign that the selling pressure being mounted by this cohort is rising.

Historically, the indicator crossing the 0.90 mark has particularly been bearish for the cryptocurrency. At this level, 90% of the total inflows are coming from the wallets of the whales.

Now, here is a chart that shows the trend in the 72-hour moving average (MA) Bitcoin exchange whale ratio over the past few months:

Bitcoin Exchange Whale Ratio

In the above graph, the quant has marked the 0.90 level in red and has highlighted the points in the Bitcoin price corresponding to the instances where the 72-hour MA exchange whale ratio crossed this line.

The analyst notes that in all of these occurrences, the cryptocurrency first registered some volatility and then observed a decline in the short term, leading toward a local bottom formation.

Given the close timings, it would appear possible that the higher inflows from the whales during these instances were at least partially made for selling purposes.

From the chart, it’s visible that the indicator has once again risen above the 0.90 level recently, suggesting that the whales have considerably ramped up their inflows.

Naturally, these high values of the metrics don’t necessarily have to be bearish for the asset, as it’s possible that this cohort is simply opening up positions on the derivatives market this time (and to some extent, it has to be true in either case, as the futures open interest has seen an increase in the last few days).

Given the pattern that has followed in the last few instances, though, the quant says, “I expect increased volatility in Bitcoin and anticipate a new local bottom with a drop to the 31,000 to 32,000 dollar range, which previously acted as resistance.”

BTC Price

Bitcoin hasn’t been able to find any direction in the last few days as the coin has been consolidating above $34,000. If the exchange whale ratio is anything to go by, though, things might change soon for the asset.

Bitcoin Price Chart

Bitcoin Correction Soon? MVRV Triple Ribbon Approaches Bearish Cross

On-chain data shows the Bitcoin MVRV Ratio Triple Ribbon is approaching a bearish cross, a sign that a correction could be coming soon for the crypto’s price.

Bitcoin MVRV Ratio Triple Ribbon Is Close To Bearish Crossover

As pointed out by an analyst in a CryptoQuant post, the MVRV ratio warns that a new round of decline may be coming for BTC. The “MVRV ratio” is an indicator that measures the ratio between the market cap of Bitcoin and its realized cap. The realized cap is a capitalization model for BTC that calculates a sort of “real value” for the asset by assuming that the true worth of each coin in circulation is the price at which the particular coin was last moved.

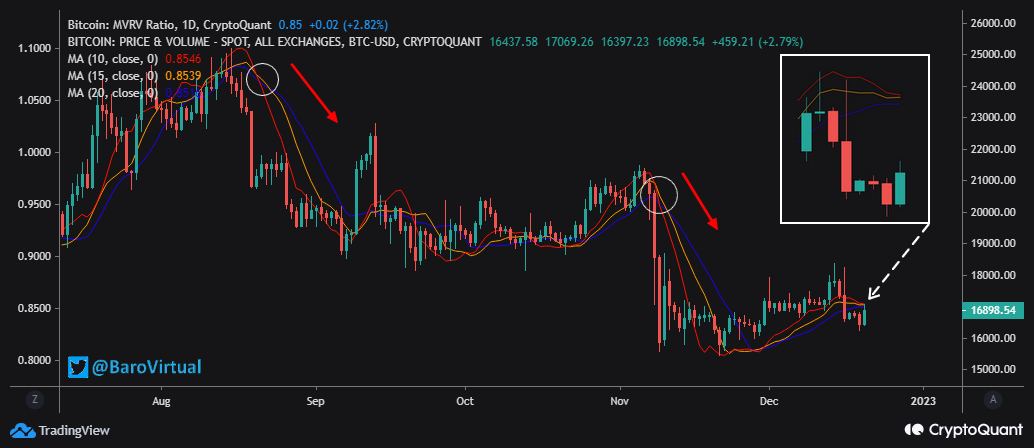
By comparing this realized cap with the market cap, the indicator tells us whether the coin’s actual price is fair or not right now. Here is a chart that shows the trend in three moving averages (10-day, 15-day, and 20-day) of this metric over the last few months:

Bitcoin MVRV Ratio Tripple Ribbon

These three MAs of the Bitcoin MVRV Ratio together form the “Triple Ribbon” indicator, and crossovers between these ribbons have historically had implications for the price of the asset. As you can see in the above graph, whenever the 10-day MA has passed below both the 15-day and the 20-day versions, while at the same time the 20-day has gone above both the others (thus keeping the 15-day’s position unchanged in the middle), a bearish crossover has formed for BTC.

There have been two instances of such a cross during the last few months; the first one occurred back in August when Bitcoin was at the height of its first relief rally of this bear market, while the other one formed in November right as the FTX crash came around. In both of these occurrences, BTC’s price took a deep plunge following the cross formation.

From the chart, it’s apparent that the MVRV Ratio Triple Ribbon has once again been approaching this same kind of bearish crossover recently. If these MAs continue in this trajectory and the cross does end up happening, then it might mean the crypto will see another sharp drop soon.

BTC Price

Bitcoin Price Chart

At the time of writing, Bitcoin’s price floats around $16,800, down 5% in the last week.

ARK Invest CEO Cathie Wood On What Will Drive Bitcoin Correction

The price of bitcoin continues to struggle and investors look towards various indicators to know when the price of the digital asset would begin to correct once again. While some indicators have shown promise in predicting what may yet come, it remains a guessing game as bitcoin has always been known to have a mind of its own when it comes to price movements.

To this end, Cathie Wood, famed CEO of ARK Invest, has shared some interesting thoughts around the market correction and what will drive it. The bitcoin bull continues to look towards the crypto market through a positive lens as she shares what will bring about the market correction.

Related Reading | Bitcoin Discount? Peter Brandt On Why You Shouldn’t Buy The Dip

Crypto Market Succumbs To Strike Against Technology

The whole of the crypto market is built on the back of new technology and as such, will sometimes follow technology trends in the broader market. ARK Invest CEO Cathie Wood posits in a new video on the ARK Invest YouTube channel that this is what is behind the recent crashes.

Basically, there has been a strike against technology, growth, and innovation in the equity markets and the spillover of this strike is what brought down prices across the crypto market. However, the CEO does not expect this strike to last long.

Related Reading | Galaxy Digital CEO Mike Novogratz Says Bitcoin Has Hit The Bottom

Addressing the concerns about technology and innovation stocks being in a bubble, the CEO discounts this theory. Instead, explaining that these stocks are merely in what she refers to as a “deep value territory.”

Wood is known to take risky bets on technology and innovation assets, which have paid off in the long run for her fund, as well as her clients. For the CEO, Bitcoin falls into this territory and has been vocal about her support for the digital asset.

She also predicts a highly profitable future for tech and innovation assets, expecting a 10x growth in the next 10 years.

“Based on the last eight years of our research, the opportunities will scale from $10-12 trillion today, or roughly 10% of the global public equity market cap, to $200+ trillion during the next ten years.”

Where Is Bitcoin Headed?

The new year is now in full swing and the implications of the holiday spending have been showing on the markets. Bitcoin which hit its all-time high of $69K last year has since lost over 30% of its value. The price is not in the $41,000 range, where it continues to struggle as bears try to pull it down.

BTC trading north of $41K | Source: BTCUSD on TradingView.com

For Cathie Wood, it has always been about the long game. Last year, the CEO, at various times, said that she expects the price of bitcoin to grow 10x from its value at the time. She attributes this growth to institutional investors finally moving at least 5% of their portfolios into the digital asset, at which point, bitcoin’s price will grow as high as $500,000 apiece.

Featured image from Page One, chart from TradingView.com

Understanding Bitcoin UTXO: Mid-To-Long Term Holders Responsible For November Correction

Data reveals that mostly mid-to-long term holders were selling their Bitcoin during November, thus being responsible for the correction.

Bitcoin UTXO Age Shows Mid-Term Holders Sold Their Coins In November

As per the latest weekly report from Arcane Research, mid-term holders seem to be behind the decline in BTC’s price during the month of November.

The relevant on-chain indicator here is the “UTXO Age.” UTXO stands for Unspent Transaction Output; you can think of it as a Bitcoin mechanic that keeps track of coins on the chain.

The UTXO age metric measures how long it has been since a coin on the BTC blockchain was last transacted. Based on the amount of time each coin hasn’t been moved for, the corresponding holders can be categorized into short-term holder (STH), mid-term holder (MTH), and long-term holder (LTH).

Arcane Research takes UTXO age shorter than three months as belonging to STH, and longer than one year as LTH. Holders falling in the period in between are termed MTH.

Now, here is a chart that compares how the supply belonging to the different Bitcoin holders moved during the month of November:

Looks like the mid-term supply reduced over the course of the month | Source: The Arcane Research Weekly Update – Week 47

As you can see in the above bar graph, the Bitcoin short-term supply saw significant growth during the period as it went from 14.9% at the start of the month, to 17.2% at the end.

Related Reading | Canada Marks Launch Of First Bitcoin, Ethereum ETFs With Monthly Payouts

This growth suggests that some holders in the longer age bands sold off their coins. From the chart, it’s visible that the MTH supply had a sizeable drop during the month.

This means that most of the increase in the Bitcoin STH supply can be accounted for by the sell-off from mid-term holders.

Also, the one-to-three year supply saw some increase as well. This means that part of the MTH supply matured and entered into this longer age band.

Related Reading | “The United States Is Already Mining” Bitcoin… “Maybe,” Says Compass Mining CEO

The 3-5 year supply also had a slight decrease in November, suggesting that some of these long-term holders reaped their profits, and thus added to the increase in STH supply.

So in conclusion, selling from mostly mid-term holders with some long-term holders may be behind the correction in November.

BTC Price

At the time of writing, Bitcoin’s price floats around $55.5k, up 2% in the last seven days. Over the past month, the crypto has lost 11% in value.

The below chart shows the trend in the price of BTC over the last five days.

BTC’s price has mostly moved sideways in the last few days | Source: BTCUSD on TradingView
Featured image from Unsplash.com, charts from TradingView.com, Arcane Research

Bitcoin Funding Rates Touch Same Level As Early September, More Correction To Come?

Data shows Bitcoin funding rates right now are at the same level as they were in early September. This means the coin may see another flush out similar to how it happened back then.

Bitcoin Funding Rates Float Around Similar Levels To Early September

As per this week’s on-chain report from Glassnode, the BTC futures perpetual funding rate of all exchanges is currently at the level similar to what it was back in early September before the crash.

The “funding rates” is an indicator that shows the premium that traders have to pay each other while holding on to their positions in the perpetual swap futures markets.

When the metric has negative values, it means that short traders are paying longs, and that many traders are bearish on Bitcoin right now.

Opposite to that, positive funding rates imply that the overall market sentiment is leaning towards bullish and longs are currently paying shorts to keep their positions.

Related Reading | BTC Holders Reduce Spending, Why Bitcoin Could Get More Rocket Fuel

Now, here is a chart that highlights the trend in the value of the indicator over the last six months:

Looks like the metric is currently showing highly positive values | Source: Glassnode’s The Week On-Chain, Week 43

As the above graph shows, when Bitcoin made its new all-time high (ATH) some days ago, the indicator reached positive local highs.

This means traders started opening many leveraged long positions so that they don’t miss out on the wave of BTC making new ATHs.

Related Reading | On-Chain Data Shows Surge In Stablecoins Supply Pouring Into Bitcoin

However, the price had a correction, which has often been the case during periods of high leverage, and a lot of the excess leverage was flushed out.

Nonetheless, the funding rates are still at similarly high levels right now as in early September. What followed then was the El Salvador crash that took the rates to negative values.

It’s possible another correction can take place now in order to flush out more of the currently high leverage in the market. Though it’s not a certainty that it will be how it plays out.

BTC Price

At the time of writing, Bitcoin’s price floats around $62.5k, down 0.4% in the last seven days. Over the past month, the crypto has gained 44% in value.

The below chart shows the trend in the price of the crypto over the last five days.

BTC’s price seems to be recovering somewhat from the dip | Source: BTCUSD on TradingView

Over the last few days, Bitcoin has shown some effort to bounce back from the correction, but in the last couple of days, the crypto has only moved rather sideways. If the futures funding rates are anything to go by, the market may be heading towards another correction soon that will wipe out the excess leverage.

Featured image from Unsplash.com, charts from TradingView.com, Glassnode.com

As Bitcoin Breaks $57k, Quant Explains Why It Could See A Pullback Here

As Bitcoin rallies past $57k, Quant explains using on-chain analysis why the cryptocurrency may see a pullback here.

Bitcoin Funding Rate And Futures Open Interest Show Rising Values

As explained by an analyst in a CryptoQuant post, some BTC indicators are showing values that have historically signaled that a correction could be coming soon.

The first metric of relevance is the Bitcoin funding rate, which is defined as the periodic payment that futures contract traders have to pay. Positive values imply most traders are bullish and long traders are paying this fee to short traders.

While negative values mean just the opposite; traders are bearish on Bitcoin and short traders have to pay long traders.

The other indicator is the futures open interest. This metric shows the total number of futures contracts that are open at the end of the trading day.

Here is a chart showing the trend in both these indictors for Bitcoin:

The funding rate and futures open interest vs the BTC price | Source: CryptoQuant

As the above graph shows, both the indicators have been observing a rise in their values recently. The quant has marked instances where similar values were seen on the chart before.

Looks like when such a trend in these metrics has been seen before, a correction has followed soon after.

Related Reading | Bitcoin Eclipses Trillion-Dollar Market Cap on Equity ETF Approval – Crypto Weekly Roundup, October 11, 2021

Also, it seems like both the long-term holders and short-term holders are in profit right now, as the below chart highlights:

The long-term SOPR and the short-term SOPR | Source: CryptoQuant

Both long-term and short-term Investors being in such profit means they are becoming more likely to take some profits at this level.

Related Reading | On-Chain Data Shows Bitcoin Miners Hold Off On Selling Despite BTC Rallying Above $57k

This fact combined with the rising funding rates and futures open interest makes the Quant believe that BTC could see a pullback in the short term soon.

BTC Price

At the time of writing, Bitcoin’s price floats around $56.9k, up 14% in the last seven days. Over the past thirty days, the crypto has gained 24% value.

Here is a chart showing the trend in the price of BTC over the last five days:

Bitcoin’s price shows a strong move up as the coin breaks $57k | Source: BTCUSD on TradingView

BTC has continued its climb up in the last few days as the coin now rallies above $57k. It’s unclear at the moment if the crypto can keep this momentum up, but if the funding rates and futures open interest is anything to go by, the market may be leading to a correction soon. Long term indicators, however, still remain bullish.

Featured image from Unsplash.com, charts from TradingView.com, CryptoQuant.com

Does Surging Crypto Market Greed Point To Another Bitcoin Correction?

Data shows greed in the crypto market is on the rise, a signal that another Bitcoin correction could be coming soon.

Fear And Greed Meter Says Crypto Market Has Turned Greedy

As per the latest report from Arcane Research, the fear and greed meter has started pointing towards greed after showing fear for the past few weeks.

The “fear and greed index” is a Bitcoin indicator that displays the current market sentiment on a meter that goes from zero to hundred.

Values of the metric below fifty mean that the crypto market is currently fearful of the future. Very low values imply extreme fear.

Related Reading | Whales Moving Coins Hints At Bitcoin Maturity As Macro Asset

On the other hand, when the meter points above 50, it means investors have started to become greedy, and very high values mean they are extremely greedy.

Here is a chart showing how the value of the Bitcoin fear and greed index has changed over the last year

Current value of the indicator seems to be 59 | Source: Arcane Research

As the above graph shows, the market sentiment around Bitcoin was that of fear over the last three weeks. The metric’s value has shot up now and currently looks to be at about 59. This shows investors have now turned greedy in the crypto market.

Below is a meter that displays this sentiment:

The fear and greed index points at greed | Source: Arcane Research

Looks like last month, the meter pointed at extreme greed as the indicator’s value was around 79, while last week the values were low at around 25.

Related Reading | Bitcoin Shakes Off Bloody September As Price Breaks $50K, Headed For New All-Time Highs?

Generally, when the market shows extreme fear, investors think of it as a good buying opportunity as BTC price usually appreciates following such periods.

An uptrend in the Bitcoin price, however, is accompanied by greedy sentiment. When the meter starts pointing at extreme greed, it may mean that the market is due for a correction.

BTC Price

At the time of writing, Bitcoin’s price floats around $52.6k, up 25% in the last seven days. Over the last month, the coin has accumulated 2.5% in gains.

Here is a chart showing the trend in the price of the crypto over the last five days:

BTC’s price continues the upwards momentum | Source: BTCUSD on TradingView

Bitcoin has continued a great uptrend the past several days as the coin now approaches a test of the $53k level. But with the fear and greed index starting to point at greedy market sentiment, BTC could be due for a correction soon. Though other factors can also affect the price so it remains to be seen where the trend will go next.