Bitcoin Correlation To Nasdaq Continues To Be Negative: What It Means

Data shows the Bitcoin correlation to the Nasdaq has continued to be negative since December. Here’s what this means for the cryptocurrency.

Bitcoin 60-Day Correlation To Nasdaq 100 Is Negative Right Now

In a new post on X, the analytics firm Kaiko has discussed what the trend in the correlation between BTC and Nasdaq has looked like recently. The “correlation” here refers to a metric that keeps track of how tied together the prices of two commodities have been over a given period.

This period can naturally be of any length, but in the context of the current topic, the 60-day correlation is of interest. This indicator version measures the prices’ dependence on each other during the past two months.

When the value of this metric is greater than zero, it means that the price of one asset has been reacting to the other by moving in the same direction. The closer the indicator is to one, the stronger this relationship.

On the other hand, values under zero suggest some correlation between the two assets, but it has been a negative one. This means that the assets have reacted to each other by moving in the opposite direction. In this case, the extreme point is -1, so the closer the indicator is to this mark, the stronger the correlation between the prices.

Lastly, the correlation being exactly zero implies that there is no correlation whatsoever between the two assets. In mathematics, such a condition occurs when two variables are independent.

Now, here is a chart that shows the trend in the 60-day correlation between Bitcoin and Nasdaq 100 over the past year:

Bitcoin Correlation With Nasdaq 100

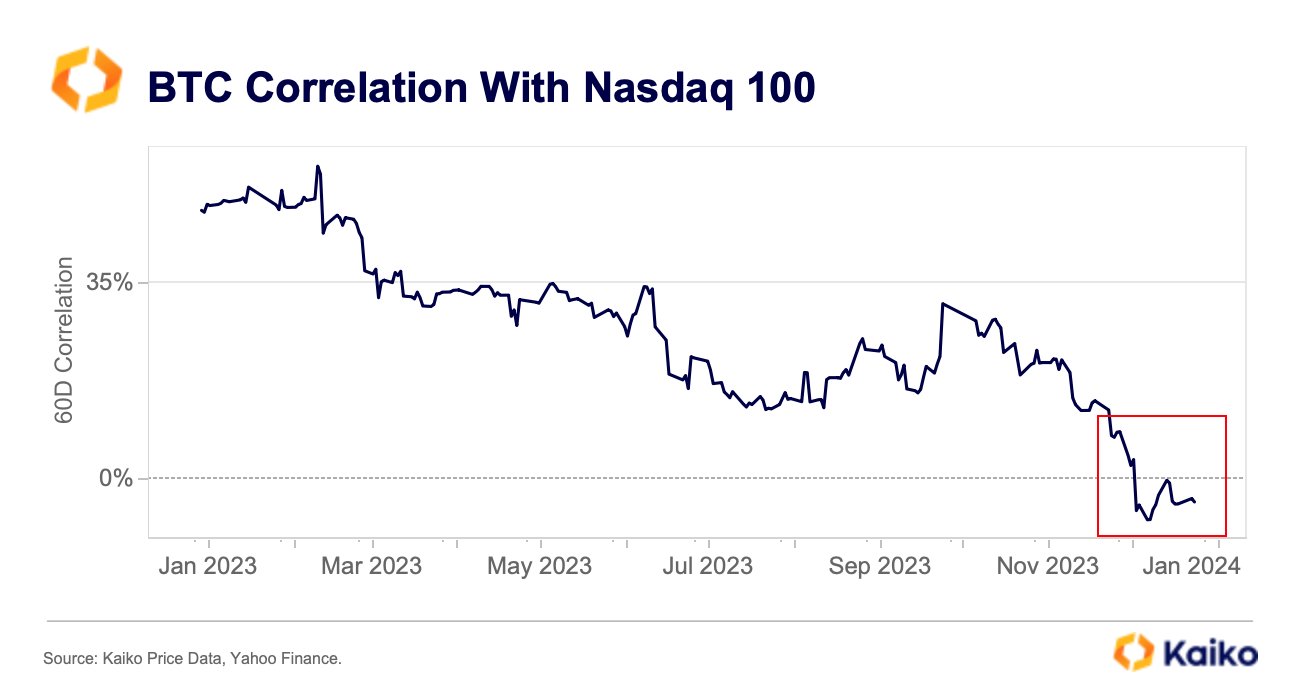
As the above graph shows, the 60-day correlation between Bitcoin and Nasdaq is shown in percentage here, with 100% corresponding to a value of 1.

From the chart, it’s apparent that the metric’s value was in a state of overall gradual decline during 2023, up until the final couple of months of the year, when the metric took an especially sharp dive.

Some amount of positive correlation had existed between the two assets before this plummet, but following it, the 60-day correlation took to negative values. However, the indicator remained close to the 0% mark, implying that the two only had a slight negative relationship.

The correlation had started surging and reached almost exactly 0% for a brief period just earlier, but the metric has since again come down and assumed slight negative values.

It would appear that BTC has kicked off 2024 slightly, moving against the traditional markets, which could set the stage for the cryptocurrency to go on and explore its territories this year.

BTC Price

At the time of writing, Bitcoin is trading around the $44,800 mark, up over 5% over the past week.

Bitcoin Price Chart

XRP, BNB Among Altcoins Losing Correlation With Bitcoin: Data

Data shows altcoins have been losing correlation with Bitcoin recently, and among them, XRP and BNB have seen particularly pronounced decoupling.

XRP & BNB Have Seen Largest Drops In 60-Day Correlation To Bitcoin

As pointed out by an analyst in a post on X, BTC has recently seen a drop in correlation with the altcoins. The “correlation” here refers to an indicator that keeps track of how tied the prices of any two assets are right now.

When the value of this metric is positive, it means that the given assets respond to moves in each other’s price by moving in the same direction. The closer the indicator’s value is to 100%, the stronger this correlation is.

On the other hand, negative values imply that there is a negative correlation between the assets, as their prices are moving opposite to each other. In this case, the extreme is -100%, so the more negative the value, the more tight the relationship is.

The 0% mark represents the point where no correlation exists between the prices, implying that movements in one have no bearing on how the other might perform.

Now, here is a chart that shows what the 60-day correlation between Bitcoin’s daily log returns and various altcoins looks like right now, as well as how it compared a year back:

Bitcoin Correlation To XRP

As displayed in the above graph, the 60-day correlation between Bitcoin and XRP appears to have significantly decreased in this period, as it has plunged from nearly 80% to almost 40%. This means that XRP’s price has been moving much more independently of BTC during the past 60 days.

BNB (BNB), Avalanche (AVAX), and Solana (SOL) have also seen some decoupling from the original cryptocurrency. Still, these alts have seen the indicator decline by much less than XRP has observed.

Cardano (ADA) and Dogecoin (DOGE) are the altcoins that have observed the least amount of change. However, in the case of the memecoin the correlation was lesser than the other assets to begin with, so even with the small decoupling, its correlation level is still matching that of BNB.

Generally, correlation is something to watch for whenever an investor is trying to diversify their portfolio, as two assets with significant correlation wouldn’t provide much safety.

Thus, as XRP is currently the cryptocurrency least correlated with Bitcoin on this list, it might be a better diversification option than coins like Ethereum (ETH) or Polygon (MATIC), which have the 60-day value of the indicator at relatively high levels still.

XRP Price

Just a few days back, XRP had revisited the territory above the $0.63 mark, but it wasn’t long before it slipped again and went under the $0.60 level. Since this low, though, the cryptocurrency has seen some recovery, as it has now neared $0.61 once again.

XRP Price Chart

Bitcoin Moves Differently From US Stock Market, Correlation Weakening?

Data shows while Bitcoin has been correlated with the US stock market for some time now, the two haven’t moved in tandem recently.

Bitcoin Correlation With US Stocks May Be Weakening As BTC Has Been Moving Differently

As pointed out by an analyst in a CryptoQuant post, BTC has gone down in the past week while stocks have made some gains.

A “correlation” between two assets (or markets) exists when both their prices follow the same general trend over a period of time.

For Bitcoin, there has been a strong correlation with the US stock market during the last couple of years or so. The reason behind the markets becoming so tied is the rise of institutional investors in the crypto.

Such investors view BTC as a risk asset and pull out of the coin as soon as there is macro uncertainty looming over the market (hence driving the crypto’s price down along with the stocks).

Here is a chart that shows the prices of Bitcoin, S&P 500, and NASDAQ over the last few years:

Bitcoin Stock Market Correlation

Looks like the assets have followed similar trends in recent times | Source: CryptoQuant

As you can see in the above graph, Bitcoin wasn’t correlated with the stock market in 2019 and early 2020, but it all changed when COVID struck.

After the black swan crash that occurred in March 2020, the price of BTC started following S&P 500 and NASDAQ.

Though, while BTC showed a same general long-term trend, the crypto continued to be much more highly volatile than the stocks.

The correlation has continued through the bear market, but the last week or so has turned out different.

While the US stock market has seen some uplift in the past 7 days, Bitcoin has instead taken a sharp plummet.

These markets showing different behavior recently could suggest the correlation between them may be reducing.

With the latest plunge, BTC has also lost the support line of the previous all-time high, something that has never happened in the previous cycles.

The quant in the post notes that this recent trend is a sign of weakness in the crypto market, which could lead to further downtrend in the near future.

BTC Price

At the time of writing, Bitcoin’s price floats around $16.5k, down 20% in the last week. Over the past month, the crypto has lost 15% in value.

The below chart shows the trend in the price of the coin over the last five days.

Bitcoin Price Chart

The value of the crypto seems to have remained below $17k in recent days | Source: BTCUSD on TradingView
Featured image from André François McKenzie on Unsplash.com, charts from TradingView.com, CryptoQuant.com

Bitcoin Sets Record For Largest Single Day Pump After One Year

Bitcoin recorded its largest single-day pump in a year as the Russian ruble tanked 20% in its value against the dollar amidst worldwide economic sanctions imposed in the country after their attack on Ukraine.

Sanctions Pump Bitcoin

The most influential countries in the world have imposed penalties on Russia aiming for its economic collapse to stop Putin’s efforts to invade Ukraine. However, it is not only politicians who are threatened by penalties but common citizens.

State Duma deputy from the Communist Party Nikolai Arefiev commented to a local news portal that savings of Russians could be confiscated by the Russian government:

“If all funds that are abroad are blocked, then the government will have no other choice but to seize all the deposits of the population – there are about 60 trillion rubles – in order to get out of the situation.”

Both Russians and Ukrainians have recorded enormous increases in crypto trading volume as they run to use it as a safe haven for their savings and wealth and a financial tool that allows them to take their money abroad or avoid sanctions.

Similarly, bitcoin also became a valuable tool to send donations to Ukrainian efforts. The cryptocurrencies that have recorded the highest trading volumes in the countries have been bitcoin and tether.

Bitcoin’s original narrative seems to be winning amongst the people who need it and so, its price has increased while recording other historical marks.

Related Reading | Bitcoin Soared 20% In Two Session With Crypto Demand As Haven

The Pump

As per Arcane Research data, the bitcoin price increased 14.5% on Monday, its largest pump since February 8th, 2021, when the crypto coin reacted positively being shot up to an ATH after Elon Musk announced Tesla had bought $1.5 billion in bitcoin.

Furthermore, data shows that the digital coin was back at providing better returns after a rough month. Bitcoin’s 7-day volatility increased to 5.4%, its highest mark since June 2021. Arcane Research notes this proves that the digital coin “behaves opposite of the rest of the financial markets concerning volatility, as upwards price movements often cause the most significant volatility spikes.”

Source: Arcane Research Weekly Report

Similarly, many were already used to the possible correlation between bitcoin and tech stocks, but that correlation has decoupled as bitcoin price increased 5% during the past day while equity stocks closed at lower prices. Bitcoin use case as a store of value might be making a return to the markets.

Before Monday’s big pump, bitcoin trading volume reached over $10 billion last Thursday as a reaction to Russia’s attack on Ukraine. This is the highest level reached since December 4th.

Related Reading | Bitcoin Breaks Above 50-Day SMA, Will BTC Ride It Out To $50,000?

BTC Price

Arcane data further noted that the digital coin has returned to its $40-44k trading range and the resistance level of $44,000, found during early February’s rally, is an important mark since the coin has yet to convincingly break through that resistance.

Data suggests that if BTC breaks through $44k again, then “$47,000 is the next resistance area to pay attention to.”

Meanwhile, bitcoin was slightly up in the last 24 hours. At the time of writing the digital coin’s price is $43,894.

Bitcoin trading at $43,894 in the daily chart | Source: BTCUSD on TradingView.com