Why This Crypto Bull Run Might Not Live Up To The Past: Analyst

In a detailed analysis shared with his 788,000 followers on X (formerly Twitter), renowned analyst Pentoshi has forecasted a more restrained outlook for the current crypto bull run, suggesting that it may not mirror the explosive growth seen in previous cycles. His insights provide a deep dive into the underlying factors that could temper the market’s performance.

Why Crypto Investors Have To Expect Diminishing Returns

Pentoshi began his analysis by stating, “This cycle should have the largest diminishing returns of any cycle,” attributing this prediction to several key market conditions. Primarily, he noted that the base market capitalization for cryptocurrencies has increased significantly in each successive cycle, setting a higher starting point that makes further exponential growth increasingly challenging.

“Each cycle has set a floor about 10x the previous lows in terms of market cap,” Pentoshi explained. He provided a historical context, recounting that when he entered the crypto market in 2017, the market cap for altcoins was only around $12-15 billion, a figure that ballooned to over $1 trillion during peak periods. He argued, “That growth isn’t repeatable,” pointing out that the decentralized finance (DeFi) sector, which was then nascent, played a significant role in driving previous cycles’ exceptional returns.

Another significant factor Pentoshi highlighted is the dramatic increase in the number of altcoins and the corresponding market dilution. “Today, however, there are a lot more alts, and a lot more dilution,” he remarked, indicating that the proliferation of new tokens spreads investment thinner across the market, reducing the potential for individual tokens to achieve substantial price increases.

Pentoshi also touched upon the demographic shifts in crypto ownership. He contrasted the early days of crypto adoption, when approximately 2% of Americans were involved in the market, to the present, where over 25% of Americans have some form of crypto investment. “It just requires more capital to move the markets, and there will continue to be a lot more alts, spreading it out further,” he noted, emphasizing the logistical and financial challenges of replicating past growth rates in a much more saturated market.

An often-overlooked aspect of market dynamics, according to Pentoshi, is the role of token liquidity and its impact on price stability. He detailed that recently, tokens amounting to about $250 million were unlocked daily, though not necessarily sold. “Assuming they all got sold, that is the inflows you’d need just to keep prices stable for 24 hours,” he explained, highlighting the delicate balance required to maintain current market levels, let alone drive prices upward.

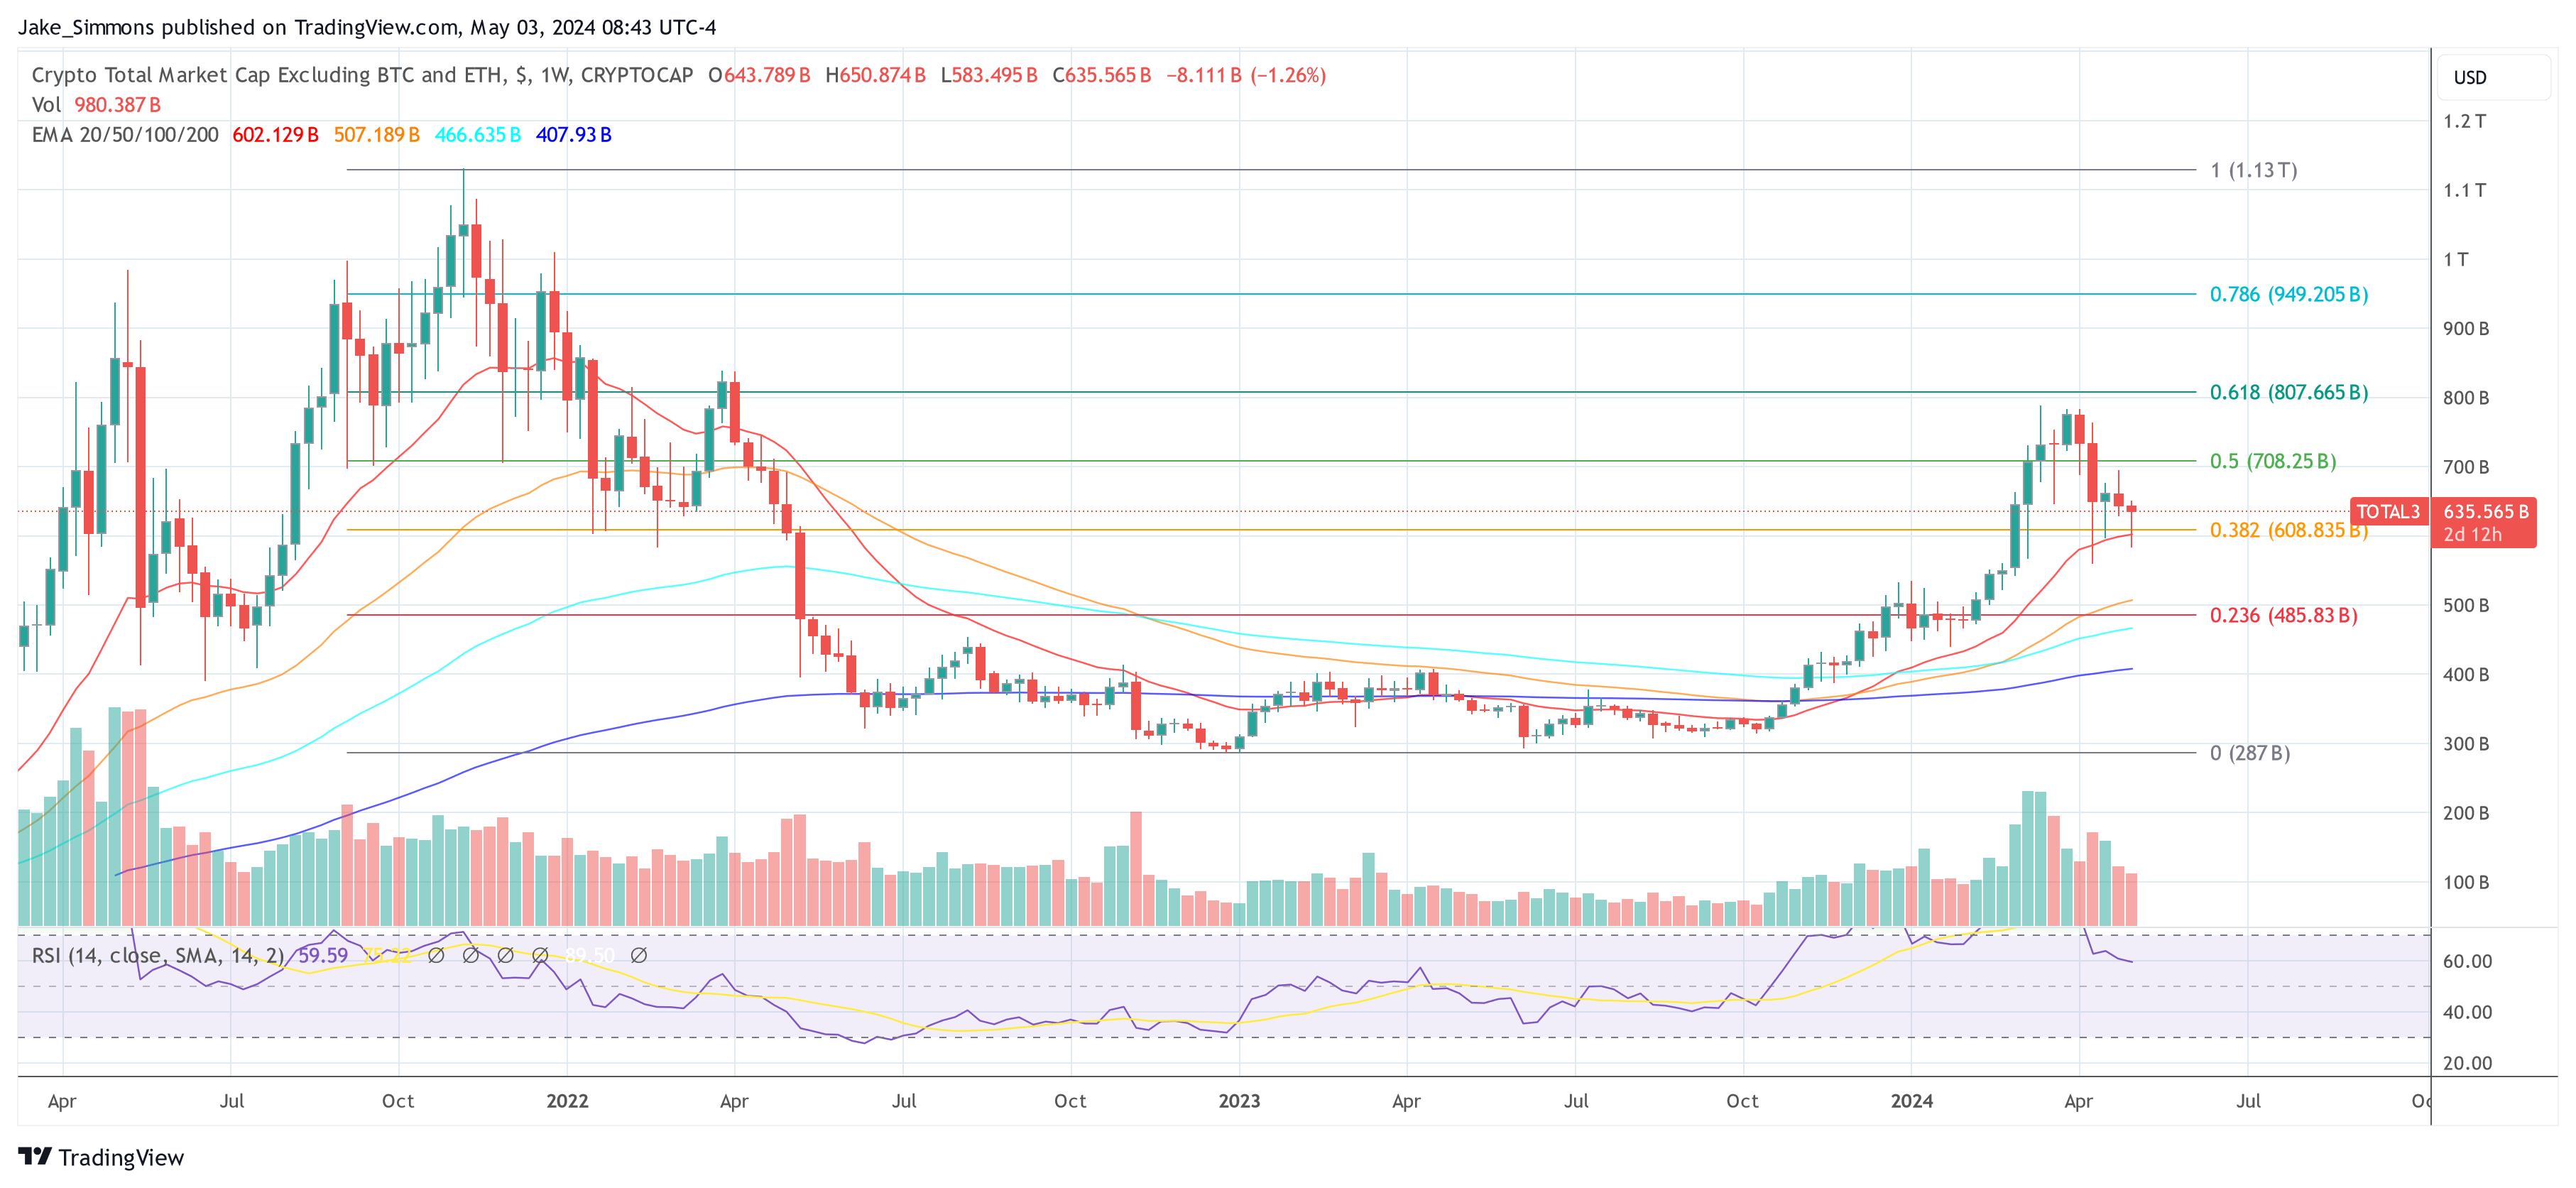
Looking forward, Pentoshi was conservative in his expectations for the Total3 index, which tracks the top 125 altcoins (excludes Bitcoin and Ethereum). He estimated, “My best guess is that this cycle we don’t see Total 3 go 2x past the 21′ cycle ATH. So 2.2T max for Total3.” This projection underscores his broader thesis that while the market continues to offer daily opportunities, the era of “easy, outsized gains” might be behind us.

Pentoshi concluded his analysis with advice for investors, suggesting a more cautious approach to market participation. “If you believe the cycle is 50% over, you should be taking out more than you are putting in and building up some cash and buying other assets with lower risk in the meantime,” he advised, stressing the importance of securing gains and diversifying holdings to mitigate risk.

Reflecting on the psychological aspects of investing, he added, “Most people never really learn. Because if you can’t control your greed, and defeat it, you are destined to give back your gains repeatedly.” His parting words were a reminder of the cyclical and often predatory nature of financial markets, urging investors to secure profits and protect themselves from foreseeable downturns.

At press time, TOTAL3 stood at $635.565 billion, which is still more than -43 % below the last cycle high.

crypto TOTAL3

Bitcoin Whales Showing Different Behavior From Past Cycles, But Why?

On-chain data suggests the Bitcoin whales have been showing different behavior regarding exchange inflows from the last cycle. Here’s why this may be so.

Bitcoin Whales Are Showing Different Behavior In Exchange Inflows This Time

As an analyst explained in a CryptoQuant Quicktake post, the BTC whales’ movements have been different this time compared to the previous cycle.

The indicator of interest here is the “exchange inflow,” which tracks the total amount of Bitcoin being transferred to wallets attached to all centralized exchanges. In the context of the current discussion, derivative platforms are specifically of interest.

When this metric’s value is high, it means that investors are depositing large amounts on these exchanges. Such a trend usually suggests a high demand for the services these derivative exchanges provide.

Generally, extraordinary spikes in the indicator are associated with whale movements, given that only these humongous holders can cause such large shifts.

On the other hand, when the metric has a low value, it suggests that the whales aren’t depositing anything significant to these platforms, a possible sign that they don’t want to take risks on the derivative side.

Now, here is the chart shared by the quant, which shows the data for the Bitcoin exchange inflow for derivative exchanges:

Bitcoin Exchange Inflow

The indicator in the above graph also has another condition attached: it only tracks the inflows coming from the whales that had been holding for at least 1 month and at most 3 months.

These would be the newbie whales in the market, but not quite so new that they have only bought (those with a holding time of less than 1 month). Restricting this time range also excludes the data of the traders who make a high amount of moves in short timeframes on average.

As the analyst has highlighted in the chart, the whales in this group have usually made large inflows to derivative platforms around notable cryptocurrency tops and bottoms, when speculation is at its height.

Interestingly, though, the cryptocurrency has witnessed no such large inflow spikes this year even though the asset has broken past the previous all-time high (ATH).

One explanation may be that the whales are not interested in making any real moves right now. However, a more likely reason may be that spot exchange-traded funds (ETFs) exist now.

The spot ETFs hold Bitcoin on behalf of their customers and let them gain indirect exposure to the cryptocurrency in a way familiar to conventional investors.

The ETFs have brought significant demand into the asset and have quickly become an important part of the market. It’s possible that, with this new investment vehicle, the usual cryptocurrency exchanges no longer have the same relevance for the asset.

This could be why the pattern that held during the previous BTC cycle has seemingly disappeared from the current one.

BTC Price

At the time of writing, Bitcoin is trading at around $66,100, down more than 8% over the past week.

Bitcoin Price Chart

Bitcoin 2 Months Through “Euphoria Wave,” How Long Was The Last One?

On-chain data shows Bitcoin has been going through a “euphoria wave” for two months. Here’s how long it was in this phase during the last bull run.

Bitcoin Has Been In Euphoria Wave Phase According To Supply In Profit

According to the latest weekly report from the on-chain analytics firm Glassnode, the current BTC cycle is similar to the last one regarding the “Supply Profitability State.”

This indicator is based on the “Percent Supply in Profit,” which keeps track of the percentage of the total circulating Bitcoin supply that’s currently carrying a profit.

This metric works by going through the on-chain history of each coin in circulation to see the price at which it was last transferred. Assuming that this last transaction was the last point at which it changed hands, the price at its time would reflect the coin’s current cost basis.

Naturally, if this cost basis is lower in value than the current spot price of the cryptocurrency, then the coin in question carries some net unrealized gain. The Percent Supply in Profit adds up all such coins and calculates what percentage of the supply they make up for.

The supply Profitability State signals BTC’s current phase based on the market’s profitability status. The chart below shows the trend in this indicator over the past few years.

Bitcoin Supply In Profit

In the chart, the analytics firm has highlighted three important lines for the Bitcoin Percent Supply in Profit. The middle line (colored in blue) represents the cumulative mean of the metric, while the other two signify +1 (green) and -1 (red) standard deviation (SD) from this mean.

When the Bitcoin Percent Supply in Profit is above the +1SD (approximately 95% of the supply being in the green), the market may be considered to be in the euphoria or pre-euphoria phase.

Similarly, the Supply Profitability State would indicate a bottom discovery phase for values less than -1SD. The zone between these two corresponds to the “bear/bull transition” phase.

From the chart, it’s visible that during the last bull run, Bitcoin first saw a 1.5-month-long pre-euphoria wave, during which the metric tested the +1SD line. The asset followed up with a period of decline and consolidation, which put the Supply In Profit back under the +1 SD mark.

Finally, the coin observed a sharp rally, broke past the +1SD barrier, and went on to achieve new all-time highs, which naturally set the Supply In Profit to 100%.

Bitcoin seems to have witnessed a similar pattern this time around. A two-month-long pre-euphoria phase was followed by a drawdown, which has now been succeeded by a two-month-long euphoria wave during which the cryptocurrency has achieved new records.

If the euphoria wave lasts for a period similar to the last bull run, then four or more months might still be left for this Bitcoin bull rally.

BTC Price

Bitcoin had recovered above $72,000 earlier, but it appears that the asset has retraced back towards the $69,400 level.

Bitcoin Price Chart

Where Are We In This Bitcoin Cycle? Galaxy Lead Researcher Answers

In a comprehensive analysis shared via X (formerly Twitter), Alex Thorn, the Head of Firmwide Research at Galaxy, delved into the intricacies of the current Bitcoin market cycle, answering the question “Where Are We In This Bitcoin Cycle?” As Bitcoin trades robustly around $62,000, with a notable spike to $64.000 yesterday, the crypto landscape is witnessing unprecedented dynamics, marked by a surge in ETF inflows, strategic acquisitions by corporate entities, and a palpable shift in investor sentiment towards digital assets.

Thorn emphasized how different this cycle is:

Effectively, the bull runs of 2017 and 2020 hadn’t yet begun at this stage in Bitcoin’s supply schedule.

52 days before 2nd Halving (9-JUL-16) BTCUSD $455.22 (-59.86% from ATH)
52 days before 3rd Halving (11-MAY-20) BTCUSD $6,174 (-68.56% from ATH)
52 days before 4th Halving (20-APR-24) BTCUSD $59,330 (-12.16% from ATH)

Why This Bitcoin Cycle Is Different

Central to his analysis is the record-breaking influx of capital into spot Bitcoin ETFs, with Thorn highlighting, “The BTC ETFs took in a whopping net $576m of BTC yesterday (Tuesday Feb. 27), with BlackRock alone seeing $520m of inflows, its largest ever day.” This significant movement of funds not only underscores the growing institutional interest in Bitcoin but also marks a pivotal moment in the cryptocurrency’s journey towards mainstream financial recognition.

A key aspect of Thorn’s analysis is the unwavering strength of Bitcoin’s long-term holder base, which he estimates to hold about 75% of the total BTC supply. “Long-term holders are still mostly holding strong,” Thorn notes, emphasizing the community’s resilience and faith in Bitcoin’s long-term value proposition. This demographic, characterized by their ‘diamond hands’, plays a crucial role in stabilizing the market and buffering against the volatility that often defines the crypto space.

Bitcoin HODLers

Thorn further elaborates on the analytical tools and metrics that provide insight into Bitcoin’s market behavior. He introduces the MVRV Z-Score, a novel approach to understanding the cyclicality of Bitcoin’s price action by comparing its market value to its realized value. This metric offers a window into the perceived overvaluation or undervaluation of Bitcoin at any given point. Currently, the MVRV Z-Score is close to 2, while previous cycle tops saw the metric spike to 8 (in 2021) or even above 12 (in prior halving cycles).

Bitcoin MVRV Z-Score

Addressing the speculation around the acceleration of the Bitcoin cycle, Thorn firmly dispels concerns that the market is prematurely peaking. He argues against the notion that we are “speedrunning the ‘cycle’”, instead asserting that the advent of Bitcoin ETFs in the United States represents a transformative shift with far-reaching implications. “This time is different,” Thorn asserts, pointing to the ETFs’ disruption of traditional Bitcoin price cycles and their impact on investor behavior and intra-crypto dynamics.

The Spot Bitcoin ETF Effect

Thorn underscored the transformative impact of Bitcoin ETFs, positing that we are merely at the beginning of a significant shift in how Bitcoin is accessed and invested in, particularly by the institutional sector. “Despite incredible volumes and flows, there’s plenty of reason to believe that the Bitcoin ETF story is still just getting started,” he stated, pointing to the untapped potential within the wealth management sector.

In their October 2023 report titled “Sizing the Market for the Bitcoin ETF,” Galaxy laid out a compelling case for the future growth of Bitcoin ETFs. The report highlights that wealth managers and financial advisors represent the primary net new accessible market for these vehicles, offering a previously unavailable avenue for allocating client capital to BTC exposure.

The magnitude of this untapped market is substantial. According to Galaxy’s research, there is approximately $40 trillion of assets under management (AUM) across banks and broker/dealers that has yet to activate access to spot BTC ETFs. This includes $27.1 trillion managed by broker-dealers, $11.9 trillion by banks, and $9.3 trillion by registered investment advisors, cumulating to a total US Wealth Management AUM of $48.3 trillion as of October 2023. This data underscores the vast potential for Bitcoin ETFs to penetrate deeper into the financial ecosystem, catalyzing a new wave of investment flows into Bitcoin.

Thorn further speculated on the upcoming April round of post-ETF-launch 13F filings, suggesting that these filings might reveal significant Bitcoin allocations by some of the largest names in the investment world. “In April, we will also get the first round of post-ETF-launch 13F filings, and (I’m just guessing here…) we are likely to see some huge names have allocated to Bitcoin,” Thorn anticipated. This development, he argues, could create a feedback loop where new platforms and investments drive higher prices, which in turn attracts more investment.

The implications of this feedback loop are profound. As more wealth management platforms begin to offer access to Bitcoin ETFs, the influx of new capital could significantly impact BTC’s price dynamics, liquidity, and overall market structure. This transition represents a key moment in the maturation of Bitcoin as an asset class, moving from a speculative investment to a staple in diversified portfolios managed by financial advisors and wealth managers.

We Are Still Early

Thorn’s optimism extends beyond the immediate market indicators to the broader implications of Bitcoin’s integration into the financial mainstream. He anticipates a new all-time high for Bitcoin in the near term, fueled by a combination of factors including the ETFs’ momentum, increasing acceptance of BTC as a legitimate asset class, and the anticipatory buzz surrounding the upcoming halving event. “All this is to say, my answer to that burning question – where are we in the cycle? – is that we haven’t even begun to reach the heights this is likely to go,” he concludes.

Thorn’s analysis culminates in a bullish forecast for Bitcoin. As the community stands on the cusp of the fourth BTC halving, Thorn’s insights offer a compelling vision of a market poised for unprecedented growth, driven by a confluence of technological innovation, regulatory evolution, and shifting global economic currents. “Bitcoin is prime time now, and while it might be hard to believe, things are just starting to get exciting,” Thorn declares, capturing the essence of a market at the threshold of a new era.

At press time, BTC traded at $62,065.

Bitcoin price

Bitcoin Top: This Is When Bull Run Will Peak According To Past Pattern

An analyst has explained when the next Bitcoin bull run peak might appear, if the same pattern as in previous cycles repeats this time as well.

This Is What Previous Bitcoin Cycles Suggest Regarding Bull Run Top

In a new post on X, analyst Ali has discussed about how the last two Bitcoin bull runs line up against each other and what it could mean for the current cycle of the cryptocurrency.

To make the comparison, the analyst has cited a chart that shows the price trend in each of the cycles with the cyclical bottoms being the common start-point for all of them.

Bitcoin Bull Run

From the graph, it’s visible that the peaks of the last two Bitcoin bull runs took shape at roughly the same amount of time since the bottoms of the respective cycles.

For the current cycle, the low that followed the FTX collapse in 2022 has been chosen as the bottom. If the current cycle is lined up against these other two starting from this bottom, then it would still have roughly 600 days before it reaches the same point as when the last couple of bull runs hit their tops.

“If Bitcoin mirrors past bull runs (2015-2018 & 2018-2022) from their respective market bottoms, projections suggest the next market peak could land around October 2025,” says Ali. “This implies BTC still has 600 days of bullish momentum ahead!”

BTC Has Been At Risk Of Slipping Below A Historical Line Recently

While BTC may have a bullish outlook for the long term, its short-term price trend has been painful for investors, as the cryptocurrency has seen a notable drawdown since the spot ETFs found approval from the US SEC.

The cryptocurrency had earlier even slipped down towards the $38,500 mark before making some recovery back around the $40,000 level that it’s still trading around.

Bitcoin Price Chart

In this latest plunge, Bitcoin came dangerously close to retesting the “short-term holder realized price,” a level that has been significant for the asset throughout history.

The “realized price” is a metric that keeps track of the price at which the average investor in the Bitcoin market acquired their coins. The spot price being above this value naturally implies the average holder in the sector is carrying profits, while it being under the line implies the dominance of losses.

As Ali has pointed out in another X post, the “short-term holder” group will find themselves underwater if the cryptocurrency’s price slips under the $38,130 level.

Bitcoin Short-Term Holder Realized Price

Short-term holders (STHs) refer to the Bitcoin investors who purchased their coins within the last 155 days. At the moment, their realized price stands at the $38,125 level. Historically, a sustained break below this line has often meant an extended stay for the coin below it.

So far, BTC has avoided a retest of this line, but if the current correction continues, it might even slip under it. “This potential BTC dip might trigger a new wave of panic selling as these holders will seek to minimize losses,” explains the analyst.

Coinbase Expects A Repeat Of 2018-2022 Bitcoin Cycle, What This Means For Crypto

Crypto exchange Coinbase, one of the largest exchanges in the world, has released its latest report on Bitcoin and the crypto market, highlighting its expectations for the Industry. The 44-page report launched by Coinbase Institutional in conjunction with Glassnode predicts a repeat of one of the most explosive bull markets in recorded crypto history; the 2018-2022 market cycle.

Coinbase Says Bitcoin Will Repeat 2018-2022 Cycle

In the report, Coinbase and Glassnode analysts take into account a number of indicators and metrics, such as total supply in profit, among others, to figure out which trend the next bull market is expected to follow. Now, after consideration and comparison to all of the previous bull cycles, the analysts settle on the 2018-2022 cycle being the most likely to be emulated this time around.

So far, Bitcoin and Ethereum are the cryptocurrencies that have shown the most correlation at the start of the 2018-2022 cycles, suggesting that a similar breakout could be in the cards. However, looking at the chart, it shows a sharp deviation from the previous cycles, especially as the bull market looks to be starting earlier than it did in 2020.

When it comes to the level of risk associated with assets such as Bitcoin and Ethereum, the report highlights the fact that crypto has deviated from traditional assets once again. This comes after the correlation between crypto and traditional finance markets rose to new all-time highs back in 2022. But as Coinbase explains, “2023 saw a reversion to historical norms, indicating that crypto can be a source of idiosyncratic risk.”

As another Bitcoin halving event draws near, Bitcoin has also seen a resumption in its surge, spurred forward by expectations of a Spot Bitcoin ETF. Coinbase notes that “As crypto has matured as an asset class and institutional participation has increased, volatility has trended steadily lower.”

Bitcoin price chart from Tradingview.com

What Happens If BTC Price Repeats 2018-2022 Cycle?

Looking back at the last bull cycle shows us what to expect if Bitcoin and the crypto market at large were to repeat the same trend. In this case, expectations would be that the BTC price would rise at least 3x higher than its previous all-time high price of $69,000.

In this case, Bitcoin would be looking at a value of at least $200,000 by the time the next bull market is in full swing. Following the 3.6x move that Bitcoin did to reach its new 2021 all-time high versus its 2018 all-time high, the BTC price would be looking at a cycle peak of almost $250,000.

As for Ethereum, following the same trend and doing a 3.2x from its previous all-time high to its new all-time high, it would put the ETH price above $15,000. In the same vein, the crypto market would also rise more than $10 trillion.

However, all of this is speculation as the crypto market has been known to deviate from expectations. Like the previous bull markets, the next one is expected to be novel, especially given the fact that institutional investors have fully come out to play. This could mean hundreds of billions of dollars in liquidity injections that could drive prices higher than expected.

Stanford MBA Explains Why Next Bitcoin Cycle Could Be “Bigger”

A Stanford MBA has explained why the current Bitcoin cycle was different from the others, and why the next one could end up being bigger.

This Bitcoin Cycle Faced Obstacles That May Not Be There Next Time

A “cycle” for Bitcoin refers to the period between two consecutive halvings. The halvings, events where the rewards miners receive for solving blocks on the network are permanently slashed in half, are chosen as the start and end points for the cycles due to the immense significance they hold for the cryptocurrency.

The rewards miners earn are essentially the only way new supply can be introduced into circulation, so since halvings cut these in half, the production rate of the asset itself gets tightened.

Because of basic supply-demand dynamics, Bitcoin’s post-halving scarcity increases the asset’s valuation. It’s not a coincidence that the bull markets have always followed these special events.

The halvings occur roughly every four years, with the next one being scheduled for next year. As BTC transitions towards a new cycle, Jesse Myers, a Stanford MBA, has released a new post that looks back at this cycle so far and compares it with the previous cycles.

At first sight, one difference becomes immediately clear: the structure of the top during this past bull market wasn’t anything like what the previous cycles displayed.

Bitcoin Halving Cycles

“Instead of a parabolic advance culminating in a blow-off top, we got a bi-modal rounded top spread out over six months,” notes Myers. So, why did the BTC price behave differently during this bull market?

Well, there are mainly four factors at play here. The first and undoubtedly the biggest one would be COVID-19 and the US government’s response to it. The onset of the virus and the black swan crash that came with it just preceded the cycle, meaning that the cycle kicked off in anomalous conditions.

During the cycle itself, the Fed was giving out stimulus checks as a way to mitigate the economic impacts of COVID. “That Quantitative Easing (QE) undoubtedly helped fuel the 2021 Bitcoin bull market,” explains the Stanford MBA.

The problem came, however, when the Fed changed its policy and switched to Quantitative Tightening (QT). Interestingly, this switch appears to be what marked the Bitcoin top in November 2021.

In the middle of all this, another factor was also at play: the May 2021 China ban on Bitcoin mining. Back then, China was the biggest hub of cryptocurrency mining, so the ban naturally delivered a significant shock to the sector.

The resulting selling pressure crashed the market, leading to the bull rally prematurely halting. It wasn’t until three months later that bullish winds once again returned for the asset.

While these factors have been quite influential for BTC, it’s apparent that they are unlikely to repeat, meaning they shouldn’t have any presence in the next cycle.

On the contrary, the other two factors that made this cycle different are likely to appear in the next cycle as well. This previous bull market was the first one where investors widely used leveraged futures trading. Probably, leverage would again come into play in the next bull market.

Lastly, there is the fact that platforms like FTX issue a lot of “paper Bitcoin.” Supply equivalent to 25% of the mined BTC that year was owned by FTX’s customers, but this BTC didn’t exist; it was only there on “paper.” The analyst believes that such fudging will likely be present during the upcoming cycle.

While there had been some developments in this cycle that ultimately shortened the bull market, some changes can be favorable for the next cycle.

The Bitcoin supply is quickly moving off exchanges, and the HODLers getting hold of the majority of the supply has often been making the news recently. Still, there is another super exciting factor.

Bitcoin Shrimps And Fish

According to this chart from Glassnode, the relatively small entities on the network (holding less than 100 BTC) have been accumulating 275% of all Bitcoin being mined.

The fact that this rate is more than 100% suggests that the smaller investors are taking coins off the likes of whales. “This has never happened before. We have reached some kind of inflection point,” says Mjers.

Soon the halving will occur, and this supply shock brewing in the market will only get tighter. Perhaps the smaller investors are looking to get in before this happens.

Mjers mentions, however, that these individuals aren’t the only ones catching on; asset managers like Blackrock are also coming around and pushing to get themselves into the industry.

As mentioned before, the QT policy proved disastrous for BTC in this cycle, but a shift back towards QE may be imminent, which would naturally boost the market instead. The analyst thinks this event might coincide with the upcoming halving of the cryptocurrency.

Now, based on all these factors, these are probabilities that Mjers has assigned to the different price range predictions for the next cycle:

Bitcoin Predictions

The Stanford MBA believes that a growth of more than 8x, a multiplier higher than what the current cycle saw, is the second most probable scenario, given all the potentially positive developments.

A cycle outperforming the previous has never happened in the cryptocurrency’s history, so if this scenario happens, it would be a first.

BTC Price

At the time of writing, Bitcoin is trading around $29,300, down 2% in the last week.

Bitcoin Price Chart

Bitcoin Might Be Going Through Its “Most Challenging” Cycle Based On This Metric

The current Bitcoin cycle might be its “most challenging” one yet if the drawdown in this on-chain metric is anything to go by.

Total Amount Held By 1k-10k BTC Value Band Has Sharply Gone Down Recently

As pointed out by an analyst in a CryptoQuant post, the latest drawdown in the holdings of the 1k-10k BTC value band is the most drastic in the history of the crypto. The relevant indicator here is the “UTXO Value Bands,” which tells us the total amount of coins each value band is holding in the market.

UTXOs are divided into these “value bands” or groups based on their current value. For instance, the 100-1k BTC value band includes all UTXOs carrying between 100 and 1,000 coins. Here, the relevant UTXO value band is the 1k-10k BTC range, a historically important cohort as usually only the whales have wallets with UTXO amounts so large.

Now, the below chart displays the trend in the total holdings of this value band over the last five years:

Bitcoin UTXO Value Band

The graph shows that the total number of coins held by this Bitcoin UTXO value band has seen a sharp drop this year. In all, the drawdown has amounted to 453,205.04 BTC being dumped by this cohort since the peak observed in June 2022.

For comparison, in the 2018/19 bear market, the 1k-10k BTC value band saw a total drawdown of 324,868.65 BTC from the high. During the COVID black swan crash of 2020, the group also distributed a significant amount, shedding 186,928.48 from its holdings.

And in the bull run during the first half of last year, these whales reduced their holdings by 407,457.14 BTC between the peak in February and the July bottom. The latest drawdown in the metric’s value is the sharpest that Bitcoin has seen yet. Because of this fact, the quant exclaims the current cycle to be the “most challenging” one in the history of the asset so far.

An interesting pattern can also be seen in the chart; whenever the 1k-10k BTC has finished with the distribution and started accumulating again, Bitcoin has felt a bullish impact. “Generally, the market can only recover when this cohort has enough confidence to accumulate again,” explains the analyst. “And at the moment, we still not get any positive signals from this cohort.”

BTC Price

At the time of writing, Bitcoin’s price floats around $16,600, down 1% in the last week.

Bitcoin Price Chart