Bitcoin Forms Death Cross & TD-9 Sell Signal: Brace For Impact?

An analyst has explained how Bitcoin is forming both a death cross and TD sell signal, which may lead to potential dips in these targets.

Bitcoin Looking In Trouble As 12-Hour Chart Forms Two Bearish Signals

In a new post on X, analyst Ali discussed two signals that have recently formed in Bitcoin’s 12-hour chart. The first of these is a “death cross,” which occurs when an asset’s short-term simple moving average (SMA) dips below its long-term SMA.

Regarding the death cross, the 50-day and 100-day SMAs make up for the short-term and long-term trend lines. Historically, such formations have been considered bearish signals, with the price potentially suffering once the pattern is confirmed.

The other signal that has appeared for the cryptocurrency involves the Tom Demark (TD) Sequential. This indicator is popularly used for finding locations of probable tops and bottoms in any asset’s price.

The TD Sequential has two phases: the “setup” and “countdown.” The first phase, the setup, is said to be complete once the asset has gone through nine candles of the same polarity. After these nine candles, the price may have reached a likely reversal point.

Naturally, if the candles in the setup’s formation were red, then the signal would be a buy one, while if the prevailing trend were bullish, the reversal would be towards the downside.

Once the setup is complete, the countdown phase begins. This phase works much like the setup, except that candles are counted up to thirteen instead of nine. After the countdown’s completion, the commodity may be assumed to have reached another potential top/bottom.

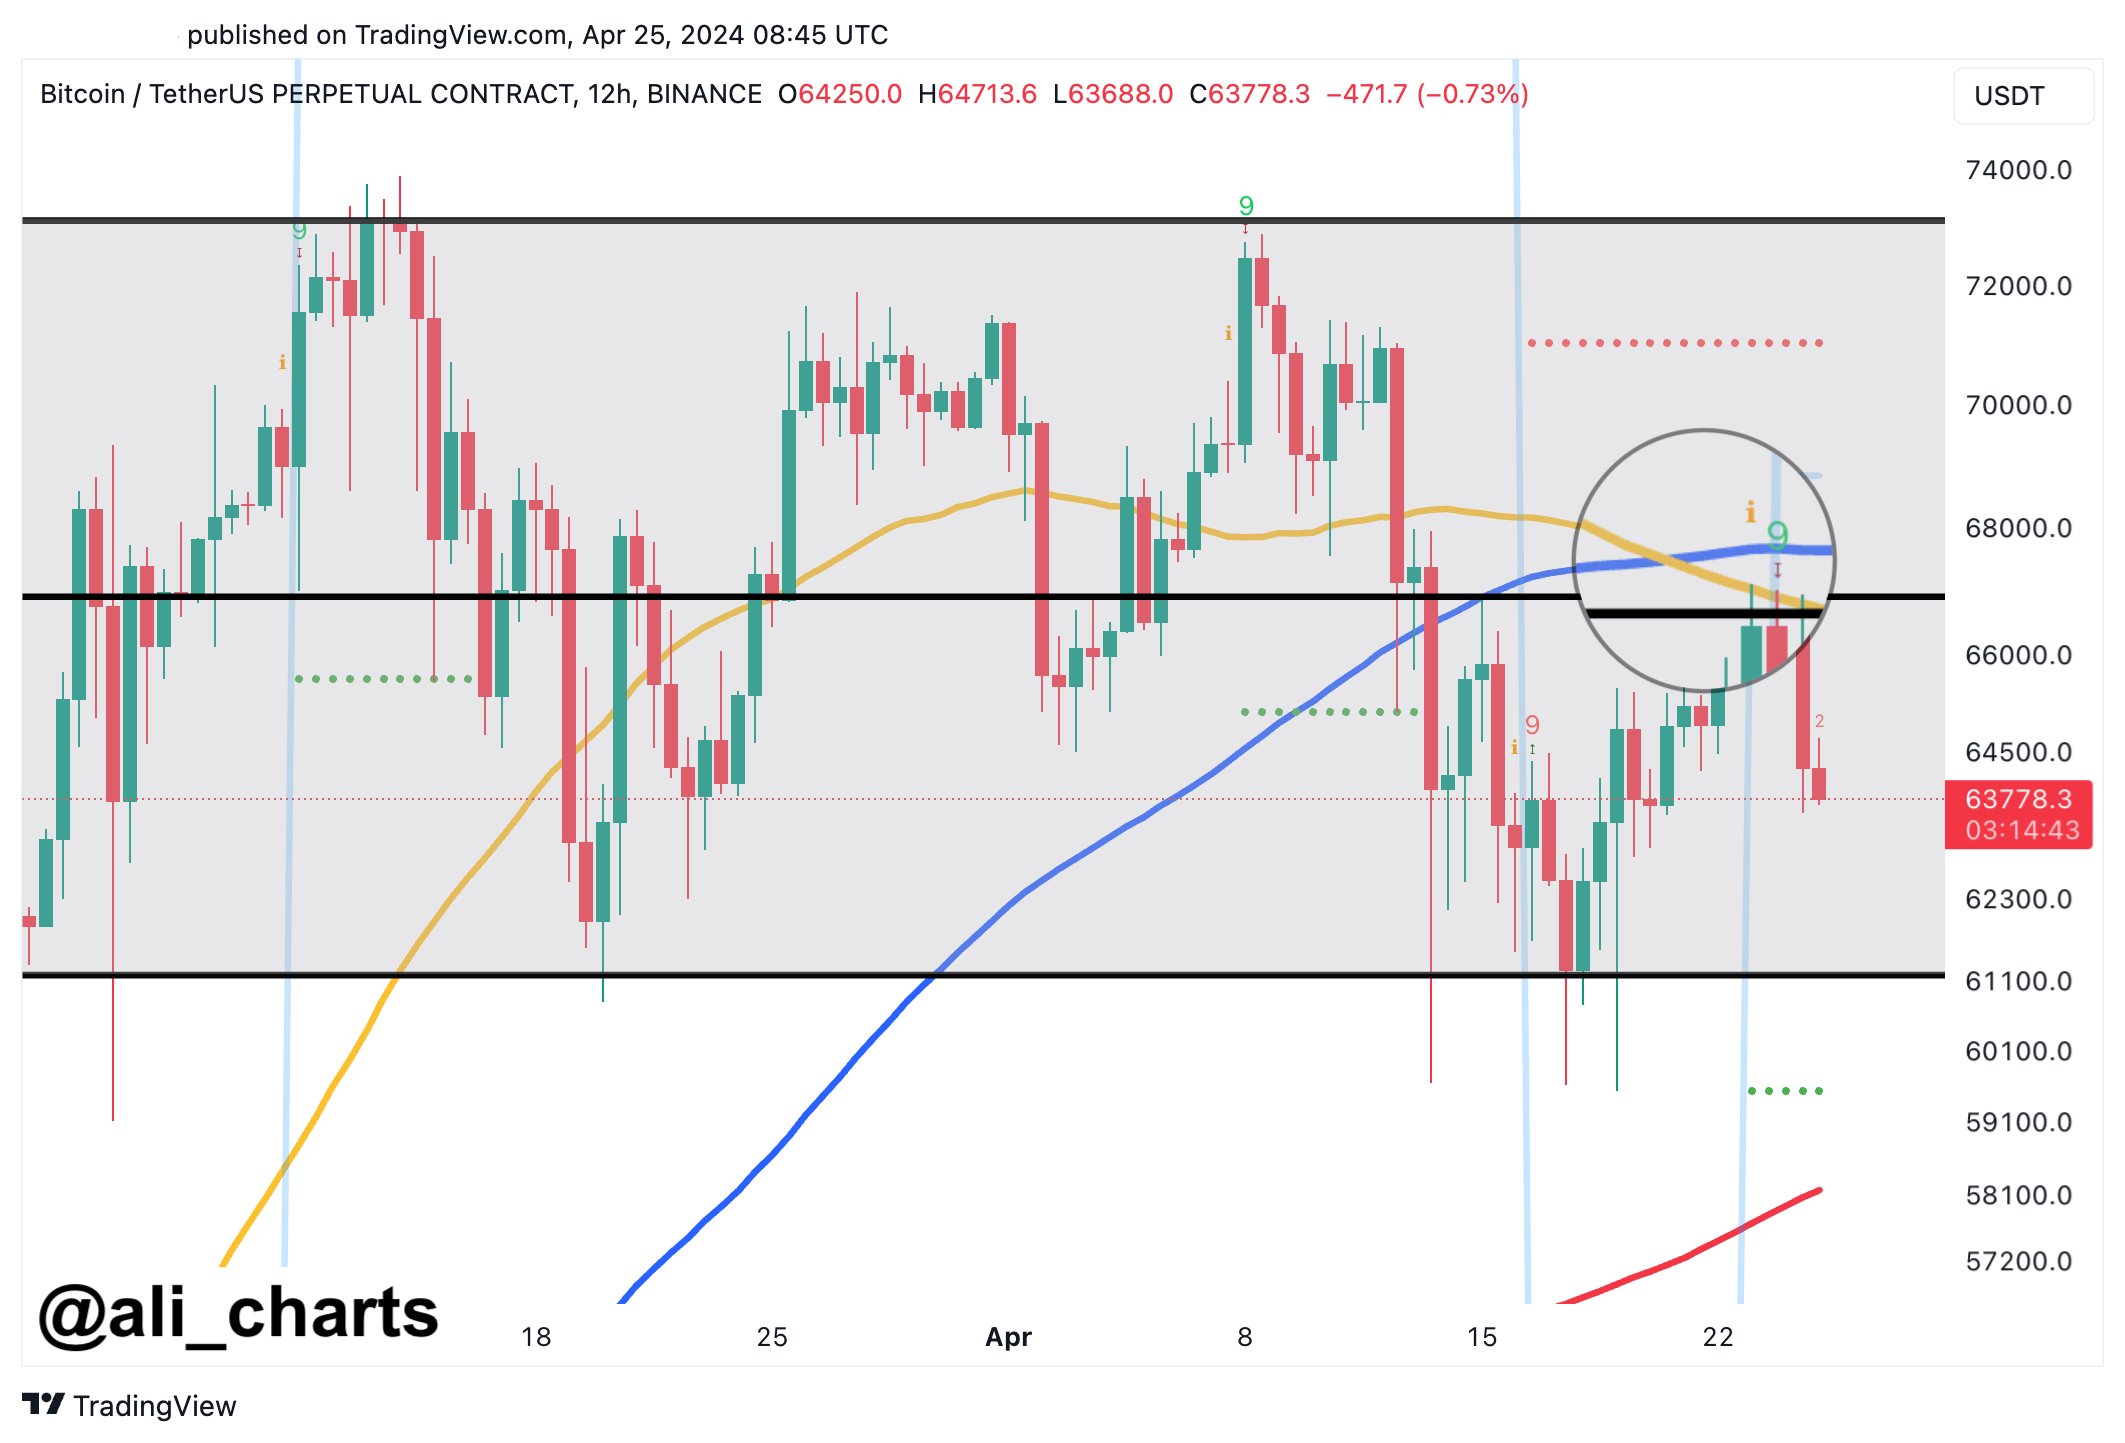
Now, here is the chart shared by Ali that highlights how signals about both of these technical analysis patterns have been witnessed in the 12-hour price of Bitcoin recently:

Bitcoin Death Cross & TD-9 Sell

As is visible in the graph, the 12-hour price of Bitcoin first saw a death cross form with the 50-day SMA moving under the 100-day SMA. Then, it observed the completion of a TD Sequential setup, with the indicator suggesting a reversal to the downward direction.

Since this double bearish pattern has appeared, BTC has been heading down, suggesting that these signals may already be in effect. “If BTC falls below $63,300, brace for possible dives to $61,000 or even $59,000,” says the analyst.

From the current price of the cryptocurrency, a potential drawdown to the first of these targets would mean a decline of 4.6%, while one to the latter level would suggest a drop of nearly 8%.

BTC Price

So far, Bitcoin has managed to prevent falls under the $63,300 target listed by the analyst, as it currently floats around $64,000.
Bitcoin Price Chart

Bitcoin MPI Forms Death Cross, End of The Rally?

On-chain data shows the Bitcoin Miners’ Position Index (MPI) has formed a death cross recently, a sign that the asset’s rally may end.

Bitcoin MPI Has Formed A Bearish Crossover Recently

As pointed out by an analyst in a CryptoQuant Quicktake post, the 365-day moving average (MA) of the BTC MPI has crossed above the 90-day recently. The “MPI” here refers to an indicator that measures the ratio between the miner outflows and the yearly MA.

The “miner outflows” are the amounts these chain validators transfer out of their combined wallets. Generally, the miners take out their coins for selling purposes, so the miners outflows can measure how much dumping they are currently partaking in.

Miner outflows are usually not that unusual, though, as this cohort has to constantly sell what they mine to pay off their running costs like electricity bills. What can be notable, however, is whether their selling deviates from the norm.

The MPI provides us with information about precisely this since it compares the outflows against their 365-day MA. When the metric is greater than 0, the miners are selling more than the average for the past year, while negative values imply the opposite.

Now, here is a chart that shows the trend in the 90-day and 365-day MAs of the Bitcoin MPI over the last few years:

Bitcoin MPI

The above graph shows that the 90-day MA Bitcoin MPI (colored in orange) has declined during the last few weeks. Recently, the metric crossed below the 365-day MA, consolidating sideways.

Historically, the crosses of the two MAs of the BTC MPI have appeared to be significant for the cryptocurrency’s price. In the chart, the quant has highlighted the major crossovers that occurred during the last few years.

Whenever the indicator’s 90-day MA has observed a cross above the 365-day MA, BTC has gone off to witness some bullish momentum. Such a cross preceded the April 2019 rally, the 2021 bull run, and the rally that started this January.

On the other hand, the opposite type of cross has proven to be bearish for the asset’s value, as steep declines have followed it. Since this death cross has once again formed for Bitcoin recently, it may signal that this year’s rally has reached its conclusion.

However, the crossover is still in the process of forming, meaning that the coming weeks may be important. If the 90-day MA can turn itself around quickly, then the death cross may not form, but if the metrics continue in their current trajectory, the bearish signal would be solidified.

BTC Price

Regardless of the death cross, Bitcoin has observed some sharp bullish momentum during the past 24 hours, as the asset has surged to the $28,300 level.

Bitcoin Price Chart

Bitcoin Forming Death Cross: Here’s What Happened Last Time

Bitcoin appears to be in the process of forming a death cross currently. Here’s what happened to the asset the last time this pattern emerged.

Bitcoin 50-Day MA Is Moving Below The 200-Day MA Right Now

As pointed out by an analyst in a post on X, the 50-day moving average (MA) has been attempting a cross below the 200-day MA recently. A “Moving Average” is an analytical tool that calculates the average of any given quantity over a specific period of time. As its name suggests, it moves and changes alongside the quantity in question.

The main benefit of an MA is that it removes short-term fluctuations from the data, smoothing out the curve. This makes the study of long-term trends easier to perform.

MAs can be taken over any length of time, whether that be a minute or a decade. There are some periods that are particularly useful, however, like the 50-day and 200-day MAs, which are of relevance in the current discussion.

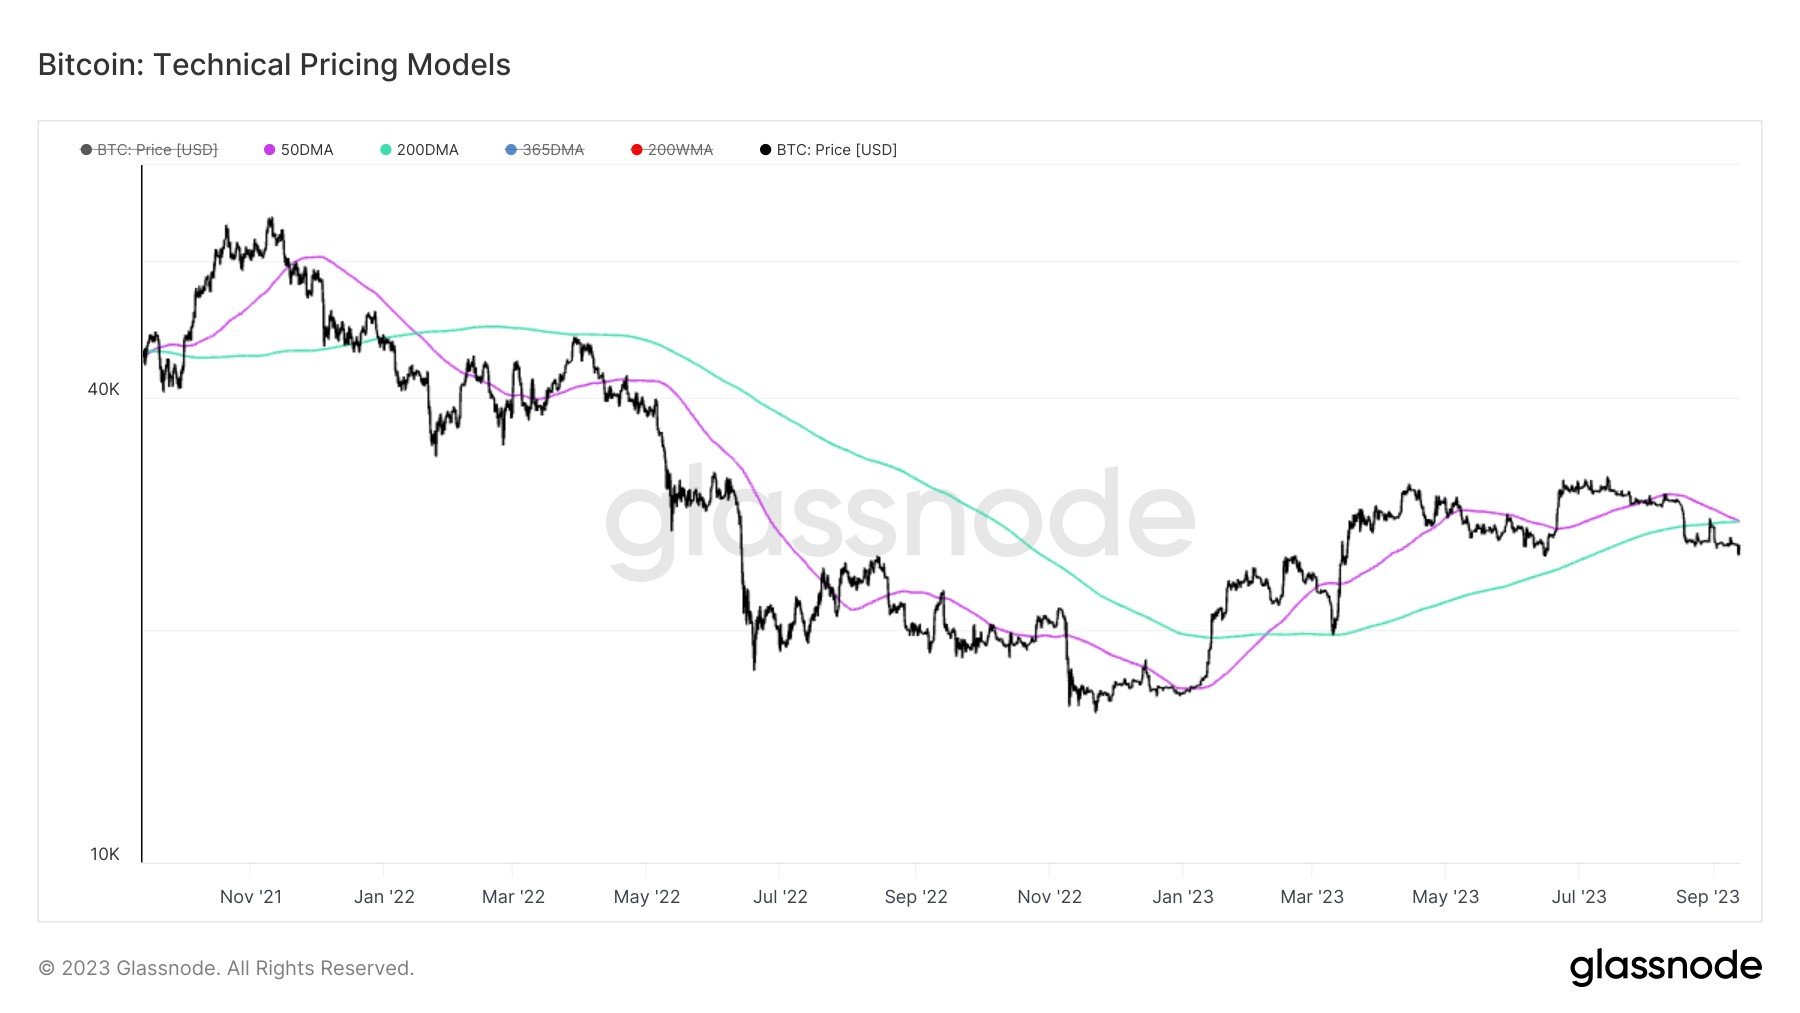
The interactions between these two Bitcoin MAs have apparently had consequences for the asset’s trend in the past, and the chart below shows how these two MAs have looked recently:

Bitcoin Death Cross

Historically, whenever the 50-day MA has dipped below the 200-day MA, the cross has proved to be a bearish one for the cryptocurrency’s price. In the above graph, it’s visible that the last time this type of crossover occurred was in January 2022.

Back then, the asset had been on its way down from its November 2021 all-time high and the death cross may have cemented the asset’s fate, as a long bear-market drawdown had followed afterward.

The opposite type of crossover, where the short-term MA moves above the long-term one, has generally been a bullish cross instead, as the asset has usually enjoyed uptrends following it. This crossover had been seen earlier in this year as well, after which BTC had gone on to see some significant rise.

Recently, however, as the cryptocurrency’s price has been struggling, the 50-day MA has started to go down and has now neared the 200-day MA. If the former continues in this trajectory and completes the cross below the latter, then another death cross would form for Bitcoin.

Such a cross would be an ominous sign for the asset, as it could imply that a significant drawdown may be ahead for the coin. So far, though, the bearish cross hasn’t been fully confirmed yet.

It now remains to be seen if the death cross will be completed in the coming days, or if BTC would turn itself around before it happens, leading to the 50-day MA pulling away from the 200-day MA for now.

BTC Price

Bitcoin has gone through a bit of a rollercoaster in the past two days, as its price had first dropped towards the $25,100 level, but has since already recovered above $26,100.

Bitcoin Price Chart