Bitcoin “Diamond Hands” Have Dumped 84.5k BTC Since FTX Collapse

Data shows the so-called Bitcoin “diamond hands” have shed 84.5k BTC from their holdings since the collapse of crypto exchange FTX.

Bitcoin Long-Term Holder Supply Has Sharply Declined Recently

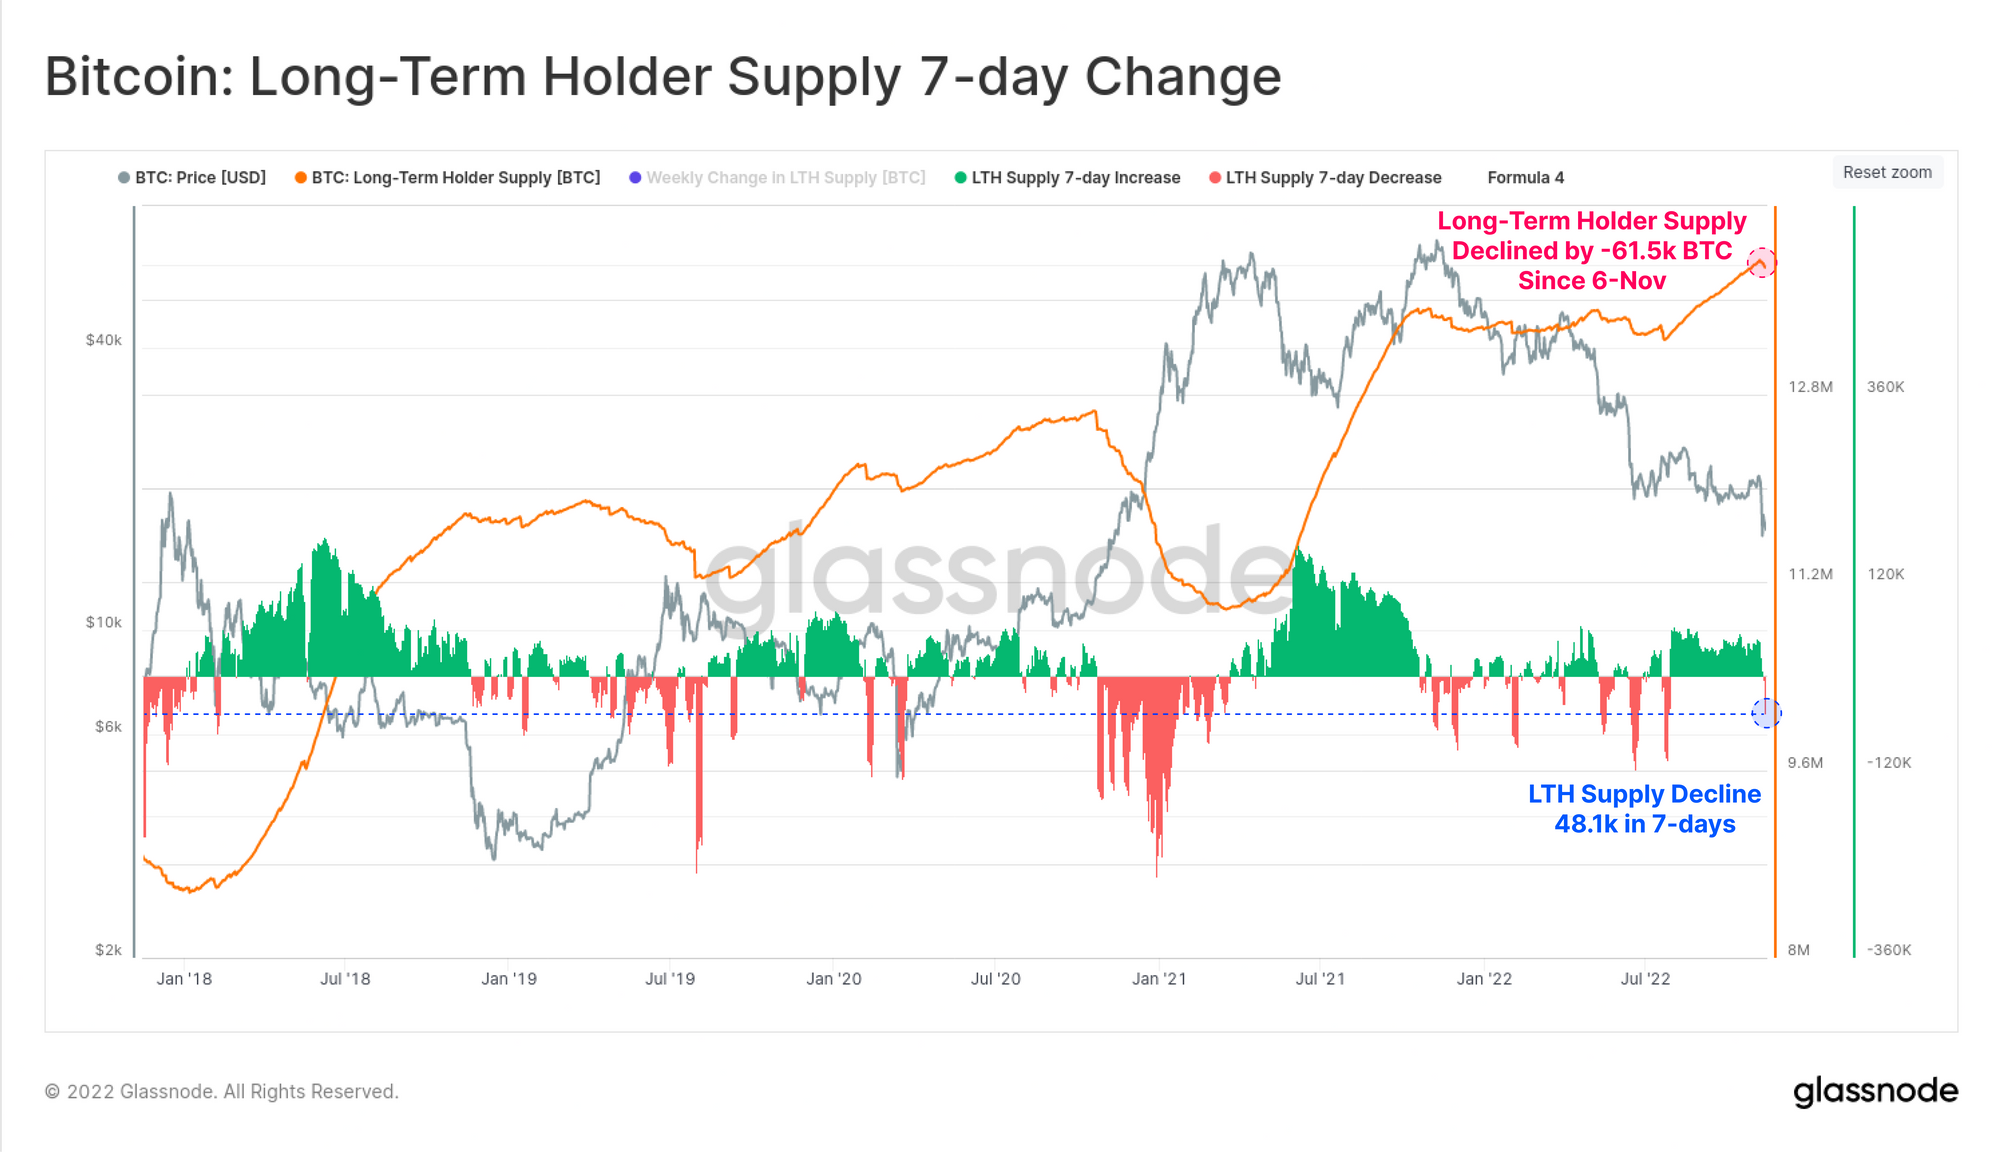
According to the latest weekly report from Glassnode, the long-term holder supply has observed one of its most significant declines this year in recent days.

The “long-term holder” (LTH) group is a Bitcoin cohort that includes all those investors who have been holding onto their coins since at least 155 days ago, without having sold or moved them.

Statistically, the longer an investor keeps their coins still, the less likely they become to sell them at any moment. Since LTHs make up the group that keeps their coins dormant the most, they are the cohort that’s least probable to dump amid times of pressure.

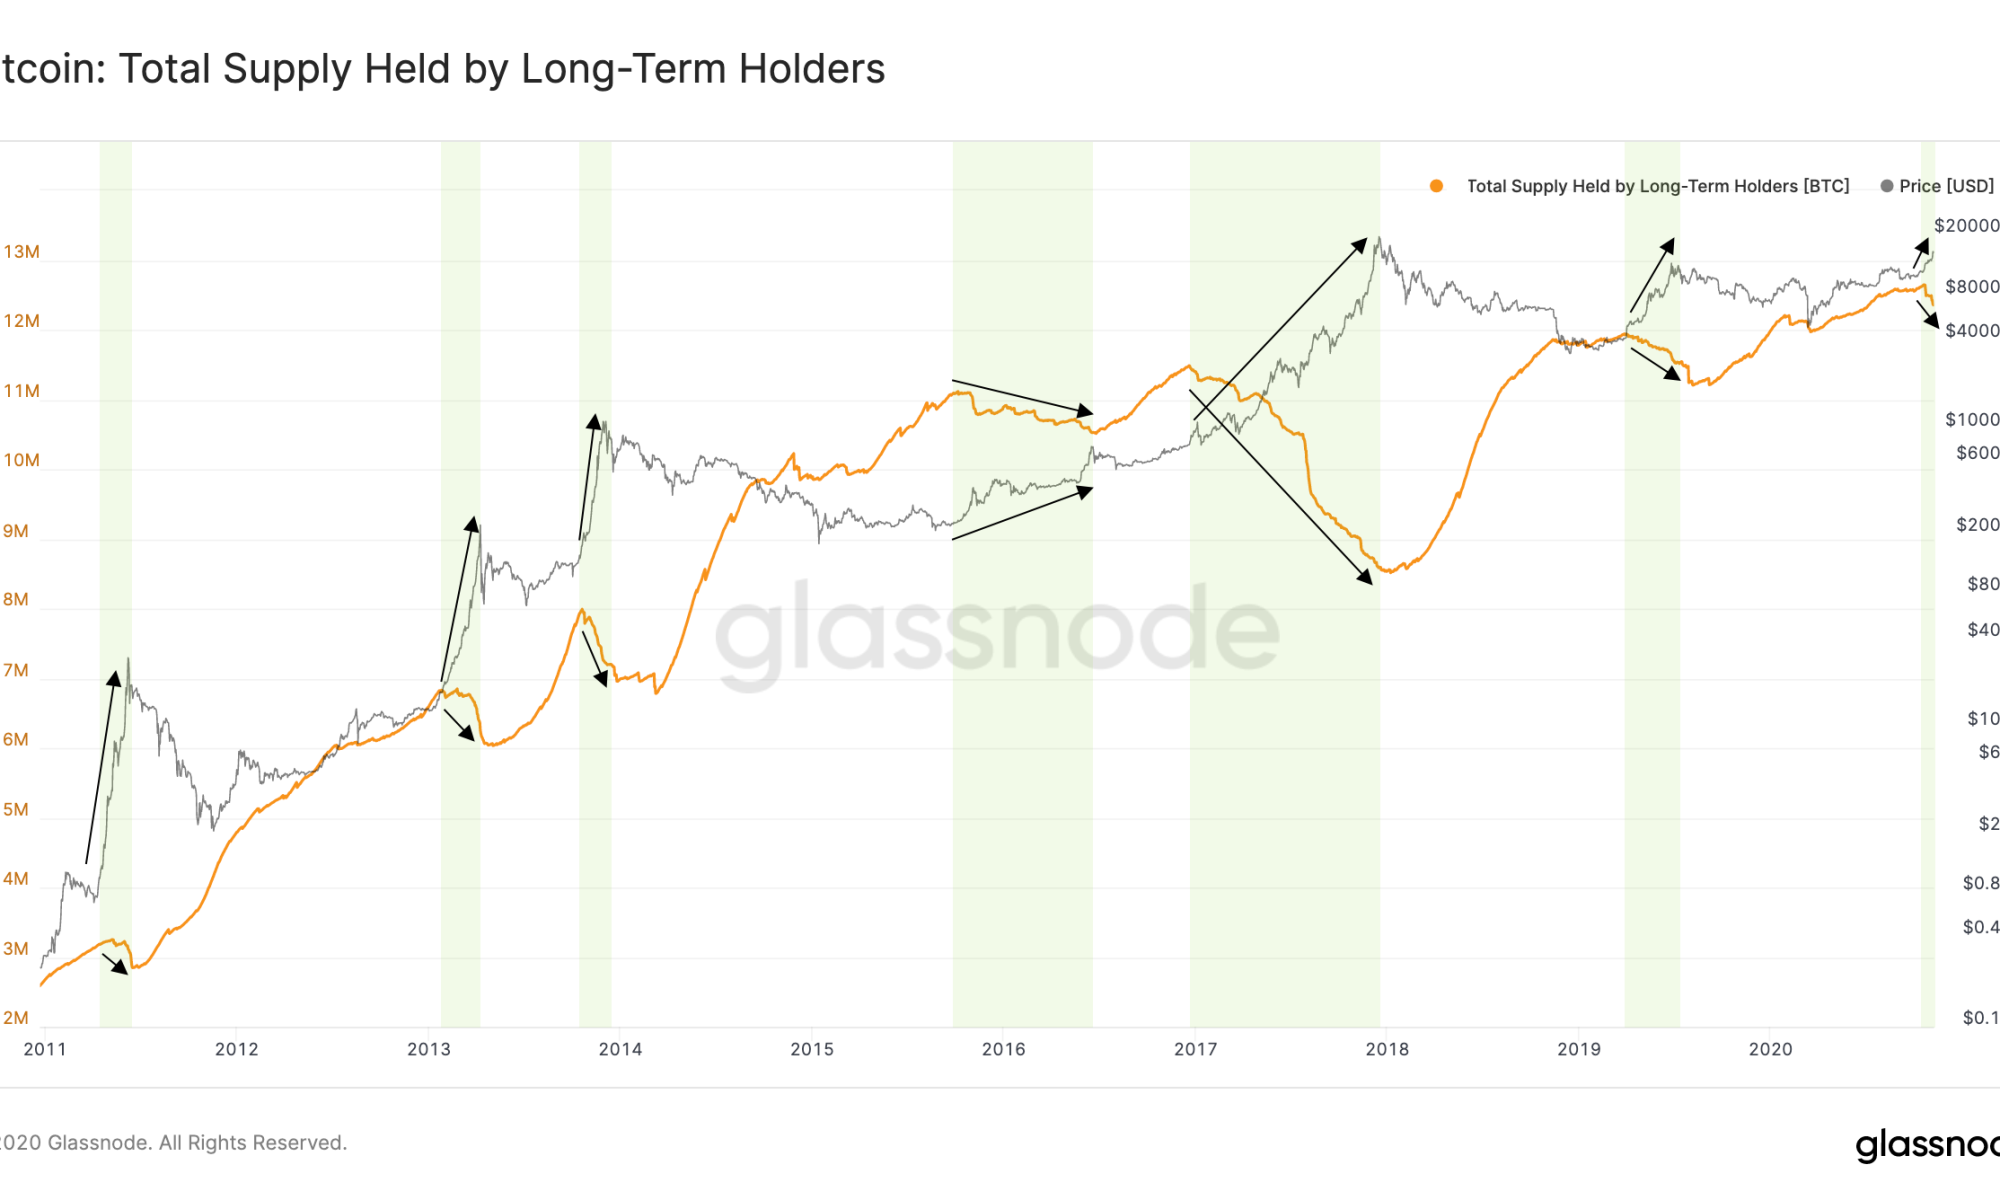
The “long-term holder supply” is an indicator that measures the total amount of BTC that this group as a whole is holding in their wallets right now.

When the value of this metric slips down, it means LTHs have moved their coins, possibly for selling purposes. While an increase suggests these holders have been expanding their treasuries recently.

Now, here is a chart that shows the trend in the Bitcoin LTH supply over the past year:

Bitcoin Long-Term Holder Supply

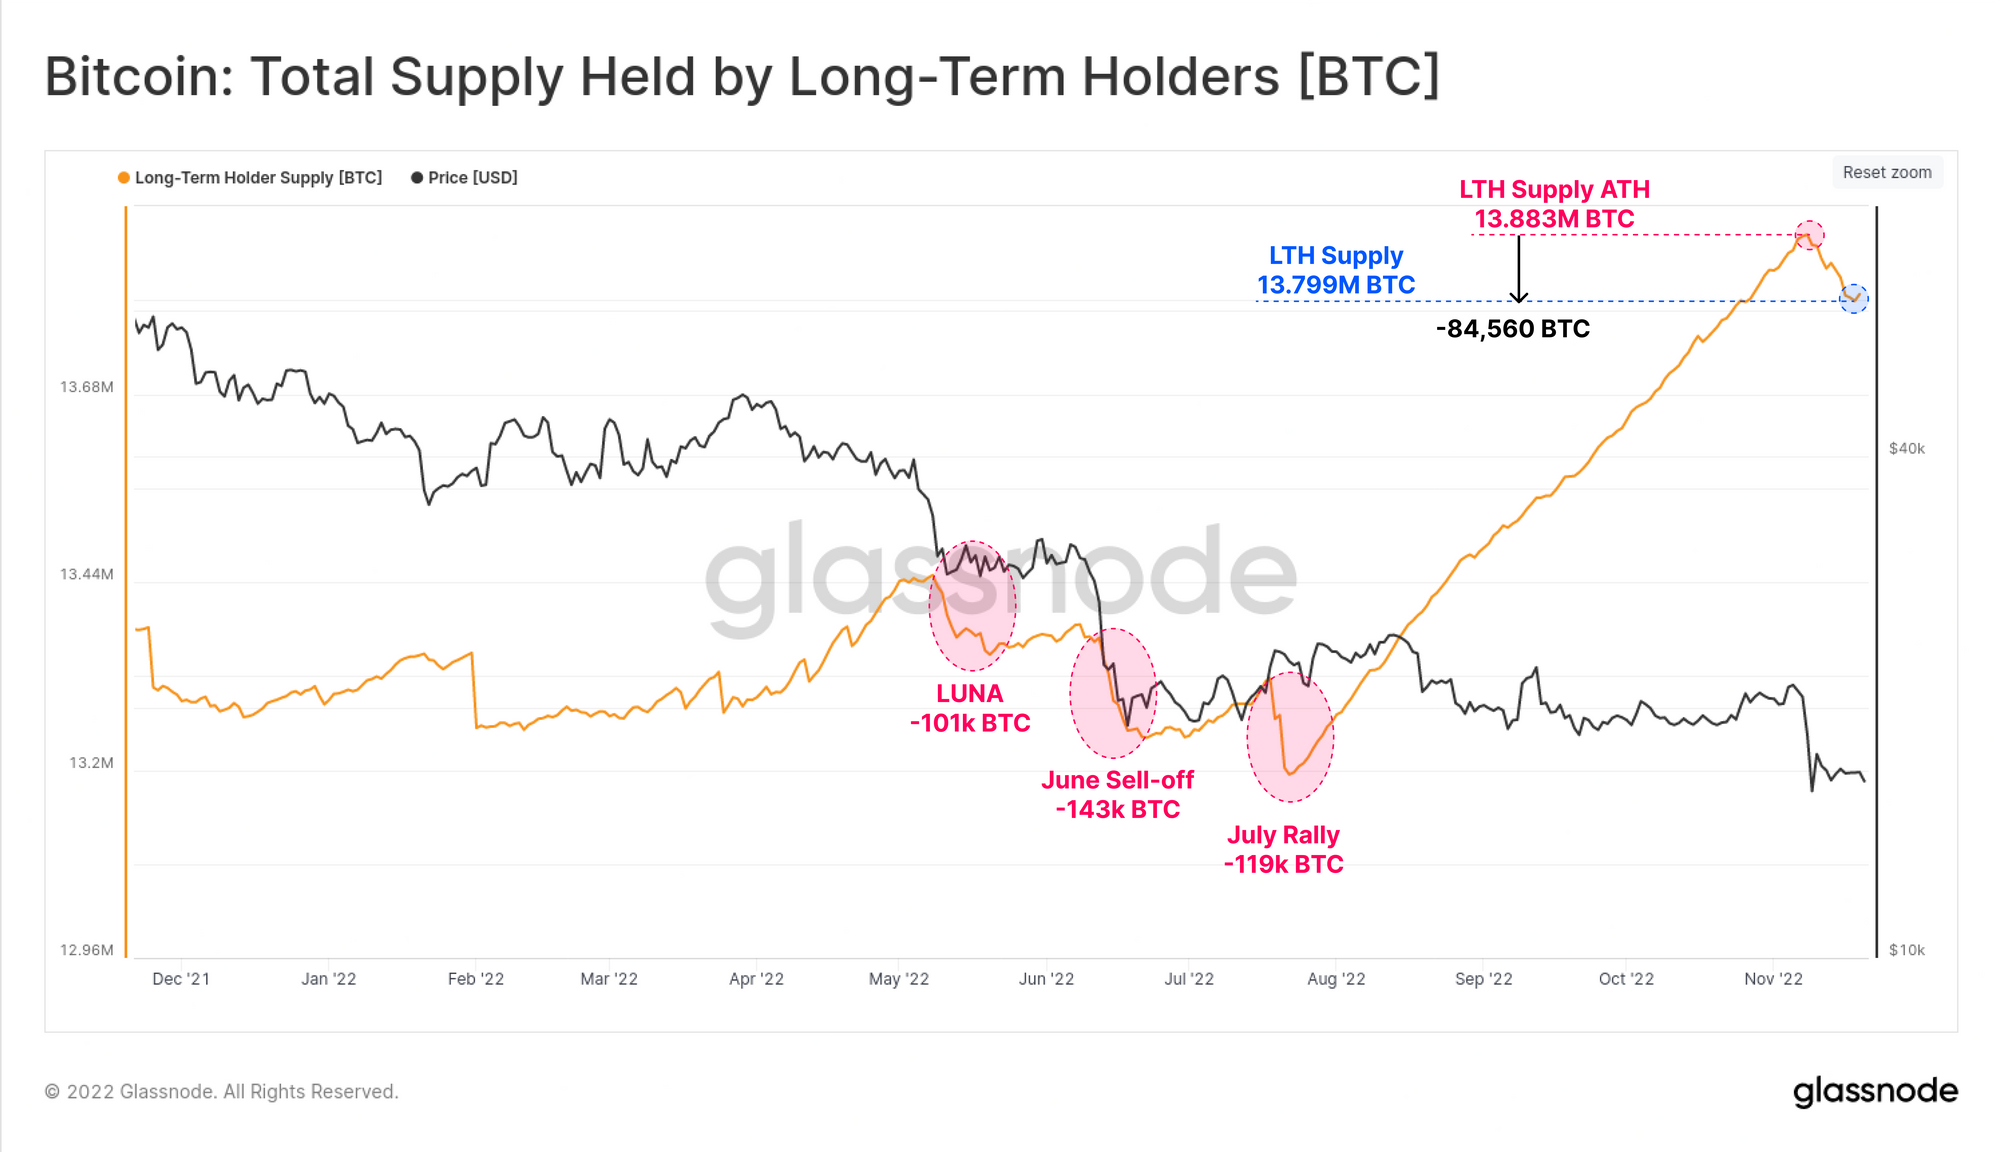
The value of the metric seems to have been on the decline in recent days | Source: Glassnode’s The Week Onchain – Week 47, 2022

As you can see in the above graph, the Bitcoin LTH supply set a new all-time high of around 13.883 million BTC just a couple of weeks or so ago.

This peak was just before the crash triggered by the fall of crypto exchange FTX initiated. As soon as the price plunge started, however, the indicator’s value also began to go down.

This means that the LTHs were dumping their coins, contributing to the price decline. The decrease in their supply has been consistently happening in the last two weeks, suggesting that these resolute holders didn’t slow down even after the initial crash was over.

So far, the Bitcoin LTH supply has gone down by about 84.56k BTC since the ATH was set, taking the metric’s value to 13.799 million BTC.

While this drawdown is significant, it’s still less than the previous three selloffs seen in May, June, and July.

Nonetheless, this is still a sign of weakness from what should be the most resolute holder group in the Bitcoin market, and the selloff also still seems to be underway so it can can possibly even deepen.

BTC Price

At the time of writing, Bitcoin’s price floats around $15.7k, down 6% in the last week.

Bitcoin Price Chart

Looks like BTC has gone down during the past two days | Source: BTCUSD on TradingView
Featured image from Vasilis Chatzopoulos on Unsplash.com, charts from TradingView.com, Glassnode.com

Glassnode Suggests Bitcoin Long-Term Holder Conviction Not Lost Yet

Data from Glassnode suggests Bitcoin long-term holder capitulation hasn’t reached a scale that would imply a widespread loss of conviction yet.

Bitcoin Long-Term Holder Supply Has Declined By 61.5k BTC Since 6 Nov

According to the latest weekly report from Glassnode, the BTC long-term holder supply has observed a notable decrease recently.

The “long-term holders” (LTHs) make up a cohort that includes all Bitcoin investors who have been holding onto their coins since at least 155 days ago.

Holders belonging to this group are statistically the least likely to sell at any point, so movements from them can have noticeable implications for the market.

The “long-term holder supply” is an indicator that measures the total number of coins currently stored in the wallets of these resolute investors.

Changes in the value of this metric can tell us whether the LTHs are accumulating or selling at the moment.

Now, here is a chart that shows the trend in the Bitcoin LTH supply over the last few years:

Bitcoin Long-Term Holder Supply

Looks like the value of the metric has decreased in the last few days | Source: Glassnode’s The Week Onchain – Week 46, 2022

As you can see in the above graph, the Bitcoin LTH supply had been riding a constant uptrend for many months before last week, and set new all-time highs.

This means that the market had been continuously accumulating the crypto as the bear market went on.

However, since the 6th of November (when the crash triggered by the FTX collapse began), the indicator has sharply declined, suggesting that LTHs have participated in some selling.

In total, the decline has amounted to around 61.5k BTC exiting the wallets of the LTHs in this period so far.

The chart also includes the data for the 7-day changes in this Bitcoin indicator, and it seems like the metric has a negative value of 48.1k right now.

This value isn’t negligible, but as is apparent from the graph, this red spike isn’t on the level of the ones observed during the previous selloffs.

The report notes that this could imply there hasn’t been a widespread loss of conviction among Bitcoin’s most resolute holders yet.

Nonetheless, it remains to be seen where the metric goes from here. “Should this develop into a sustained LTH-supply decline however, it may suggest otherwise,” cautions Glassnode.

BTC Price

At the time of writing, Bitcoin’s price floats around $16.8k, down 15% in the last week. Over the last month, the crypto has lost 13% in value.

Bitcoin Price Chart

The value of the crypto seems to still be trading sideways | Source: BTCUSD on TradingView
Featured image from Daniel Dan on Unsplash.com, charts from TradingView.com, Glassnode.com

Data: Bitcoin Whales Who Accumulated At $18k Have Continued To Hold Strong

On-chain data suggests Bitcoin whales who accumulated during the June crash have continued to hold strong so far.

Bitcoin Sum Coin Age Distribution Shows Strong Accumulation Around $18k

As pointed out by an analyst in a CryptoQuant post, the $18k level has been getting support from the whales as they have made spot purchases at this mark.

The relevant indicator here is the “Sum Coin Age Distribution,” which tells us about the amounts the different Bitcoin investor groups are holding in their wallets right now.

These groups are based on the idea of “coin age,” a measure of the total number of days a coin has been sitting dormant on the chain for.

As an example, if 1 BTC remains still in a single address for two weeks, then this coin is taken as a part of the “1 week to 1 month” (1W to 1M) supply.

Now, here is a chart that shows the trend in the Sum Coin Age Distribution in the Bitcoin market over the last year:

Looks like the 3M to 6M group has been going up in recent weeks | Source: CryptoQuant

As you can see in the above graph, the amount of supply held by the different Bitcoin coin age cohorts has shown an interesting pattern during the last few months.

When the crypto’s price crashed back in June, the 1D to 1W supply spiked up as whales picked up some fresh coins around the $18k level.

As the days passed, these coins started aging into the 1W to 1M range, causing the 1D to 1W band to plunge down, while the 1W to 1M group observed an uptrend.

Similarly, these coins matured further with time, leading to the 1M to 3M group rising up and the previous one falling off. And finally, in the last couple of months, the 3M-6M cohort has also found itself at the end of this cascading effect.

The recent increase in this last group suggests that the Bitcoin whales who bought during the crypto’s decline to $18k have still not realized profits on their coins, and have continued to hold onto them with conviction.

BTC Price

At the time of writing, Bitcoin’s price floats around $19.2k, up 1% in the last seven days. Over the past month, the crypto has gained 4% in value.

The below chart shows the trend in the price of the coin over the last five days.

The value of the crypto continues to show stagnant price movement in the last few days | Source: BTCUSD on TradingView
Featured image from Michael Blum on Unsplash.com, charts from TradingView.com, CryptoQuant.com

Bitcoin Diamond Hands: Long-Term Holder Supply Surges Up To Near ATH

Data shows the Bitcoin long-term holder supply has surged up recently to near all-time high values as these “diamond hands” add to their holdings.

Bitcoin Long-Term Holder Supply Jumps Up By 250k BTC After The Recent Low

According to the latest weekly report from Glassnode, the current total balances of the long-term holders is only 30k away from the ATH.

The “long-term holders” (or LTHs in short) is a Bitcoin holder group that includes all those investors who have been holding onto their coins since at least 155 days ago, without having sold or moved them.

Generally, the longer holders keep their BTC still, the less likely they become to sell them. Because of this, LTHs are the less likely investor group to sell at any point.

The opposite cohort is the “short-term holders” (STHs), who have had their coins in their wallets for less than the 155-day mark.

Now, the “LTH supply” is a measure of the total number of coins currently sitting in the wallets of the investors belonging to this group.

When the STH supply matures enough and reaches the threshold, these coins are then naturally included in the LTH supply.

Here is a chart that shows the trend in the Bitcoin LTH supply over the past couple of years:

Looks like the value of the metric has been going up in recent days | Source: Glassnode’s The Week Onchain – Week 36, 2022

As you can see in the above graph, the Bitcoin LTH supply had been on a decline since the ATH and hit a low just a while back.

However, during the last few weeks, the indicator’s value has observed an uplift. Since the low, LTHs have added around 250k BTC onto their holdings.

The report notes that the 155-day threshold puts the minimum acquisition period for these investors to be counted as LTHs to be before the LUNA crash.

Due to this, the report thinks it’s possible the supply of these hodlers will stagnate over the next month, or even until mid-October, where the threshold will have then shifted to the post-selloff period.

BTC Price

At the time of writing, Bitcoin’s price floats around $19.8k, down 1% in the last week. Over the past month, the crypto has lost 14% in value.

The below chart shows the trend in the price of the coin over the last five days.

The value of the crypto seems to have not moved much in the last few days | Source: BTCUSD on TradingView
Featured image from Aleksi Räisä on Unsplash.com, charts from TradingView.com, Glassnode.com

Bitcoin “Diamond Hands” Start To Break As 1yr+ Supply Ramps Up Selling

Data shows the Bitcoin supply older than 1 year has shown accelerating movement recently, suggesting even the crypto’s stronger hands are feeling the fear in the market.

Bitcoin Diamond Hands Are Starting To Budge In Current Market

According to the latest weekly report from Glassnode, BTC’s older supply has been observing selling in recent days.

The relevant indicator here is the “revived supply last active 1+ years,” which measures how many coins that have been sitting still since at least one year ago are seeing movement per day.

When the value of this metric spikes up, it means a large amount of coins belonging to Bitcoin hodlers are being moved at the moment.

Such a trend, when prolonged over a period, may be bearish for the crypto’s price as this kind of movement can imply the diamond hands in the market have been selling.

On the other hand, low values of the metric imply there hasn’t been any significant movement in the supply older than one year recently.

Related Reading | Bitcoin Long-Term Holder Loss-Taking Now Highest Since 2019

This trend shows hodlers are holding strong on to their coins, a sign that could be either neutral or bullish for the coin’s value.

Now, here is a chart that shows the trend in the revived Bitcoin supply last active 1+ year ago over the past 12 months:

The value of the indicator seems to have been high recently | Source: Glassnode’s The Week Onchain – Week 25, 2022

As you can see in the above graph, a large amount of coins last active more than a year ago showed movement in recent days.

Also, not just that, this spending of old coins has been rather accelerating, now reaching a value of 20k to 36k BTC per day.

Related Reading | New York’s Latest Bill Clamping Down On Bitcoin Mining Draws Sharp Criticism From Industry

This implies that these long-term holders have been ramping up their selling in the last few days as the price of the crypto has struggled.

The trend suggests that the recent crash has put fear and panic among even the stronger of Bitcoin hands, who are usually the last to budge during selloffs.

If the selling of coins older than one year continues on, then BTC could observe further downtrend in the near future.

BTC Price

At the time of writing, Bitcoin’s price floats around $21k, down 5% in the last seven days. Over the past month, the crypto has lost 28% in value.

The below chart shows the trend in the price of the coin over the last five days.

Looks like the value of the crypto has been steadily rising over the last few days | Source: BTCUSD on TradingView
Featured image from Unsplash.com, charts from TradingView.com, Glassnode.com

Bitcoin Price Continues Struggle, But Miners Refuse To Sell

On-chain data shows while the price of Bitcoin has continued to struggle recently, miners have shown diamond hands.

Bitcoin Miner Reserve Holds Still Amid The Recent Price Consolidation

As pointed out by an analyst in a CrypoQuant post, BTC miners have been accumulating for some time now, and the dwindling price hasn’t scared them.

The “Bitcoin miner reserve” is an indicator that measures the total amount of coins present in wallets of all miners.

When the value of this indicator observes a decrease, it means the supply held by miners is going down. Such a trend may be a sign that miners are dumping right now as they usually withdraw coins from their reserve for selling them on an exchange. And therefore, this can be bearish for the price of the coin.

On the other hand, an uptrend in the indicator, when prolonged, can prove to be bullish for the value of Bitcoin as it may show miners are accumulating at the moment.

Related Reading | Quant Explains Similarities Between Current And Summer 2020 Bitcoin Markets

Now, here is a chart that shows the trend in the Bitcoin miner reserve over the past couple of years:

Looks like the value of the metric has been trending sideways in recent months | Source: CryptoQuant

As you can see in the above graph, the Bitcoin miner reserve was at a very high value before the start of the 2021 bull run, but as soon as it kicked off a lot of miners harvested profits.

Following the crash in May of the same year, miners held on for a while, but it wasn’t too long until they the metric saw a plunge as they dumped.

Related Reading | Bitcoin Perfectly Follows Market Cycle Comparison, What Comes Next For Crypto?

Active miners have running costs like electricity so in times of low profitability, they have to sell their coins to pay off these bills.

These holders started accumulating again in July as a new rally kicked off. This time, however, they didn’t sell off when the ATH was hit and a crash occurred.

Though, miners have also not been adding further to their Bitcoin reserves in recent months either. But nonetheless, they have held strong through the seemingly endless sideways movement the price of the crypto has shown lately.

BTC Price

At the time of writing, Bitcoin’s price floats around $38.4k, down 1% in the past week. Over the last month, the crypto has lost 17% in value.

The below chart shows the trend in the price of the coin over the last five days.

The value of the crypto seems to have slid down over the last few days | Source: BTCUSD on TradingView
Featured image from Unsplash.com, charts from TradingView.com, CryptoQuant.com

Bitcoin Diamond Hands: Despite Recent Fear, Coins Aged 12-18 Months Rise To 2-Year High

Despite the recent fearful market, Bitcoin hodlers show diamond hands as coins aged 12-18 months touch a 2-year high.

Coins Matured To 12-18 Months Revisit A High Not Seen Since 2 Years

As pointed out by an analyst in a CryptoQuant post, BTC hodlers have held strong recently as coins aged 12-18 months have seen a sharp spike recently.

The relevant on-chain indicator here is the Bitcoin Sum Coin Age (SCA) Distribution that shows the distribution of coins among the different holders in the market.

The metric works by looking at each coin on the chain and measuring how many days it has been since it was last moved. Based on the age, these coins are put into different categories.

For instance, if a coin has been sitting still since 12-18 months ago, it is included in the 12-18 months holder group.

When the distribution of the long-term holders goes up, it means accumulation has been strong recently. Such a trend has usually been bullish for the price of Bitcoin as it shows a large number of holders refuse to sell at the current levels.

On the other hand, when coins belonging to short-term holders move up, it means some long-term holders have decided to sell. This trend may be bearish for the price of the crypto.

Related Reading | Bitcoin Millionaires Are Flocking To This North American Tax Haven. But What Do The Locals Think?

Now, here is a chart that shows the trend in the supply of coins that have matured to 12-18 months (one of the long-term holder groups):

Looks like the value of the indicator has shot up recently | Source: CryptoQuant

As you can see in the above graph, the coins aged 12-18 months have sharply rose recently, reaching a 2-year high. The highlighted region in the chart is around when these holders bought these coins.

This means that these Bitcoin holders have now held strong through multiple all-time highs, the mini-bear period between May-July, as well as the recent fearful market.

Related Reading | Bitcoin Implied Volatility Plummets To Pre-Bull Market Levels: What This Means

Hodlers showing such diamond hands behavior can prove to be quite bullish for the price of the coin in the long term.

Bitcoin Price

Earlier today, Bitcoin’s price crashed below $40k, touching as low as $38k. Since then, the coin hasn’t recovered much yet.

At the time of writing the crypto’s price floats around $38.8k, down 7% in the last seven days. Over the past month, the coin has lost 17% in value.

The below chart shows the trend in the price of BTC over the last five days.

After weeks of consolidation, BTC’s price seems to have finally crashed below the $40k level | Source: BTCUSD on TradingView
Featured image from Unsplash.com, charts from TradingView.com, CryptoQuant.com