Although the altcoin market cap has declined nearly 20% over the past month, traders remain bullish, anticipating that an “explosive rally” phase is yet to come.
Cryptocurrency Financial News
Although the altcoin market cap has declined nearly 20% over the past month, traders remain bullish, anticipating that an “explosive rally” phase is yet to come.
Although the altcoin market cap has declined nearly 20% over the past month, traders remain bullish, anticipating that an “explosive rally” phase is yet to come.

The Bitcoin halving is widely expected to have a positive impact on the price of the preeminent cryptocurrency, but analysts expect volatile price consolidation in the short term.

Bitcoin’s dominance in the crypto market is “now losing major support” and potentially has even “peaked” according to crypto analysts.
On-chain data suggests Bitcoin has recently experienced an influx of investors while Dogecoin, Cardano, and other altcoins have seen a slowdown.
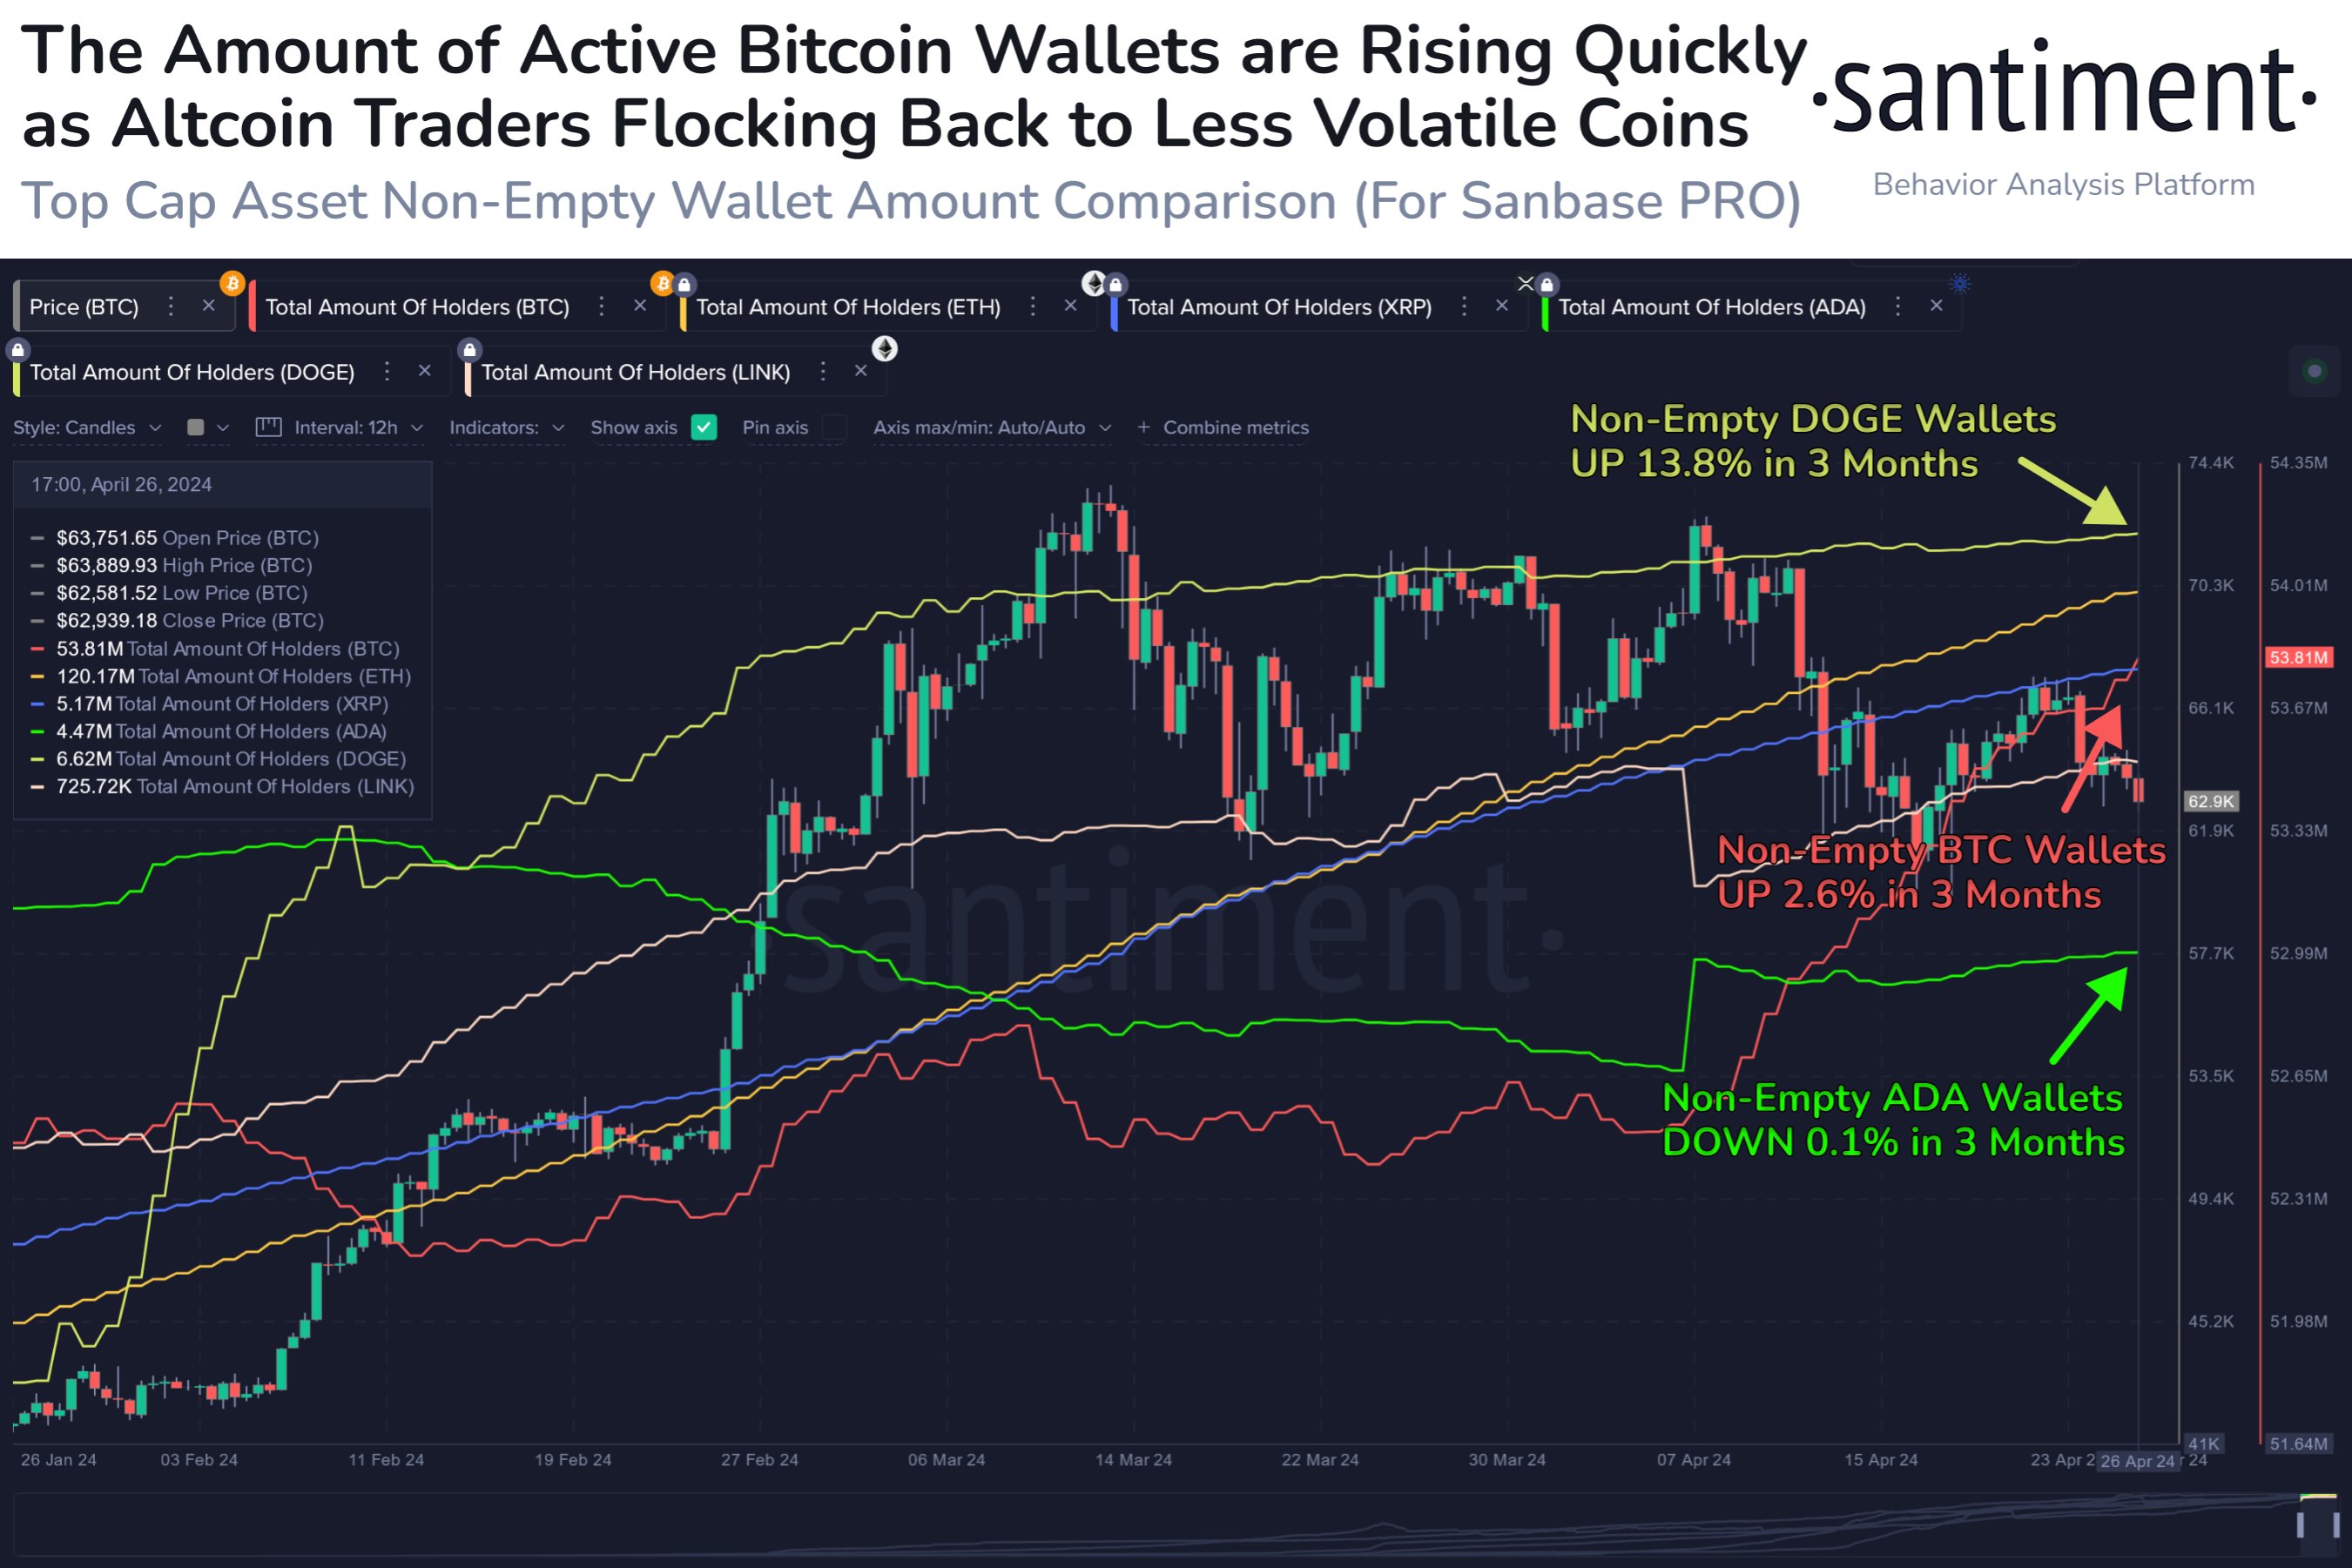
According to data from the on-chain analytics firm Santiment, the number of Bitcoin investors has sharply increased recently. The on-chain metric of interest here is the “Total Amount of Holders,” which keeps track of the total number of addresses on a given network carrying some non-zero balance.
When the value of this indicator goes up for any asset, it can be due to several things. The first and most obvious contributor to this trend would be adoption, as a fresh influx of users would naturally create more addresses.
Another contributor could be old investors returning to reinvest in the coin after selling out their balance earlier. The indicator would also increase when investors spread out their holdings among multiple wallets for reasons like privacy.
In general, some net adoption occurs whenever the Total Amount of Holders goes up. Historically, adoption has been a constructive sign for any blockchain in the long term.
Naturally, when this metric’s value goes down, it implies that some investors have decided to exit from the cryptocurrency as they have completely cleaned out their wallets.
Now, here is a chart that shows the trend in the Total Amount of Holders for some of the top assets in the sector: Bitcoin (BTC), Ethereum (ETH), XRP (XRP), Cardano (ADA), Dogecoin (DOGE), and Chainlink (LINK).
As displayed in the graph, Dogecoin started 2024 with some rapid adoption as its Total Amount of Holders had been observing a sharp uptrend. However, this growth only lasted for the first couple of months, as the metric has since flattened for the memecoin.
Other altcoins like Chainlink and Cardano have also witnessed flat action in the metric in this period. The trend had been just the opposite for Bitcoin, where more or less flat movement had occurred in its number of investors earlier in the year, but the asset has seen some uptrend in the metric this month.
It’s possible that investors were previously attracted to Dogecoin and other networks, but now that markets have been undergoing bearish price action, traders are back to preferring the original cryptocurrency.
Overall, DOGE’s holders are still up 13.8% in the past three months, while BTC’s growth stands at 2.6%. Naturally, the latter’s userbase is also larger, so a relatively small percentage could be due to that.
Cardano is among the few networks in the sector that have observed negative action in the Total Amount of Holders during this window, although the decrease is a mere 0.1%.
Bitcoin has been struggling to make any recovery run count recently, as its price is back at $63,000 after the latest failed attempt.
BTC dominance is creeping upwards as Layer-1s and Artificial Intelligence tokens had a rough week, while Google search interest in the halving skyrockets.
Bitcoin’s dominance within the cryptocurrency market has reached a three-year high, signaling strong demand for US spot Bitcoin ETF holding the largest digital asset and a challenging period for smaller tokens.
Bitcoin accounted for nearly 55% of the $2.4 trillion digital asset market at the end of last week, a level not seen since April 2021. On Saturday, in particular, BTC’s dominance jumped to 57% as it briefly touched the $67,000 mark.
The next largest tokens by market share include Ethereum (ETH), Tether’s USDT stablecoin, Binance exchange’s native token Binance Coin (BNB), and Solana (SOL).
According to Bloomberg, the recent success of the recently approved US spot Bitcoin ETFs from prominent issuers such as BlackRock and Fidelity Investments has played a significant role in Bitcoin’s rise.
These ETFs have garnered approximately $56 billion in assets, making their debut one of the most successful in fund category history.
The inflows into these ETFs drove BTC to its current all-time high (ATH) of $73,798 in mid-March, a clear resistance level for the largest cryptocurrency on the market, as evidenced by its inability to consolidate above the $70,000 level following this achievement.
Although BTC is down about 6% since then, smaller digital assets such as Avalanche (AVAX), Polkadot (DOT), and Chainlink (LINK) have seen more significant declines of nearly 30% over the past month.
This drop coincided with reduced expectations for looser US monetary policy settings, often fueling speculative gains.
Institutional investors’ allocations to the US Bitcoin ETF have greatly influenced Bitcoin’s performance relative to the rest of the market. Benjamin Celermajer, director of digital-asset investment at Magnet Capital, noted that strong institutional demand is a key driver.
On Monday, Bitcoin and Ethereum, the second-largest cryptocurrency, saw notable price jumps following indications that asset managers are preparing to launch Hong Kong-listed ETFs on both tokens. Bitcoin rose 4.3% to $66,575, while ETH jumped 6.2% to $3,260.
These rallies had a positive impact on the broader crypto market, lifting other notable tokens such as Polygon (MATIC), Cardano (ADA), the dog-themed meme coin Dogecoin (DOGE), and Solana, which is now the top 5 cryptocurrency market winner, up over 8% on Monday.
Interestingly, the Bloomberg Galaxy Crypto Index, which measures the performance of the largest digital assets traded in US dollars, has more than tripled since the beginning of last year, marking a significant rebound from the bear market experienced in 2022.
Lastly, investors and traders eagerly anticipate the upcoming Bitcoin Halving, an event that will cut the new supply of the token in half, expected around April 20th.
Previous Halving events have acted as a tailwind for prices, although there are growing doubts about whether history will repeat itself given BTC’s recent all-time high achievement.
BTC has successfully maintained its position above the $66,000 threshold and has consolidated in this range. However, it is important to note that losses have accumulated over longer time frames.
Over the past fourteen and thirty days of trading, the cryptocurrency has experienced significant declines of over 21% and 24% respectively.
Featured image from Shutterstock, chart from TradingView.com
The approval of Bitcoin ETFs in January was a catalyzing event for crypto, says Gregory Mall, head of investment solutions at AMINA bank. How will the upcoming halving affect markets going forward and which projects are likely to win out over the long-term?
For the last two years in the crypto market, it has paid off to be in Bitcoin versus altcoins. However, a new BTC dominance chart shows why the tides are about to turn in favor of altcoins.
At this very moment, Bitcoin, the top cryptocurrency by market cap, represents more than 50% of the entire crypto market. On one hand, this makes sense given its regulatory acceptance, first-mover advantage, and significant brand power. On the other hand, there are tens of thousands of altcoins out there and yet BTC is still dominant.
But even Bitcoin dominance goes through cyclical boom and bust phases where it loses its dominance to the rest of the crypto market. This is typically called “altcoin season.” The last one to occur was back in late 2020 into 2021, and it lasted only several months. Before that, the rally that coined the term altcoin season took place all of 2017.
With three to four years in between the 2017 rally, the calendar turning toward 2024 puts us yet another year closer to the next altcoin season. This is evident by price action and technical oscillators following sine waves.
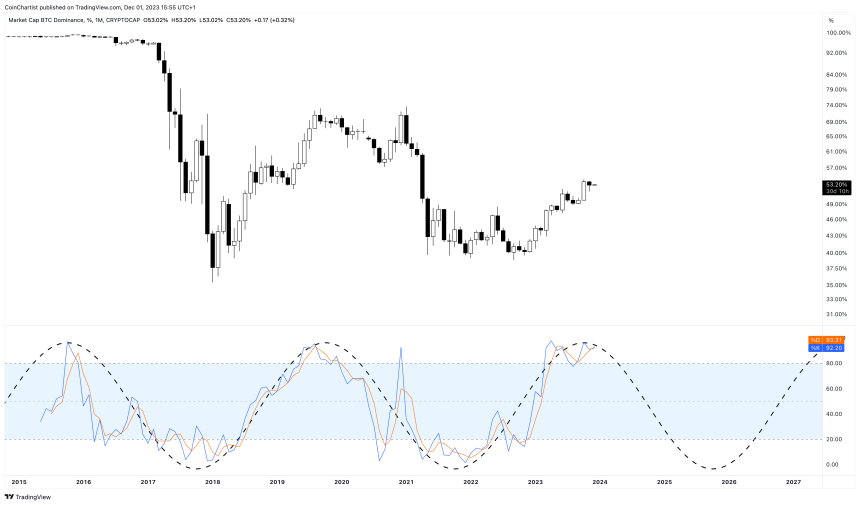
According to Investopedia, a sine wave is an S-shaped geometric waveform that oscillates periodically above and below zero. Sine waves can be used in technical analysis to help identify cyclical patterns in technical indicators and oscillators.
In the chart above, the sine wave suggests that indicators are ready to begin rolling over, with the wave overlaid matching the 1M Stochastic almost perfectly. Aside from some chop, the sine waves have followed the ebb and flow back and forth between Bitcoin and altcoin dominance for going on a decade.
If the tool accurately demonstrates the path ahead for Bitcoin dominance, the next altcoin season could be on the way soon enough. Bitcoin is approaching $40,000 and is becoming increasingly expensive for retail investors, who aren’t even paying attention yet to the crypto market.
When they do realize how expensive Bitcoin is again, right under their noses, retail investors will search for the “next Bitcoin” frantically, sparking the next altcoin season. The last time these phases occurred, Bitcoin was passing $10,000 in 2017, and $20,000 in 2020. Now in 2023, will $40,000 be the trigger for alts to finally outperform?
It's time for the ebb and flow to favor altcoins again pic.twitter.com/y5cONFhJyo
— Tony "The Bull" (@tonythebullBTC) December 1, 2023

Bitcoin dominance is a largely redundant metric — if you believe BTC and crypto “altcoins” should be in the same category at all that is.
Ethereum (ETH) has so far relatively underperformed in comparison to the flagship cryptocurrency Bitcoin. However, that could change soon enough as a crypto analyst has predicted the second-largest crypto token by market to gain some momentum soon enough.
In a post shared on his X (formerly Twitter) platform, prominent crypto analyst Ali Martinez mentioned that Ethereum could rise to as high as $1,900. His prediction was based on data that he had pulled up from the chart which he shared in his post.
The chart (a 3-day timeframe) featured an ascending triangle pattern, which usually represents a bullish formation. According to Ali, Ethereum is “poised” to rebound off the hypotenuse of the ascending triangle. Most importantly, for Ethereum to go as high as $1,900, the analyst noted that It has to experience a “firm close” above the 18-day SMA (Simple Moving Average).
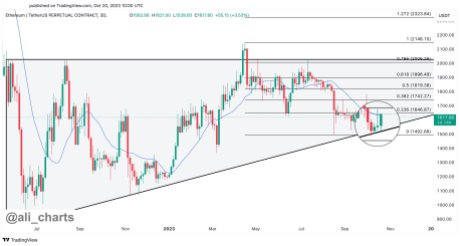
If that happens, Ethereum could hit $1,800 and further rise to $1,900 based on Ali’s predictions. It is worth mentioning that the last time Ethereum hit $1,900 was back in July 2023. A rise to that price again will represent about an %18 increase from its current price of $1,600.
Ali also had something to say about the flagship cryptocurrency, Bitcoin. In a subsequent post, he noted that the crypto token could see a correction to $28,800; a prediction he made based on the TD Sequential from a 4-hour chart.
Bitcoin rose to as high as $30,000 on October 20, with many speculating that a Spot Bitcoin ETF approval could be on the way, something that represents a bullish momentum for Bitcoin and the crypto market in general.
Data from TradingView shows that Bitcoin’s dominance has been on the rise this year, with the token currently boasting over 52% coin dominance in the crypto market. Interestingly, it has steadily risen since the Ethereum Merge occurred.
This is significant considering that many speculated that ‘the Flippening’ could happen after the Merge, where Ethereum overtakes Bitcoin to become the most dominant crypto token. However, that hasn’t happened so far, with Ethereum’s move from proof-of-work to proof-of-work being seen as ‘disastrous’ for the crypto token.
Bitcoin and Ethereum, however, share the podium when it comes to the best-performing assets of the year. Both crypto tokens are said to have outperformed the NASDAQ, S&P500, and Gold. Bitcoin has seen an %80 increase year-to-date (YTD), while Ethereum has seen a %35 increase YTD.
In a recent trend evident on crypto charts, Bitcoin dominance is once again on the rise, prompting some traders and investors to rethink their strategies concerning altcoins. An in-depth analysis of the data, coupled with insights from prominent crypto analysts, unveils several compelling reasons to exercise caution when considering an altcoin purchase at this moment.
Bitcoin’s market dominance – its market cap relative to the entire cryptocurrency market – has historically been a leading indicator of market sentiment. If Bitcoin dominance is increasing, it means that sentiment toward altcoins is waning.
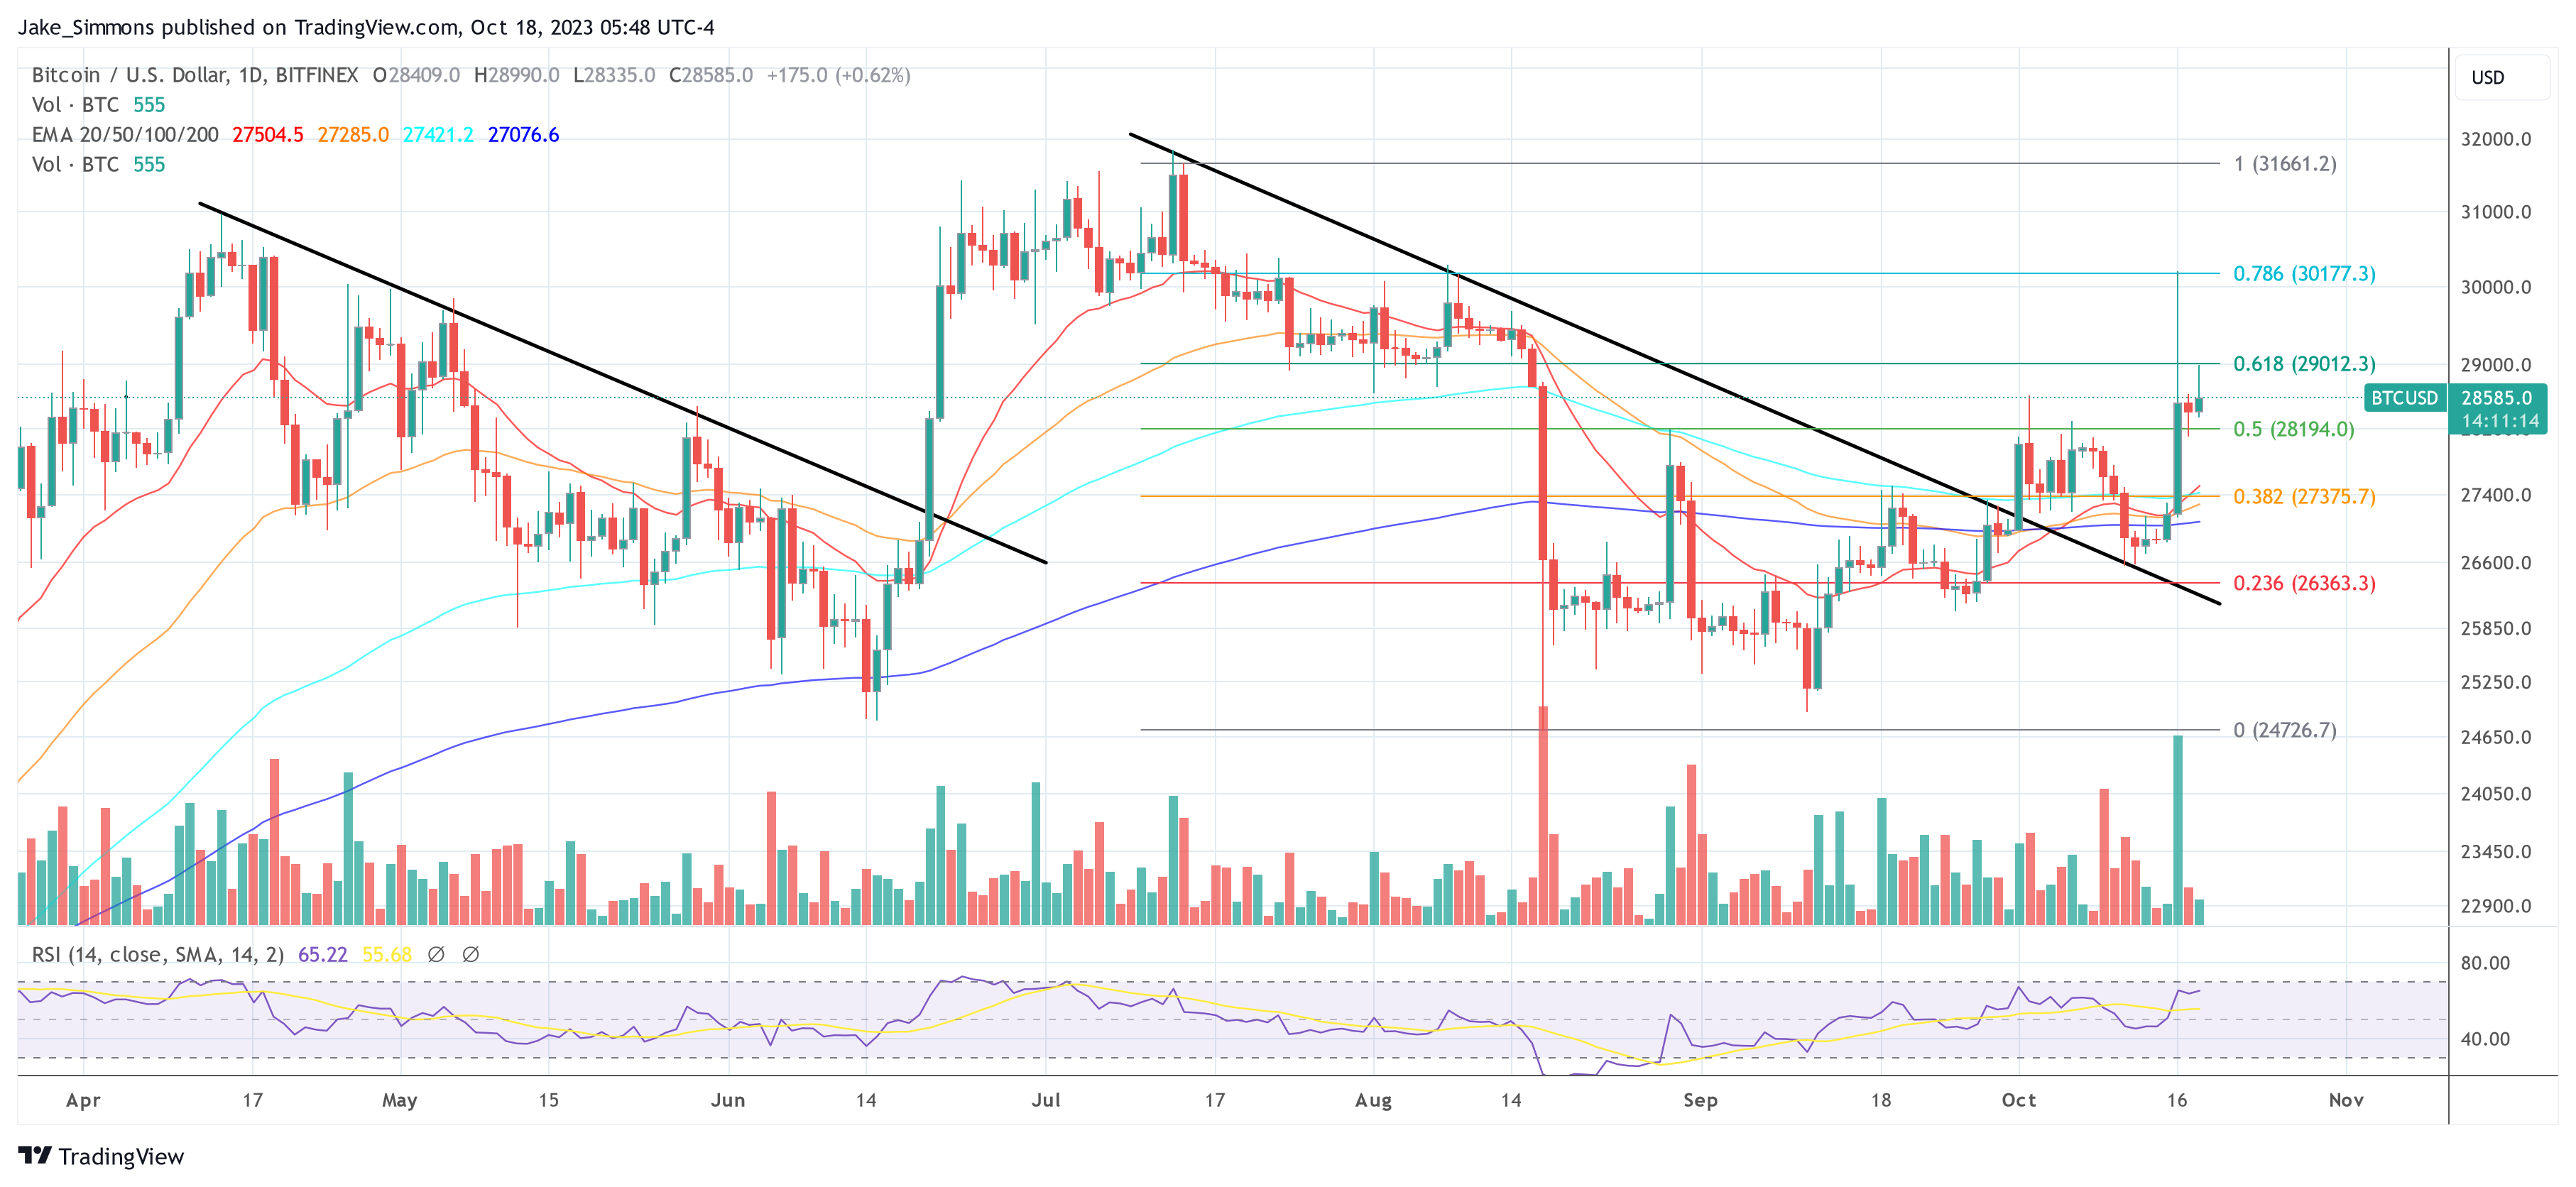
In an analysis today, renowned analyst Rekt Capital has warned of this flashing signal, he shared the following chart and tweeted:
BTC Dominance has left the “retest zone”. Now in the process of entering an uptrend continuation which could see BTC Dominance revisit the 58% mark for the first time in years.
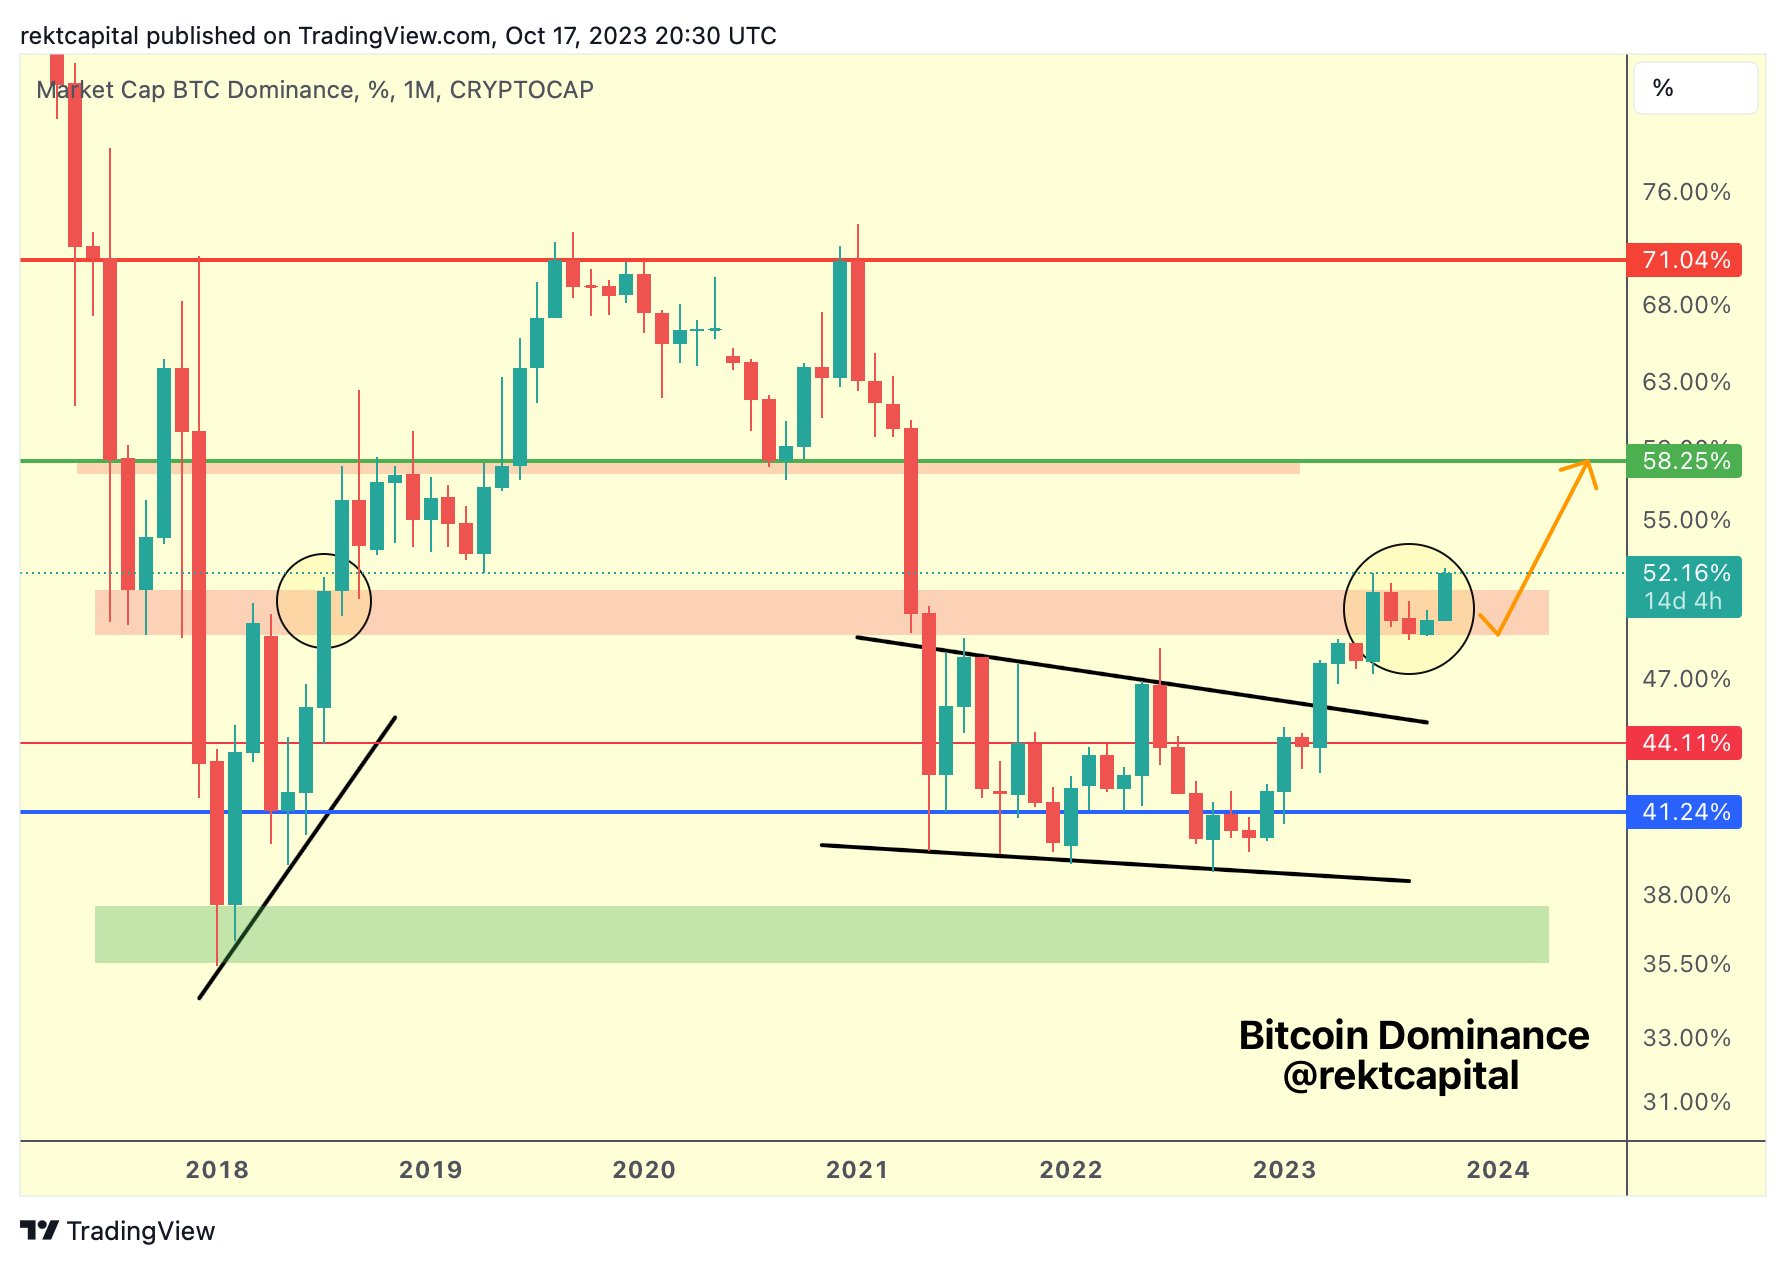
Over the past five months, the Bitcoin dominance saw a consolidation within the ‘retest zone’ after it saw a 10%+ rise since the beginning of the year. BTC dominance pulled back as part of its retest which enabled altcoins to gain some momentum for a short period of time. But, like in mid-2018, BTC is now breaking above the resistance zone, suggesting that 58% could be the next target. Notably, BTC dominance peaked above 71% during the last run in 2021.
When Bitcoin’s dominance rises, it often corresponds to reduced liquidity in the altcoin market. Reduced liquidity can lead to heightened volatility, with price swings potentially wiping out significant portions of invested capital. For investors with a risk-averse profile, such conditions might not be ideal.
Moreover, recent interest appears to be concentrated primarily on Bitcoin. In times of capitulation and boredom, investors often seek the security and liquidity provided by Bitcoin over altcoins. A driving factor for this is that potential catalysts for the crypto market are Bitcoin-specific, like the halving and the potential approval of a spot ETF. As these events play out, Bitcoin will probably continue to outshine altcoins.
Joshua Lim, the former head of derivatives at Genesis Trading and former head of trading strategy at Galaxy Digital, recently weighed in on the ongoing tussle between Bitcoin and Ethereum. “ETH/BTC spot ratio is a major battleground right now,” Lim noted, adding that the rally in BTC/USD was effectively suppressing Ethereum. He highlighted a significant skew in options volume favoring Bitcoin over Ethereum, emphasizing Ethereum’s diminishing allocator interest (options volume skewed 5:1 towards BTC).
Meanwhile, Miles Deutscher, a well-regarded crypto analyst, offered a condensed perspective on the prevailing market sentiment. “We’re in the most difficult market phase… where time capitulation really starts to set in,” Deutscher remarked. He further cautioned retail participants who have been distancing themselves from the market, suggesting that this might be an inopportune moment to do so.
Deutscher added, “Accept that BTC is likely to lead in the early stages of the bull run… it’s not wise to fade BTC during this period.” He recommended a “top-down approach to the market,” emphasizing a strategy that starts with the foundational assets, Bitcoin and Ethereum, before exploring other altcoins.
At press time, BTC traded at $28,585.
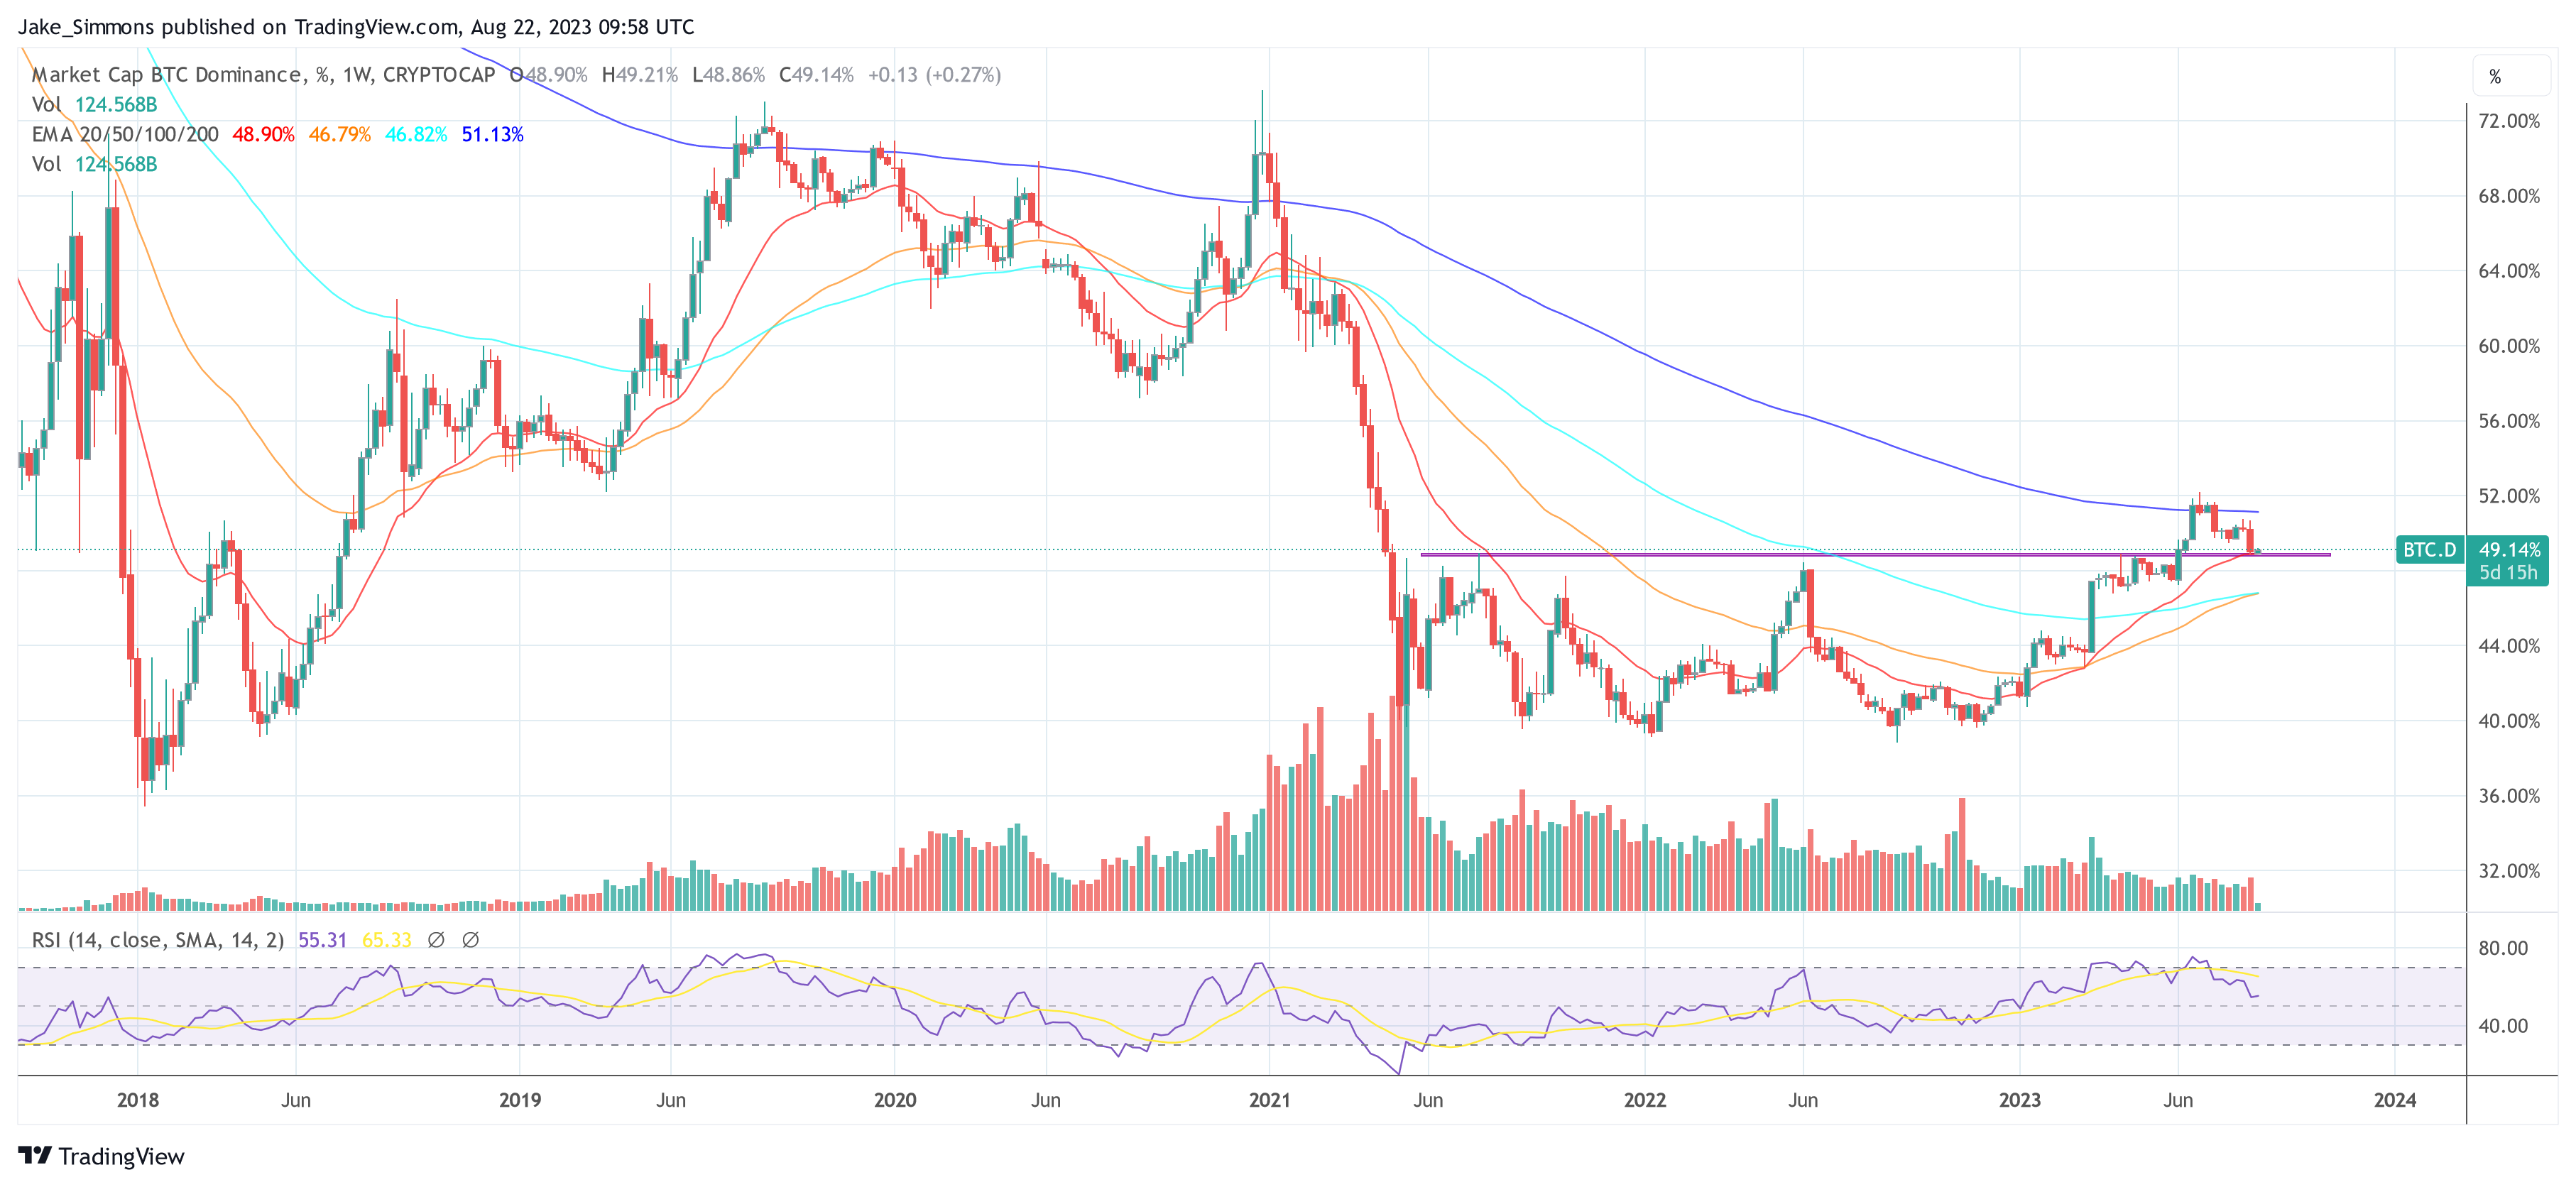
Market observers are closely eyeing the tussle between Bitcoin and its altcoin counterparts. Bitcoin’s dominance, a critical indicator of its market influence relative to the entire crypto market, has reached a pivotal crossroads. This juncture holds the potential to determine whether this year’s trend of Bitcoin outperforming altcoins will persist or if the heralded “altcoin season” is on the horizon.
Bitcoin Dominance (BTC.D) stands as a percentage value that calculates Bitcoin’s market capitalization against the entire global crypto market capitalization. This metric has garnered substantial attention due to its role in reflecting shifts in market sentiment.
Since May 2021, Bitcoin dominance has oscillated within a range of 39% to 49%. However, early June this year marked a breakout from this range, with BTC.D briefly surging above 52% before retracing toward the 49% level in recent weeks. A successful retest of this level could trigger new bullish momentum for BTC against altcoins. On the flipside, a drop below this level could trigger a longer-term drop towards 39%, the range-low which would trigger the start of a new altcoin season.
Daan de Rover, a prominent Crypto YouTuber, emphasizes the importance of understanding the broader market cycle before predicting an “altcoin season.” He argues that the current phase, being the pre-halving stage of the Bitcoin cycle, might not be the optimal time for altcoin investments.
De Rover highlights that a minor retracement in Bitcoin dominance shouldn’t overshadow the overarching upward trajectory, advising that the right time for significant altcoin investments usually occurs after Bitcoin surpasses its all-time high. “We are currently in the pre-halving stage of the cycle, which is generally not the best time to buy altcoins. Bitcoin dominance might drop by 3%, but this is likely just a minor retracement in a larger upward move.” emphasized the crypto YouTuber.
Benjamin Cowen, the founder of ITC Crypto, sheds light on the shifting sentiment, stating, “In June, many said BTC dominance would never break 49% and that alt season was about to begin. Now those same people are dunking on BTC dominance because it had a pullback to 49%. The altcoin casino will remain open until all the money is gone,” indicating that the altcoin market’s potential is far from exhausted.
Michaël van de Poppe, the CEO and founder of MN Trading, delves into historical patterns to discern the optimal time for investing in altcoins. He suggests that the best opportunity emerges around 8-10 months before a Bitcoin halving, during a period of low market confidence. Van de Poppe indicates that the performance of altcoins often hinges on Bitcoin pairs, asserting that they show interest in the markets and initiate rallies when least anticipated.
Highlighting the cyclical nature of the market, van de Poppe references past instances when altcoin strength followed historical patterns despite market variables. He references examples like Ethereum’s cycle low in September ’19 and October ’15, occurring precisely 252 days before Bitcoin halvings, which heralded altcoin bull runs.
The next two or three weeks will probably decide who is right and whether Bitcoin will continue its dominance or if altcoins will make their move and become the favored asset. Investors should therefore watch BTC.D closely.

Bitcoin’s market dominance index has failed to sustain above 50% since April 2021 — so will this time be any different?
ETH’s share of the total crypto market capitalization rose to a one-month high, according to TradingView data.
The bitcoin dominance rate has climbed amid increasing turbulence in crypto markets, and more lately, as the price of bitcoin also reached a nine-month high.

On-chain data shows that altcoin volume dominance is now at the highest level since January 2021, while Bitcoin’s is at its lowest.
As pointed out by an analyst in a CryptoQuant post, Bitcoin’s dominance is just at 16% now. The “dominance by volume” is an indicator that measures the percentage of the total crypto market trading volume that’s being contributed by a specific coin.
When the value of this metric goes up for any crypto, it means that particular crypto is observing a higher amount of activity relative to the rest of the market currently. This suggests that the coin is garnering more interest from investors right now. On the other hand, low values can imply that the crypto is losing mindshare at the moment as its volume percentage is going down.
Now, here is a chart that shows the trend in the dominance by volume for the entire altcoin sector combined (minus Ethereum), as well as for Bitcoin, over the past couple of years:
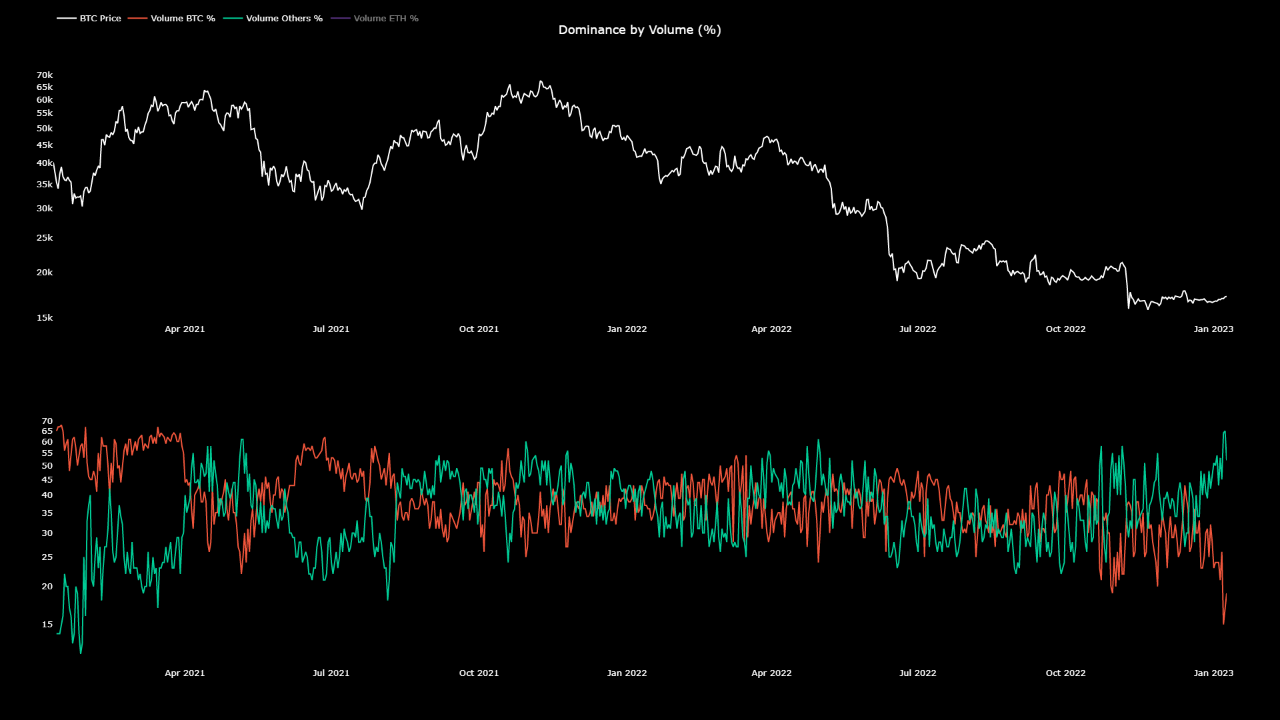
As shown in the above graph, Bitcoin’s dominance by volume has sharply decreased recently and has touched a value of just 16%. This is the lowest value BTC has observed during the last couple of years.
The altcoins (other than Ethereum), on the contrary, have observed their dominance shoot up in the last week or so, as the metric now has a value of 64%. This suggests that BTC has lost its market share to these alts recently.
The quant finds this trend “very concerning,” however. The reason behind that is the fact that whenever rallies have kicked off with altcoins being on top, they haven’t usually lasted for too long, and the prices have quickly come back down.
This can be very clearly seen in the chart. For example, the tops of both the bull rallies of 2021 (the ones in the first and second half of the year) took formation while the altcoins had a higher trading volume dominance than Bitcoin. The latest FTX crash also took place while alts were dominating the market.
It would appear that generally any sustainable and healthy price rallies have only started with the dominance of BTC being higher than these alts. One prominent example is that the July 2021 bottom, which kicked off the second-half bull run of 2021, took place with the Bitcoin volume percentage being higher than altcoins.
The entire market has been rallying in the last week, but if the historical pattern is anything to go by, this uplift may not last too long as the dominance of altcoins is at very high levels right now. This would spell trouble not only for Bitcoin but also for these alts themselves.
At the time of writing, Bitcoin is trading around $17,400, up 3% in the last week.


Data shows the different Altcoin Indexes in the crypto market have taken a beating during the past week as investors have been flipping alts for Bitcoin.
As per the latest weekly report from Arcane Research, the cryptocurrency market has observed a correlated decline recently, but altcoins have taken a more substantial hit. The “Altcoin Indexes” here refer to groups of altcoins divided on the basis of market cap. The most popular indexes include the “large caps,” the “mid caps,” and the “small caps.” As their names already imply, they cover coins from different-sized segments of the sector.
Here is a chart that shows how these market-cap weighted Altcoin Indexes, as well as Bitcoin, have performed during the last month:
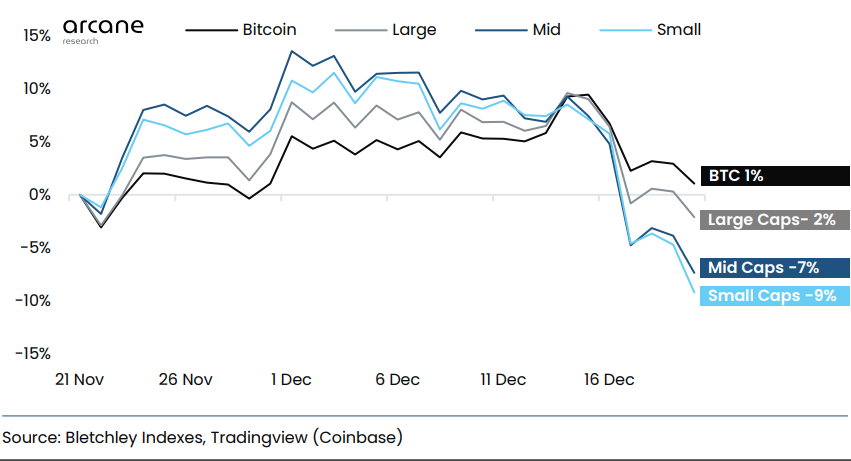
As you can see in the above graph, the cryptocurrency market has shown a strong inner correlation recently, as the altcoins have mostly maintained a close rhythm with Bitcoin during the last 30 days. This correlation was especially apparent in the selloff during the past week, as all the Altcoin Indexes sharply fell in tandem with BTC.
Following this latest decline, the large-cap index is 2% underwater for the month, while BTC is still slightly in the green during this period. Both the mid-caps and the small caps have taken on large losses, as their returns in the last 30 days stand at -7% and -9%, respectively.
This disparity in the performance between the altcoins and Bitcoin suggests that investors have been rotating their investments from the risky alts, back into a relatively-safer option in BTC. It would also appear that the largest altcoins still saw some interest from holders, as their returns haven’t been too far off from BTC.
The data for the “dominance,” a metric that keeps track of the percentages of the total crypto market cap currently being contributed by the various coins, shows that the combined share of Bitcoin and stablecoins has gone up recently:
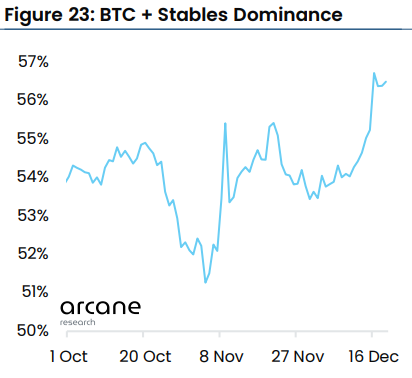
This 1.2% growth in the combined dominance of these two sectors provides further evidence that investors have been preferring to move out of alts lately.
At the time of writing, Bitcoin is trading around $16,800, down 5% in the last week.

Data shows the altcoin dominance by volume on exchanges has now risen to 50%, here’s what happened to Bitcoin the last two times the crypto market saw such a shift.
As pointed out by an analyst in a CryptoQuant post, altcoins have started to dominate after Bitcoin was number one for an entire month.
The relevant indicator here is the “trading volume,” which is a measure of the total amount of coins being traded on centralized exchanges.
The percentage to this total trading volume being contributed by an individual crypto is called its “dominance by volume.”
Here is a chart that shows how the Bitcoin, Ethereum, and altcoin dominances have stacked up against each other during the last month:
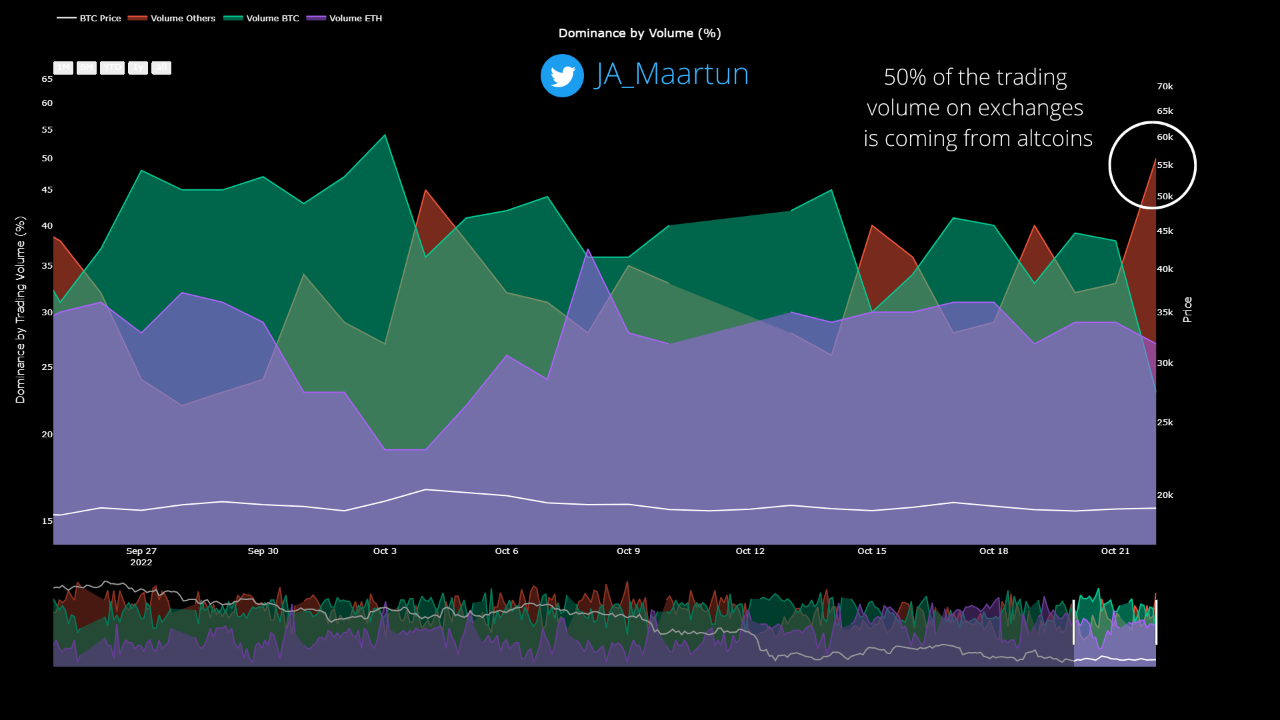
The value of the metric seems to have declined for BTC in recent days | Source: CryptoQuant
As you can see in the above graph, Bitcoin had the largest individual share for much of the past month, but that has changed during the last few days.
BTC’s dominance of the trading volume dropping off has given more room to the altcoins, who now contribute to around 50% of the volumes on exchanges.
As for Ethereum, the crypto’s volume hasn’t observed any significant shifts recently, with the coin’s dominance moving sideways just below the 30% mark.
During the past year, there have been two stretches where altcoins have enjoyed a similar dominance. The below chart shows how the price of Bitcoin behaved while these periods lasted.
Looks like the altcoin dominance reached as high as 60% during these stretches | Source: CryptoQuant
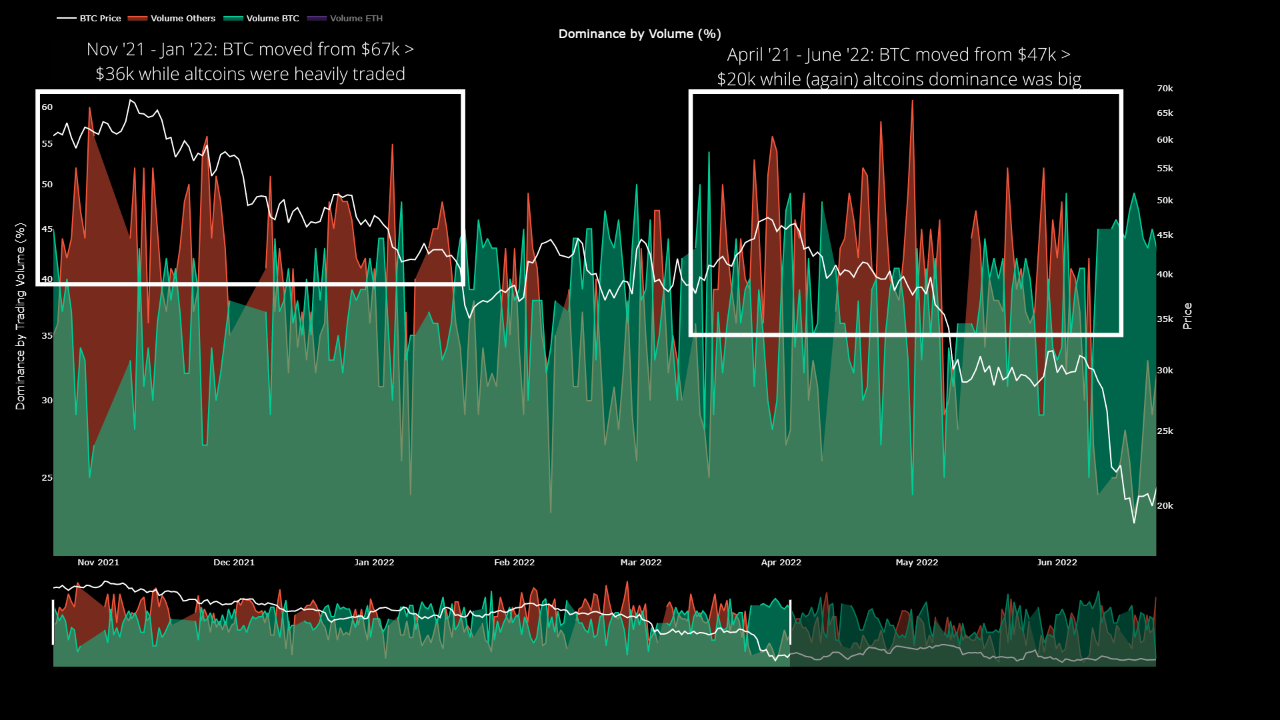
From the graph, it’s apparent that the first of these altcoin dominated periods occurred back between November 2021 and January 2022. At the start of this timespan, the price of Bitcoin was around $67k, but by the end of it the crypto had declined to just $36k.
The second spell of high altcoin volume took place between April and June of this year, and much like the in first stretch, BTC observed a significant drawdown as its price went from $47k all the way down to $20k.
If the altcoins continue their recent surge in trading dominance on exchanges, and a similar trend as during these previous instances follows now as well, then it may prove to be troubling times for Bitcoin.
At the time of writing, Bitcoin’s price floats around $19.3k, down 1% in the last week. Over the past month, the crypto has gained 1% in value.

BTC continues to be stuck in consolidation | Source: BTCUSD on TradingView
Featured image from Traxer on Unsplash.com, charts from TradingView.com, CryptoQuant.com

In this episode of NewsBTC’s daily technical analysis videos, we are analyzing Bitcoin dominance (BTC.D) and how the top cryptocurrency might perform in the near term against altcoins.
Take a look at the video below:
VIDEO: Bitcoin Dominance Versus Altcoins (BTC.D): October 20, 2022
In addition to the video highlights listed below the video, we also analyze BTC.D using the Ichimoku, Average Directional Index, LMACD, and other technical tools.
Bitcoin Outperforms Altcoins During Sideways Phase
On daily timeframes, BTC.D is taking a short pause, but is mostly still bullish according to price action and technical indicators. Dominance is above the Tenkan-sen and Kijun-sen on the Ichimoku, while flipped bullish on the LMACD. The Average Directional Index at the bottom shows that trend strength is weakening on daily timeframes and bulls have the upper hand
Bitcoin is has been outperforming altcoins | Source: ETHUSD on TradingView.com
Related Reading: Bitcoin Price Action Falls Flat | BTCUSD Analysis October 18, 2022
Why Altcoin Season Could Be Over For Some Time
On weekly timeframes using the same tools, we can see that dominance has only just turned bullish against altcoins, and the Average Directional Index is hinting that this trend could soon strengthen. On the Ichimoku, dominance is above the Tenkan-sen, but not the Kijun-sen, making it the next logical target.
Moving to monthly timeframes, Bitcoin dominance is also bullish against alts on the LMACD, and the ADX shows that altcoin season could be cooling off for some time. The Ichimoku isn’t very telling, but much like weekly timeframes, the Kijun-sen above could make for a possible next target.
But the trend could just be beginning | Source: ETHUSD on TradingView.com
Related Reading: A Bullish Week In Bitcoin On The Way? BTCUSD Analysis October 17, 2022
Can Alts Hold Onto 50% Of Crypto Dominance?
Additional trend line TA shows that BTC dominance possibly retested the neckline of a years old inverse head and shoulders pattern, which includes the early 2018 alt season peak that came shortly after Bitcoin topped in December 2017 at $20,000. Shockingly, Bitcoin is trading below that level some five years later.
If Bitcoin dominance does reverse hard against altcoins, the line in the sand to watch for is around 52% dominance. Above there would trigger the first ever monthly buy signal of Bitcoin against altcoins.
Will BTC recapture 50% of crypto market share? | Source: ETHUSD on TradingView.com
Learn crypto technical analysis yourself with the NewsBTC Trading Course. Click here to access the free educational program.
Follow @TonySpilotroBTC on Twitter or join the TonyTradesBTC Telegram for exclusive daily market insights and technical analysis education. Please note: Content is educational and should not be considered investment advice.
Featured image from iStockPhoto, Charts from TradingView.com