Bitcoin Flash Crashes To New H2 2023 Lows, $20,000 Incoming?

Bitcoin, the world’s most valuable cryptocurrency, is free-falling, looking at price action on September 11. From the daily chart, BTC is trading at $25,135, a marginal improvement after dropping to H2 2023 lows of $24,951 minutes earlier following an unexpected dump in the early trading hours of the New York trading session. 

The Bitcoin Sell-Off Takes Form

The crash on September 11 saw the coin drop below the consolidation of the past few trading days with the bearish breakdown, looking at price action, canceling bulls of August 31, and setting an increased selling pressure on August 17. The September 11 sell-off has seen a wide-ranging bear candlestick form.

Even though it continues to print, it has relatively high trading volume, indicating high participation levels. Since the bar has above-average volumes, BTC will likely edge lower in the direction defined by the conspicuous bear bar of August 17, when the coin fell 12%, forcing BTC to trend below the $28,700 support level.

Bitcoin price on September 11| Source: BTCUSDT on Binance, TradingView

Looking at price action, Bitcoin bears are in control and are actively reversing gains posted between June and July 2023. Then, Bitcoin prices rose from around the $20,000 level to as high as $31,800 by the end of July 2023.

Afterward, the coin peaked and began falling as talks of a spot Bitcoin Exchange-Traded Fund (ETF) faded following the Securities and Exchange Commission’s (SEC) decision to put off their decision. 

At spot rates, Bitcoin is down 20% from July 2023 lows but trading at critical Fibonacci retracement levels of the June to July 2023 resistance levels. Even though BTC and crypto prices tend to post deep retracements, the coin may find support at around $25,000.

However, further losses from spot rates in continuation of the August 17 bear bar may see sellers press on rewind gains and force BTC towards June 2023 lows at around $20,000.

The Death Cross On The Bitcoin Chart

Based on technical candlestick arrangements, one analyst notes that the coin closed below the $25,600 mark after the close of last week’s bar. With this dip, the Ichimoku Cloud indicator has printed a “Death Cross.”

Technical analysts note that Bitcoin prices tend to dump when this pattern forms before eventually rebounding over several weeks. Previous instances of the “Death Cross” occurred in June 2021 and January 2022, which saw BTC drop 19% and 23%, respectively. 

BTC "Death Cross": Ichimoku Cloud indicator

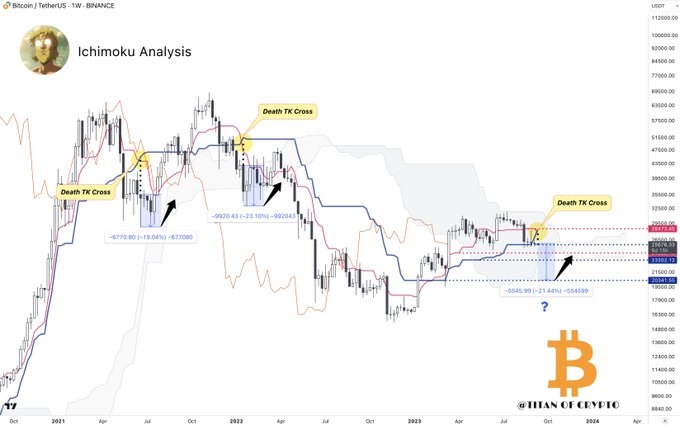
Based on this, if a “Death Cross” prints, BTC may dump by 21%, forcing the coin back to the $20,000 level or June 2023 lows. Before then, BTC has to breach strong support levels at $25,600, $24,000, and $23,200 before retesting the $20,300 zone.

Bitcoin Long-Term Holders Dump As BTC Plunges Under $17K

On-chain data shows Bitcoin long-term holders are dumping their coins as BTC plummets below the $17,000 level.

Bitcoin Long-Term Holder SOPR Spikes Today

As pointed out by an analyst in a CryptoQuant post, some BTC long-term holders seem to have taken profits in the past day. The relevant indicator here is the “Spent Output Profit Ratio,” which tells us whether Bitcoin investors as a whole are selling their coins at a profit or at a loss right now.

When this metric has a value greater than 1, it means the average holder has been moving their coins at some profit recently. On the other hand, values below the threshold suggest the overall market has been realizing some loss. Naturally, SOPR exactly equal to 1 implies that the investors are just breaking-even with their selling.

The “long-term holder” (LTH) group is a Bitcoin cohort that includes all investors who have been holding onto their coins since at least 155 days ago, without having moved or sold them from a single address. Here is a chart that shows the trend in the Bitcoin SOPR specifically for these LTHs during the last 15 days:

Bitcoin Long-Term Holder SOPR

As the above graph shows, the Bitcoin LTH SOPR (EMA16) has observed a sharp spike above 1 during the past day. This means that these holders have harvested some profits today. Statistically, LTHs are the investors least likely to sell at any point, so any dumping from them can have noticeable consequences on the BTC market.

From the chart, it’s apparent that when the indicator last saw such a large spike in its value, the price of the crypto had plunged down shortly after. Interestingly, the latest spike has only come after BTC has plunged down under $17k. Usually, such holders sell for profits during rallies, but here the dumping has come after the bullish momentum has already passed over.

This could be a sign that with all the FUD going around in the market right now, these supposed diamond hands have also broken down and feel bearish about the prospects of Bitcoin at the moment. Such a trend is likely to be negative for the price, and might take the crypto even further lower.

BTC Price

Bitcoin Price Chart

At the time of writing, Bitcoin’s price floats around $16.7k, down 2% in the last week. The above chart displays the trend in the value of the crypto over the last five days.

Bitcoin To Dump Even Lower? This On-Chain Metric May Suggest It

Bitcoin has sharply rebounded back to $20.4k, but is the decline actually over? This on-chain metric may suggest otherwise.

Bitcoin Coin Days Destroyed Metric Has Spiked Up Over The Past Day

As pointed out by an analyst in a CryptoQuant post, BTC Coin Days Destroyed is showing a spike at the moment.

A “coin day” is the amount that 1 BTC accumulates after sitting still on the chain for 1 day. When any coin with some number of coin days shows any movement, its coin days reset back to zero, and are said to be “destroyed.”

The “Coin Days Destroyed” (CDD) indicator measures the total amount of such coin days currently being destroyed on the Bitcoin network.

When the value of this metric is high, it means a large number of dormant coins are being transferred on the chain right now. This kind of trend can be a sign of dumping in the market.

Now, here is a chart that shows the trend in the Bitcoin CDD over the past month:

Bitcoin Coin Days Destroyed (CDD)

The value of the metric seems to have been quite high over the last twenty-four hours | Source: CryptoQuant

As you can see in the above graph, the Bitcoin Coin Days Destroyed has observed a spike during the past day.

In the last few weeks, there have also been two other instances where the indicator has seen surges of similar values.

Following each of these spikes, the price of the crypto has gone down, though the magnitude of the decline has differed between each of them.

Generally, such large values of the CDD suggest movement from the long-term holders (LTHs), a cohort that holds strong onto their coins for extended periods.

Because of this conviction, LTHs tend to accumulate a large number of coin days, which is why when they move to sell their coins, coin days in great quantities get destroyed, and the CDD registers this as a spike.

Thus, it’s possible that it was this dumping from the LTHs that lead to those declines in the previous instances.

In the last 24 hours, the Bitcoin price plunged below $20k right after the CDD saw its surge, but as is apparent from the chart, the metric still hasn’t winded off just yet.

So far, the crypto has actually sharply rebounded back up above $20k, but it remains to be seen if this retrace will be short lived, or if the CDD will start to die off.

Bitcoin Price Chart

BTC has sharply surged up in the last few hours | Source: BTCUSD on TradingView
Featured image from André François McKenzie on Unsplash.com, charts from TradingView.com, CryptoQuant.com

Bitcoin Bearish Signal: Whales Ramp Up Dumping

On-chain data shows the Bitcoin exchange whale ratio has started to sharply rise, a sign that these humongous holders may be beginning to dump.

Whales Are Behind Almost 90% Of Bitcoin Exchange Inflows Right Now

As pointed out by an analyst in a CryptoQuant post, whales may be ramping up dumping, a sign that could be bearish for the price of BTC.

The “exchange whale ratio” is an indicator that measures the ratio between the sum of the top ten Bitcoin transactions to exchanges and the total exchange inflows.

Since the 10 biggest transactions to exchanges usually belong to the whales, this metric can tell us about the relative size of whale inflows to the rest of the market.

When the value of this metric is high (that is, above 85%), it means whales currently make up a very large part of the overall exchange inflows.

Especially high values can suggest that whales are mass dumping at the moment, something that could prove to be bearish for the price of Bitcoin.

On the other hand, the indicator having values lesser than 85% can imply whale selling in the market is at a healthy level right now. During bull runs, the metric usually remains in this range.

Related Reading | Bitcoin Market Plunges Into Extreme Fear, How Scary Does It Get?

Now, here is a chart that shows the trend in the Bitcoin exchange whale ratio (72-hour MA) over the course of 2022 so far:

The indicator’s value seems to have surged up recently | Source: CryptoQuant

As you can see in the above graph, the Bitcoin exchange whale ratio has shot up and is now approaching the 90% mark.

This suggests that whales may be starting to ramp up their dumping right now. Earlier in the month, the ratio exceeded the 90% point and the coin’s price plummeted down to below $26k.

Related Reading | New Data Shows China Still Controls 21% Of The Global Bitcoin Mining Hashrate

If the indicator keeps rising and a similar trend follows this time as well, then more downside could be in store for the cryptocurrency.

BTC Price

At the time of writing, Bitcoin’s price floats around $29.7k, down 6% in the last seven days. Over the past month, the crypto has lost 25% in value.

The below chart shows the trend in the price of the coin over the last five days.

Looks like the price of the crypto has mostly moved sideways over the past few days | Source: BTCUSD on TradingView

Since Bitcoin’s quick rebound back above the $30k level from the crash down to below $26k, the coin hasn’t shown much movement.

At the moment, it’s unclear when BTC may break out of this consolidation that it has been stuck in during the past week.

Featured image from Unsplash.com, charts from TradingVIew.com, CryptoQuant.com

Exchange Whale Ratio Suggests Bitcoin Dump Incoming

On-chain data shows Bitcoin exchange whale ratio has started rising, suggesting that a dump of the crypto may be coming soon.

Bitcoin Whales Now Account For 90% Of Inflow To Exchanges

As pointed out by a CryptoQuant post, the exchange whale ratio has risen above 0.9, implying that dumping may be going on in the market.

The “exchange whale ratio” is an indicator that measures the ratio between the total Bitcoin amount of top 10 transactions to exchanges and the total inflows.

In simpler terms, the metric tells us how the ten largest transactions to exchanges compare with the total amount of coins moving to exchanges.

When the indicator has values lower than 0.85, it means that the ten largest transactions to exchanges (which are assumed to belong to whales) make up for less than 85% of the total Bitcoin inflow amount. Such values have been historically healthy for the market.

On the other hand, when the metric reaches high values, it implies the top ten transactions make up for most of the inflows to exchanges.

Investors usually move their Bitcoin to exchanges for selling purposes. So, this trend may show that whales are currently dumping as they are moving vast amounts of coins to exchanges.

Related Reading | Year 2021 Data Cements Bitcoin As Risk-On Asset

Now, here is a chart that shows the trend in BTC exchange whale ratio over the past few months:

Looks like the value of the indicator has risen recently | Source: CryptoQuant

As you can see in the above graph, the Bitcoin exchange whale ratio has now exceeded values of 0.9. This means that the top ten transactions now make up for more than 90% of the inflows.

Whenever the indicator has reached high values recently, the price of the coin has suffered downtrend soon after, as the chart shows.

Related Reading | Why Did China Ban Bitcoin Mining? Here Are The Seven Leading Theories

This could mean that the current high values of the exchange whale ratio may also prove to be bearish for the price of Bitcoin.

BTC Price

At the time of writing, Bitcoin’s price floats around $47.3k, down 7% in the last seven days, Over the past month, the crypto has lost 16% in value.

The below chart shows the trend in the price of the coin over the last five days.

BTC’s price seems to be consolidating again | Source: BTCUSD on TradingView

Bitcoin looked to have finally broken out of consolidation some days back, but the crypto has now once again fallen back down into the $45k to $50k price range. It’s unclear at the moment when the coin may beat this stagnation, or which direction it may break in.

However, if the exchange whale ratio is anything to go by, more decline in the price of BTC could soon be coming.

Featured image from Unsplash.com, charts from TradignView.com, CryptoQuant.com