Bitcoin Bearish Signal: Exchange Inflows Hit $1.2 Billion In Past Month

On-chain data shows exchanges have registered Bitcoin deposits of about $1.2 billion in the past month.

Bitcoin Exchange Supply Has Seen A Significant Increase In The Past Month

As explained by analyst Ali in a new post on X, exchanges have seen hefty inflows recently. The relevant indicator here is the “balance on exchanges,” which keeps track of the total amount of Bitcoin in the wallets of all centralized exchanges.

When this metric’s value rises, these platforms are receiving a net amount of deposits right now. Generally, one of the main reasons investors would choose to transfer their coins to exchanges from their self-custodial wallets is for selling purposes, so a high amount of inflows can be a sign that a selloff may be taking place in the market.

On the other hand, the indicator’s value going down suggests the holders are withdrawing their coins currently. The investors usually transfer their BTC to self-custodial wallets to hold onto them for extended periods. This kind of behavior, when sustained, could prove to be bullish for the price in the long term.

Now, here is a chart that shows the trend in the Bitcoin balance on exchanges over the past couple of months:

Bitcoin Exchange Balance

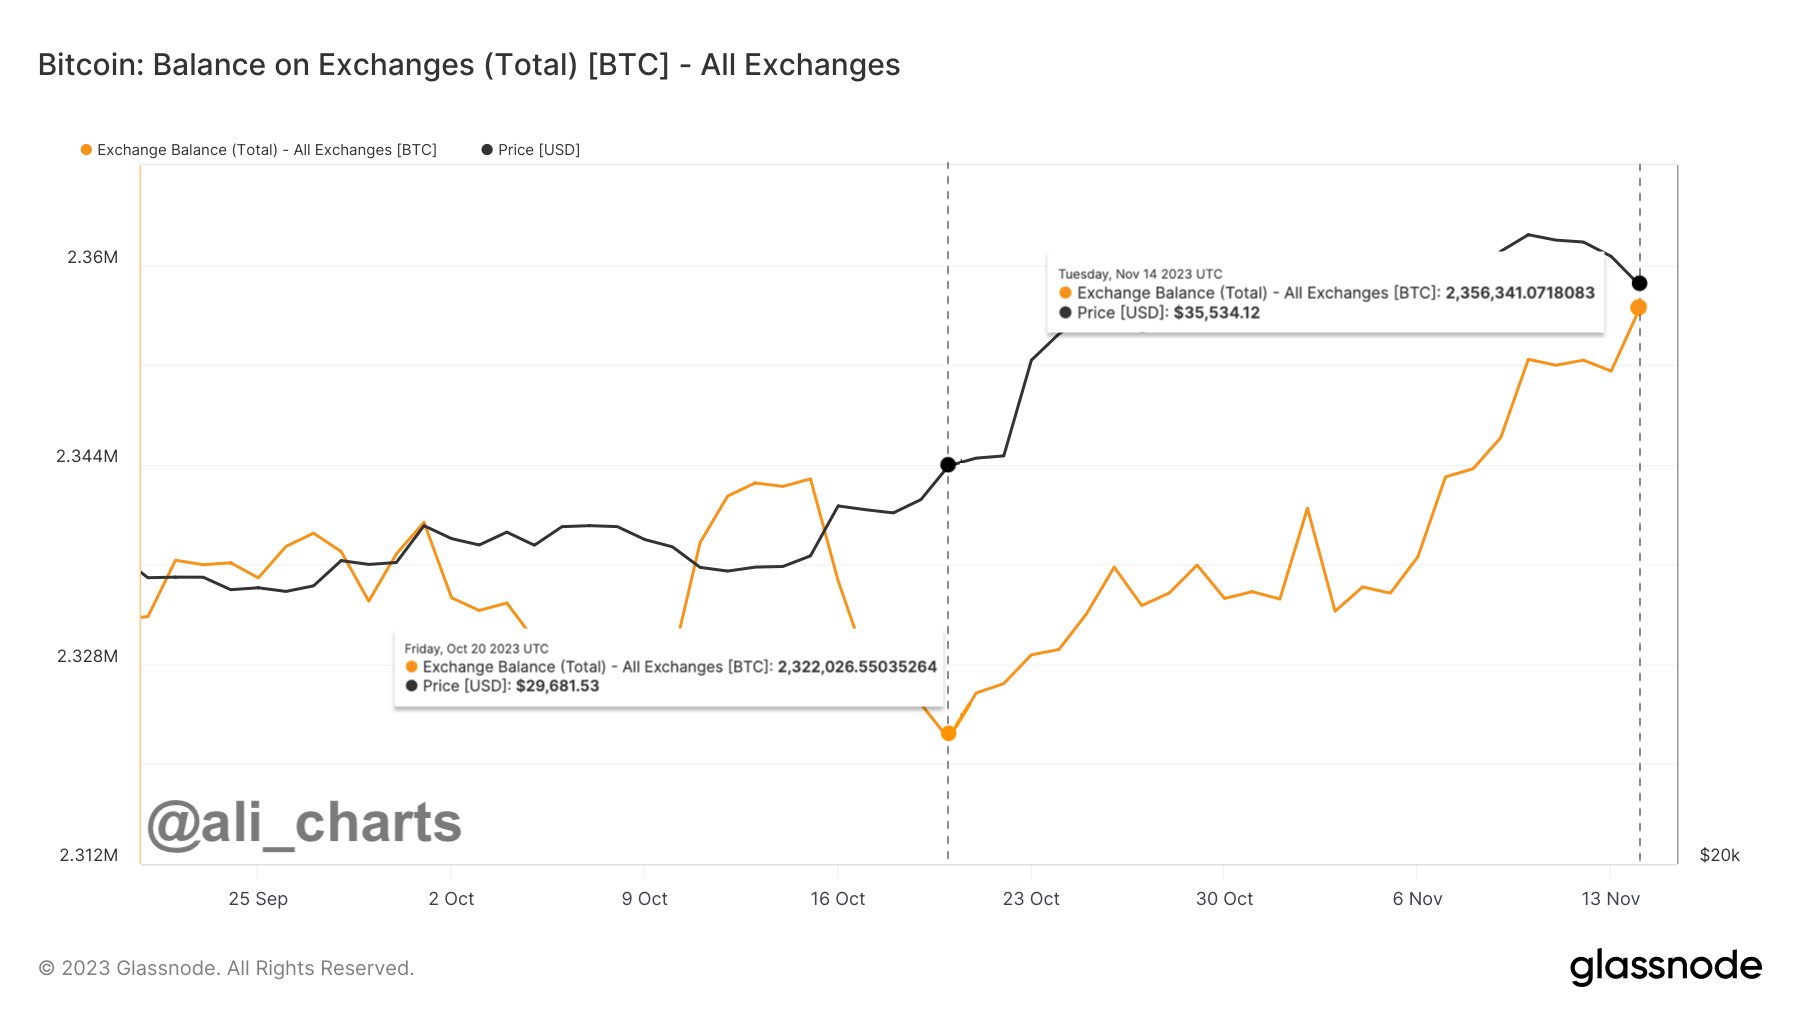
As displayed in the above graph, the Bitcoin balance on exchanges has been rising during the past month, suggesting that a net amount of supply has been constantly flowing into these platforms.

This latest uptrend in the indicator started around when BTC’s recent upward push began, a potential sign that the deposits were being made to take advantage of the profitable exit opportunity.

The metric’s rise had been slow at first, but after Bitcoin’s latest adventure above $37,000, the exchanges have seen a sharp growth in their supply. This elevated selling pressure could be why the asset has slowed down in the last few days.

The exchanges have received inflows of about 34,000 BTC in the past month, equivalent to about $1.2 billion at the current exchange rate. While this is significant selling pressure in the short-term, this amount is still not much in the grand scheme of things, as the total balance on exchanges is of the scale of more than 2.5 million BTC right now.

The recent increased selling pressure in the market is also visible in the form of the number of addresses owned by the whales (entities holding at least 1,000 BTC), as the chart shared by the same analyst shows.

Bitcoin Whales

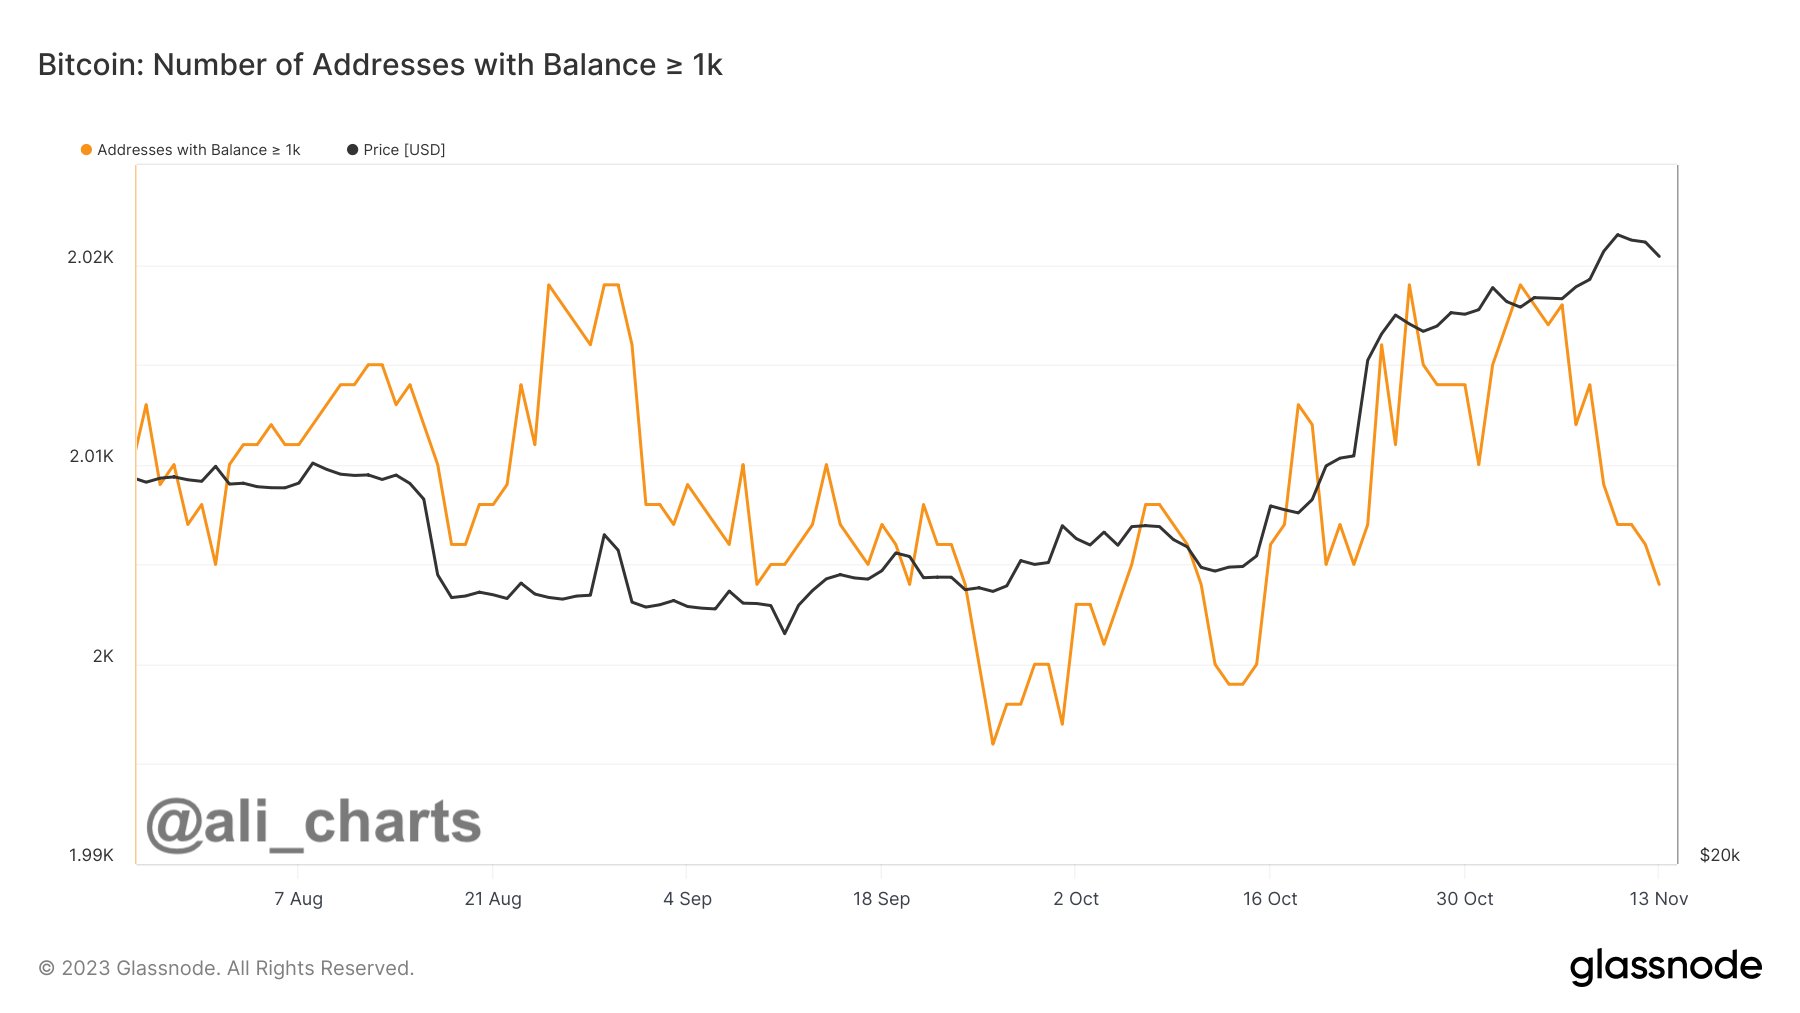
The number of addresses under this cohort has seen a notable decline recently, implying that these humongous investors have been selling off their coins and exiting the sector.

BTC Price

Bitcoin has registered some decline during the past few days as its price is now floating around the $36,000 level.

Bitcoin Price Chart

Bitcoin Surges To $26,700, But Will This Rise Last?

Bitcoin has observed a surge towards the $26,700 level in the past day. Here’s what on-chain data says regarding whether this rise would stay.

Bitcoin Has Broken The $26,700 Level During The Past Day

After a long run of stagnation around and below the $26,000 level, Bitcoin finally seems to be making a steady run above it, as the cryptocurrency has now breached the $26,700 mark.

Bitcoin Price Chart

With this latest rise, BTC is up about 4% during the past week, making the coin the best performer among the top 10 assets by market cap in the sector. After seeing so many fragile attempts at recovery in recent weeks, though, Bitcoin investors might be doubtful whether this rise is here to stay.

On-chain data might provide some hints about this. First, here are how the support and resistance levels look like from an on-chain perspective, according to data from the market intelligence platform IntoTheBlock:

Bitcoin Support Levels

Generally, investors tend to buy more at their cost basis (the price at which they bought their coins) whenever the price dips back to their cost basis from above.

As they had been in profits before this dip, they may believe that the price would rise shortly and that their cost basis could be a profitable entry point for further accumulation.

On the other hand, investors in loss might look forward to the price reaching their cost basis to sell and exit. This can provide resistance to the asset if many investors have the same cost basis as the price it’s trying to test from below.

In the above infographic, the various price levels and the investor concentrations at them are displayed. When IntoTheBlock posted it, the price had been trading at $26,100.

The cryptocurrency is currently mowing through the $26,100 to $26,900 range, which holds the cost basis of a decent amount of investors. Should the asset’s attempts fail, though, the $25,300 to $26,100 range should provide plenty of support, as it currently has a thick concentration of holders.

Bitcoin Exchange Inflows Have Occurred Throughout The Last Month

However, one sign that may be concerning for the asset is that the whales have been making significant deposits to exchanges during the past month, as analyst James V. Straten has pointed out.

Bitcoin Whale Inflows

The above chart shows the data for the Bitcoin exchange netflows only for transfers worth at least $10 million. This graph shows that the metric has mostly had a positive value throughout the past month, meaning that large entities like the whales have been constantly moving coins into these platforms.

As one of the main reasons these investors may transfer to exchanges is for selling purposes, this could indicate that these holders have been preparing for a selloff.

It remains to be seen whether these Bitcoin whale exchange inflows would lead to this short-lived rise or if the market would bash through the selling pressure.

Bitcoin Exchange Inflows Mostly Coming From Loss Holders, Weak Hands Exiting?

On-chain data suggests a majority of the Bitcoin exchange inflows are currently coming from investors holding their coins at a loss.

Bitcoin Exchange Inflow Volume Is Tending Towards Losses Right Now

According to data from the on-chain analytics firm Glassnode, the short-term holders are mostly contributing to these loss inflows. The “exchange inflow” is an indicator that measures the total amount of Bitcoin that’s currently flowing into the wallets of centralized exchanges.

Generally, investors deposit to these platforms whenever want to sell, so a large amount of inflows can be a sign that a selloff is going on in the BTC market right now. Low values of the metric, on the other hand, imply holders may not be participating in much selling at the moment, which can be bullish for the price.

In the context of the current discussion, the exchange inflow itself isn’t of relevance; a related metric called the “exchange inflow volume profit/loss bias” is. As this indicator’s name already suggests, it tells us whether the inflows going to exchanges are coming from profit or loss holders currently.

When this metric has a value greater than 1, it means the majority of the inflow volume contains coins that their holders had been carrying at a profit. Similarly, values under the threshold imply a dominance of the loss volume.

Now, here is a chart that shows the trend in the Bitcoin exchange inflow profit/loss bias over the last few years:

Bitcoin Exchange Inflows

As shown in the above graph, the Bitcoin exchange inflow volume profit/loss bias has had a value above 1 for most of the ongoing rallies that started back in January of this year.

This suggests that most of the exchange inflows in this period have come from the profit holders. This naturally makes sense, as any rally generally entices a large number of holders to sell and harvest their gains.

There have been a couple of exceptional instances, however. The first was back in March when the asset’s price plunged below the $20,000 level. The bias in the market shifted towards loss selling then, implying that some investors who bought around the local top had started capitulating.

A similar pattern has also occurred recently, as the cryptocurrency’s price has stumbled below the $27,000 level. Following this plunge, the indicator’s value has come down to just 0.70.

Further data from Glassnode reveals that the bias of the long-term holders (LTHs), the investors holding their coins since at least 155 days ago, have actually leaned towards profits recently.

Bitcoin Long-Term Holder Inflows

From the chart, it’s visible that the indicator has a value of 1.73 for the LTHs, implying a strong bias toward profits. Naturally, if the LTHs haven’t been selling at a loss, the opposite cohort must be the short-term holders (STHs).

Bitcoin Short-Term Holder Inflows

Interestingly, the indicator’s value for the STHs is 0.69, which is almost exactly the same as the average for the entire market. This would mean that the LTHs have contributed relatively little to selling pressure recently.

The STHs selling right now would be the ones that bought at and near the top of the rally so far and their capitulation may be a sign that these weak hands are currently being cleansed from the market.

Although the indicator hasn’t dipped as low as in March yet, this capitulation could be a sign that a local bottom may be near for Bitcoin.

BTC Price

At the time of writing, Bitcoin is trading around $26,400, down 1% in the last week.

Bitcoin Price Chart

Bitcoin Exchange Inflows Fall To 2020 Levels As Activity Remains Low

Data shows the Bitcoin exchange inflows and outflows have both shrunk recently as market activity has remained low.

Bitcoin Exchange Inflows & Outflows Continue To Decline

As per the latest weekly report from Glassnode, the BTC inflow volumes are now only around $350-$400 million per day. The “exchange inflow” is an indicator that measures the total amount of Bitcoin currently being deposited to centralized exchanges by holders. Its counterpart metric is the “exchange outflow,” and it naturally tracks the volume leaving exchange wallets.

Generally, during periods of high activity in the market, both these indicators rise to high values as a large number of investors make their respective moves. However, the price may react in particular directions depending on which of these metrics is higher at the moment.

Since one of the main reasons why investors use exchanges is for selling purposes, inflows outweighing outflows could be bearish for Bitcoin. On the other hand, outflows being more dominant can suggest there may instead be buying pressure in the market as investors are withdrawing their coins for accumulation.

Now, here is a chart that shows the trend in the Bitcoin exchange inflows and outflows over the last few years:

Bitcoin And Ethereum Exchange inflows and outflows

As shown in the above graph, the Bitcoin exchange inflows and outflows were both at high levels during the past couple of years, with their volumes remaining in the range of multi-billion dollars throughout. At the peak of inflows back in May 2021, between $2.8 billion to $3.5 billion per day was entering exchange wallets.

Recently, however, both the inflows and the outflows have significantly declined. Currently, the inflow volumes are between $350 million to $400 million per day, which are lows not seen since 2020. The outflows haven’t quite shrunk to these levels yet, possibly because of the fact that the collapse of FTX lead to renewed interest in self-custody among investors, which made them withdraw large amounts from centralized platforms.

In the chart, data for the Ethereum exchange flows are also displayed. It seems like before May 2021, the Bitcoin exchange flow dominance was about 70%, which means the combined volumes of Ethereum inflows and outflows made up for 30% of the total between ETH and BTC during the period.

But since May 2021, the share of the Ethereum flows has significantly increased as ETH inflows and outflows dominance is now 42%. This trend suggests that the relative trading interest in ETH has gone up in the last one and a half years, while BTC has lost some mindshare.

Though, in pure numbers, both cryptocurrencies have seen very little market activity recently as both their exchange inflows and outflows are at pretty low values.

BTC Price

At the time of writing, Bitcoin is trading around $17,200, up 3% in the last week.

Bitcoin Price Chart

Bitcoin Coinbase Inflows Spike, Is This Bearish For BTC?

On-chain data shows the Bitcoin inflows to Coinbase have spiked recently, a sign that may turn out to be bearish for the crypto.

Bitcoin Exchange Inflows To Coinbase Register High Values

As pointed out by an analyst in a CryptoQuant post, a total of 20k BTC was transferred to Coinbase recently. The “exchange inflows” is an indicator that measures the total amount of Bitcoin currently being transferred to an exchange (which, in this case, is Coinbase).

When this metric’s value is high, investors send many coins to the exchange right now. Since one of the main reasons holders deposit to exchanges is for selling-related purposes, this trend can have bearish implications for the price of the crypto.

On the other hand, low values suggest investors aren’t making many deposits to the exchange. Such a trend could either be bullish or neutral for BTC, depending on whether the market-wide inflows are also down or not.

Now, here is a chart that shows the trend in the Bitcoin inflows to the crypto exchange Coinbase over the last couple of months:

Bitcoin Exchange Inflow to Coinbase

As shown in the above graph, the Bitcoin exchange inflow to Coinbase has recorded many sizeable spikes in the last couple of weeks. However, as is apparent, there were no significant price moves following any of these large deposits.

These spikes were not that big individually. So if the investors who made these transfers dumped their coins as soon as they completed the transactions, it would make sense that they couldn’t cause any volatility.

However, the quant notes that there could be another scenario here. What if the holders responsible for these inflows haven’t pulled the trigger on the selling yet? It’s not unusual for investors to deposit their coins to exchanges in advance, waiting for the right movements in the price to exit.

All these transfers amounted to around 20,000 BTC entering into Coinbase’s wallets. At the current exchange rate, this stack would be worth around $336 million, which is certainly large enough to cause volatility in the crypto’s price if sold all at once.

“Of course, if it were sold right after the deposit, the situation would be different, but you need to be careful if it hasn’t been sold yet,” cautions the analyst.

BTC Price

At the time of writing, Bitcoin is trading around $16,800, up 1% in the last week.

Bitcoin Price Chart

Bitcoin Bearish Signal: Exchanges Receiving Large Deposits

On-chain data shows the Bitcoin exchange inflows have spiked up over the last day, something that could prove to be bearish for the price of the crypto.

Bitcoin Exchange Inflow Mean Has Observed Two Spikes In The Past 24 Hours

As pointed out by an analyst in a CryptoQuant post, the two exchange inflow mean spikes amounted to around 21 BTC and 17 BTC respectively.

The “exchange inflow mean” is an indicator that measures the mean amount of Bitcoin being transferred to the wallets of centralized exchanges per transaction.

It’s different from the normal inflow metric in that instead of simply measuring the total number of coins flowing into exchanges, it tells us how large the average transaction to exchanges has been recently.

When the value of this indicator is high, it means investors are depositing a lot of BTC to exchanges right now. Such a trend can be a sign of dumping in the market.

On the other hand, low values of the metric suggest there isn’t much selling pressure in the Bitcoin market at the moment.

Now, here is a chart that shows the trend in BTC exchange inflow mean over the last few days:

Bitcoin Exchange Inflow Mean

Looks like the value of the metric seems to have been quite high recently | Source: CryptoQuant

As you can see in the above graph, the Bitcoin exchange inflow mean has seen a couple of spikes in the last 24 hours.

The first of these measured to around 21 BTC, which means that at the time it occurred the average transaction going into exchanges involved 21 coins. Similarly, the second spike had the mean inflow value touch more than 17 BTC.

Since these spikes have come as the price of the crypto has surged up, they could be coming from whales trying to profit from the pump.

In the past, the occurrence of multiple Bitcoin exchange inflow mean spikes larger than 15 BTC in value has generally been followed by a dip in the crypto’s price.

Below is another chart that the same quant posted earlier in the month, which displays a recent instance of this kind of trend in the inflow mean.

Bitcoin Bearish

The exchange inflow mean spikes lead to the price going down | Source: CryptoQuant

BTC Price

At the time of writing, Bitcoin’s price floats around $20.6k, up 8% in the last week. Over the past month, the crypto has gained 6% in value.

The below chart shows the trend in the price of the coin over the last five days.

Bitcoin Price Chart

The value of the crypto seems to have surged up recently | Source: BTCUSD on TradingView
Featured image from Hans-Jurgen Mager on Unsplash.com, charts from TradingView.com, CryptoQuant.com

Number Of Bitcoin Addresses Sending BTC To Exchanges Continues To Drop

With the decline in the price of bitcoin, there has been a lot of selling from investors. This sell-off trend has contributed to the further decline of the digital asset’s prices in recent times. However, as the bear run continues, there has been a marked reduction in the amount of BTC being sold off by the holders. The decline in the number of addresses that are sending their coins to centralized exchanges speaks volumes about this.

Sellers Beginning To Cool Off

Over the last year, the number of bitcoin addresses that had been sending BTC to centralized exchanges, presumably to sell their holdings, had grown incredibly. But had started to decline in recent weeks as the sell-offs had begun to subside.

According to Glassnode, the number of addresses that were sending bitcoin to exchanges had fallen to a new 22-month low on Thursday. The number had sat around 4,445.369. But on Friday, another consecutive decline was recorded. This time around, the number of addresses that were sending BTC to exchanges was 4,443.202.

Bitcoin falls to mid-$18,000s | Source: BTCUSD on TradingView.com

It is a far cry from the more than 6,000 wallets that were sending BTC to centralized exchanges in the middle of 2022. While the increase in wallets sending BTC to exchanges had correlated with the price decline back in Q2 2022, the opposite is now the case, with the decline coinciding with the drop in the price of bitcoin.

What This Means For Bitcoin

Naturally, data like this points to the fact that there is a growing accumulation trend among investors but not every metric point to this. An example is the HODLer net position change that was recorded by Glassnode on Friday.

Instead of being on the rise as would be expected in an accumulation trend, the HODLer net position change continues to decline. It has now reached a new one-month low of 51,997.708. This shows that even if there might be a sell-off fatigue, it is still enough to put pressure on the price of the digital asset.

The amount of active bitcoin supply is always on the rise. It has now touched a new one-month high of 718,437.728 BTC. It is up slightly from the previous September 11th high of 717,097.427 BTC, still giving credence to the fact that sell-offs continue. 

Bitcoin’s price is also succumbing under the sell pressure. The digital asset is currently trading under $19,000 and doesn’t show any indicators of a significant recovery. 

Featured image from CNBC, charts from TradingView.com

Follow Best Owie on Twitter for market insights, updates, and the occasional funny tweet…

Bitcoin Bearish Signal: Whales With 1k-10k BTC Depositing To Exchanges

On-chain data shows Bitcoin exchange inflows from whales holding between 1k to 10k BTC have spiked up recently, a sign that can be bearish for the price of the crypto.

Bitcoin Exchange Inflows Spike Up Following Rally Above $24k

As pointed out by a CryptoQuant post, the BTC whales with between 1k to 10k BTC seem to have sent a large stack to exchanges recently.

The “exchange inflow” is an indicator that measures the total amount of Bitcoin being transferred to wallets of all centralized exchanges (both spot and derivatives).

When the value of this metric spikes up, it means a large number of coins are being deposited to exchanges right now. Depending on how many of these are being moved to spot exchanges, such a trend can be bearish for the price of BTC as investors usually send to these exchanges for selling purposes.

On the other hand, low values of the indicator suggest there is little selling going on in the market at the moment. Therefore, this kind of trend can be neutral or bullish for the value of the coin.

Now, here is a chart that shows the trend in the Bitcoin all exchanges inflows over the last few days:

The value of the metric seems to have spiked up recently | Source: CryptoQuant

As you can see in the above graph, the Bitcoin all exchanges inflows have registered large values during the last couple of days. The latest spike has come shortly after the BTC price surged above $24k.

The chart actually shows a modified version of the indicator, called the “exchange inflow – spent output value bands,” which tells us what contribution to the total inflows is coming from each of the different sized holders in the market.

It looks like the investors holding 1k to 10k BTC had an especially large movement to exchanges in the last two days. Holders belonging to this group are the whales, so the current trend can suggest whales may be planning to dump right now.

However, as mentioned earlier, the indicator takes into account inflows for both spot and derivatives exchanges. A large part of the latest inflows went to the derivatives exchanges, which implies whales may have been hedging against their spot positions.

Nonetheless, a sizeable part of the total inflows did go to spot exchanges, so some selling may still be going on in the market from these whales.

BTC Price

At the time of writing, Bitcoin’s price floats around $23.8k, up 2% in the past week.

Looks like the value of the crypto has come down during the past day | Source: BTCUSD on TradingView
Featured image from Thomas Bonometti on Unsplash.com, charts from TradingView.com, CryptoQuant.com

Bitcoin Bullish Signal: Whale Exchange Inflows Remain Down

On-chain data shows the Bitcoin whale exchange inflows have remained down after hitting a local peak a while back, a sign that could prove to be bullish for the price of the crypto.

Bitcoin Whales Aren’t Sending Many Coins To Exchanges Right Now

As pointed out by an analyst in a CryptoQuant post, the BTC inflows made a peak recently and have remained down since, a signal that the bottom may be in for the coin.

The “all exchanges inflow” is an indicator that measures the total amount of Bitcoin being transferred to wallets of all centralized exchanges.

When the value of this metric is elevated, it means a large number of deposits are being made on exchanges right now. Since investors usually send their coins to exchanges for selling purposes, such values of the indicator can be bearish for the price of BTC.

On the other hand, low inflow values suggest a healthy amount of selling may be going on in the market right now. Depending on whether the outflows (the opposite metric) are raised or not, this kind of trend can be either bullish or neutral for the value of the crypto.

Now, here is a chart that shows the trend in the Bitcoin all exchanges inflows over the last few years:

The value of the metric seems to have been low in recent days | Source: CryptoQuant

As you can see in the above graph, the Bitcoin exchange inflows hit a peak a while back, following which the crypto sunk down below $18k.

The chart also includes the data for two other indicators, the “top 10 whale inflows” and the 7-day average of the total inflows.

The former metric gives the sum of the ten largest deposits going to exchanges. These transfers are generally assumed to be from whales, so that this indicator gives us an idea about the current selling behavior of these humongous holders.

It looks like both the whale inflows and the 7-day mean total inflows have made a similar pattern in recent weeks.

Historically, the trend of a sharp inflow spike followed by low values has been a sign of bottom formations for the crypto.

As whales, and other investors as well, aren’t putting too much selling pressure on the market right now, it’s possible that Bitcoin may see a bullish outcome in the coming future.

BTC Price

At the time of writing, Bitcoin’s price floats around $23.2k, down 5% in the past week.

Looks like the value of the crypto has been consolidating sideways recently | Source: CryptoQuant
Featured image from Sandra Seitamaa on Unsplash.com, charts from TradingView.com, CryptoQuant.com

Bitcoin Falls Below $30k As 10k BTC Flow Into Gemini

On-chain data shows crypto exchange Gemini observed around 10k BTC in inflows yesterday as Bitcoin’s price declined below $30k.

Bitcoin Exchange Inflows Spike Up As BTC Price Falls Down

As pointed out by an analyst in a CryptoQuant post, selling on exchanges like Gemini, Binance, and Huobi looks to have been behind the latest drop in the crypto’s price.

The “exchange inflow” is an indicator that measures the total amount of Bitcoin moving into wallets of all exchanges.

When the value of this metric surges up, it means exchanges are receiving a high amount of coins at the moment.

Such a trend can be bearish for the value of the coin as investors usually deposit their crypto to exchanges for selling purposes.

Related Reading | Bitcoin Observes Longest Stretch Of Extreme Fear Since April 2020

On the other hand, low values of the inflow can suggest that a healthy amount of selling may be going on in the market. Depending on the value of the outflows (the opposite indicator), this kind of trend can prove to be either neutral or bullish for the price of BTC.

Now, here is a chart that shows the trend in the Bitcoin exchange inflows over the past couple of weeks:

It seems like Gemini saw the heaviest amount of inflows yesterday | Source: CryptoQuant

As you can see in the above graph, the Bitcoin exchange inflow spiked up to high values yesterday as the price of the crypto slipped down below $30k.

In the chart, the quant has also included data for the individual contributions from crypto exchanges Binance, Huobi, and Gemini, to the total inflows.

Related Reading | Bitcoin LTHs Realized Significant Losses Recently, Final Capitulation Here?

It looks both Binance and Huobi saw around 1k to 1.2k BTC in inflows yesterday, while Gemini observed a huge spike of more than 10k BTC.

This would suggest that out of all the exchanges, Gemini saw the heaviest Bitcoin selling over the past twenty-four hours.

BTC Price

At the time of writing, Bitcoin’s price floats around $29.7k, up 5% in the last seven days. Over the past month, the crypto has lost 23% in value.

The below chart shows the trend in the price of the coin over the last five days.

Looks the value of the crypto has plunged down over the last twenty-four hours | Source: BTCUSD on TradingView

Bitcoin looked to be gaining some footing over the $31k mark over the last few days for the first time in almost a month, but yesterday the price once again tumbled down.

At the moment, it’s unclear whether the selloff is over, or if the crypto will experience further decline in the near term.

Featured image from Unsplash.com, charts from TradingView.com, CryptoQuant.com

Bitcoin Exchange Inflows Hit Three-Month High As Market Braces For More Downside

Bitcoin exchange inflows have been on the rise recently. Although there was a period where it had tapered off, it had continued to rise once more. The culmination of this has been a massive inflow into various centralized exchanges, presumably for investors to sell off their coins. Now the inflows have hit a new three-month high, painting a rather grim picture for the future of the digital asset.

Inflows Take Over

Bitcoin investors have been dumping their holdings since the digital asset started its descent from its $69,000 all-time high. Although outflows had rivaled inflows, the rate at which BTC was flowing into exchanges remained a cause for alarm. 

In a chart posted by Glasnode Alerts, it shows how inflows have been moving in relation to price. Following the historical pattern of inflows increasing when the price is down, the market had seen more and more bitcoins moved onto exchanges for sale. 

Related Reading | APE Takes A Beating As It Sheds 50% Of Its Price

The exchange inflow volume on a 7-day moving average touched a three-month high of 1,729.605 BTC flowing into exchanges. This inflow had ramped up after bitcoin had lost its footing above $36,000, a critical support level.

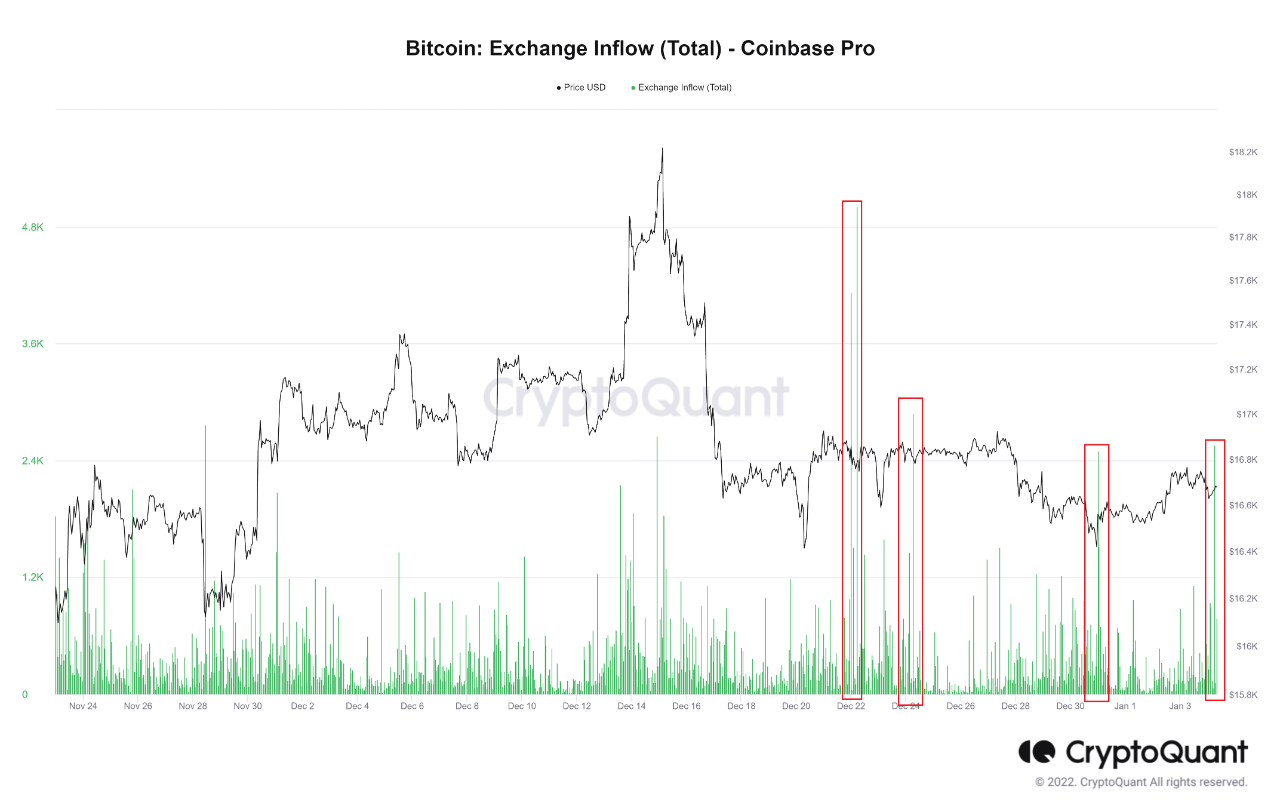
📈 #Bitcoin $BTC Exchange Inflow Volume (7d MA) just reached a 3-month high of 1,755.021 BTC

Previous 3-month high of 1,729.605 BTC was observed on 08 May 2022

View metric:https://t.co/1S6EbDkdOO pic.twitter.com/8kSJPOLJXW

— glassnode alerts (@glassnodealerts) May 9, 2022

Whales Exiting Bitcoin

Usually, when exchange inflows get this high, it signals that whales are getting out of the digital asset. This is no surprise given the low sentiment that has plagued the market in recent times. Going by the charts, if this does descend into another full-blown bear market, then investors could be dealing with low prices for another year. 

Naturally, whales who have a large stake in the market are trying to exit in order to avoid more losses. This is backed by the bitcoin’s relative unrealized profit hitting a new 18-month low of 0.462. This means that investors are taking a profit. Coupled with the number of bitcoin addresses in profit reaching a new 18-month low, it is no surprise that more holders are cashing out their gains.

BTC price slips to $33,000 | Source: BTCUSD on TradingView.com

Interestingly though, small investors seem to be doubling down on their holdings. The number of addresses holding 0.01 BTC on their balances had touched a new all-time high on May 8th. This number now sits at 9,977,201 bitcoin addresses holding more than 0.01 BTC on their balances. 

Related Reading | Bitcoin Carnage Continues As BTC Disintegrates To $34K

Daily transactions have also held up in the space. Data shows that it continues to trend at a daily average with 233,892 transactions recorded on May 8th. This came out to a dollar figure of about $30 billion which has been the average since the beginning of the year.

Nevertheless, the declining price of bitcoin continues to strike fear in the hearts of investors. At the time of this writing, BTC is dangerously close to falling into the $32,000 territory with a trading price of $33,100.

Featured image from The Indian Express, chart from TradingView.com

Bitcoin Slips Below $33k As Exchange Inflows Reach Highest Value Since July 2021

Bitcoin on-chain data shows exchanges this week have observed the largest inflows since July 2021, taking the price of the crypto to $33k.

Bitcoin Exchange Inflows Spike Up To Highest Value Since July 2021

As pointed out by an analyst in a CryptoQuant post, the BTC exchange inflows have observed a sharp increase recently.

The “all exchanges inflow” is an indicator that measures the total amount of Bitcoin moving into exchange wallets.

When the value of this metric rises, it means an increasing number of coins are moving into exchanges. Such a trend may be bearish for the price of the crypto as investors usually deposit their BTC to exchanges for selling purposes.

Related Reading | TA: Ethereum Bears Aim Big After Recent Breakdown Below $2.5K

On the other hand, low values of the indicator suggest that not much selling on exchanges is going on right now. This trend, when prolonged, can prove to be bearish for the value of the coin.

Now, here is a chart that shows the trend in the Bitcoin exchange inflows over the past several months:

Looks like the value of the metric has shot up recently | Source: CryptoQuant

As you can see in the above graph, the 7-day average value of the Bitcoin exchange inflow has observed a spike this week.

The current value of the indicator is the highest it has been since July of last year, around when the coin bottomed around $29k.

Related Reading | Terra Beats Tesla As Second-Largest Corporate Bitcoin Holder After $1.5B Purchase

Looking at the chart, it seems like in the last few months whenever the inflow has spiked up, the price has also declined with it.

This time as well it looks like the heavy selling on exchanges has played a part in the current plunge of Bitcoin below $33k.

The metric’s value still looks to be rising, so it’s possible the coin may observe further decline in the near term, until the 7-day MA inflow tops out.

BTC Price

At the time of writing, Bitcoin’s price floats around $32.9k, down 14% in the last seven days. Over the past month, the crypto has lost 22% in value.

The below chart shows the trend in the price of the coin over the last five days.

The price of BTC seems to have plummeted down over the last few days | Source: BTCUSD on TradingView

Bitcoin’s seemingly endless consolidation looks to have finally broken down as the coin has observed some sharp downtrend in the past week.

At the moment, it’s unclear whether the crypto is nearing a bottom or if more decline is coming. If the inflows continue to increase, then the latter scenario is more likely to play out.

Featured image from Unsplash.com, charts from TradingView.com, CryptoQuant.com

Bitcoin Short-Term Holders Were Behind The Selloff To Below $36k

On-chain data shows Bitcoin short-term holders seem to have been behind the latest selloff that has taken the price of the crypto below $36k.

Bitcoin Investors Holding Coins Aged Between 1 Day And 6 Months Sold Big Yesterday

As pointed out by an analyst in a CryptoQuant post, short-term holders seem to have sold the heaviest during the recent selloff.

The relevant indicator here is the “exchange inflow,” which measures the total amount of coins moving into exchange wallets.

A modification of this metric is the “exchange inflow spent output age bands.” it tells us how much the different Bitcoin holder groups are contributing to the inflow.

The various groups are divided based on how many days the investors held their coins before transferring them to the exchange.

The 1-day to 6-month coin age group is generally considered the “short-term holders” (STH). This cohort is usually the likeliest to sell their coins.

All investors holding their Bitcoin for longer periods of time are the “long-term holders” (LTH). Now, here is a chart that shows the trend in the below 6-month and between 6 to 18-month age group inflows over the last few months:

Looks like STH inflows spiked up recently | Source: CryptoQuant

As you can see in the above graph, the 1-day to 6-month coin age group sent a large amount of coins just yesterday.

The inflow spike amounted to more than 60k coins being transferred by this group. Investors usually send their Bitcoin to exchanges for selling purposes, hence these coins took part in the selloff that has now taken the price below $36k.

Related Reading | One Coin, Two Trades: Why Bitcoin Futures And Spot Signals Don’t Match Up

The 6-month to 18-month group, on the other hand, doesn’t seem to have moved too many coins over the past day.

The older Bitcoin LTH groups have also not shown much activity recently. The below chart shows the trend in their inflows.

The 1.5-year to 3-year cohort only looks to have sold around 500 BTC yesterday | Source: CryptoQuant

From these trends, it seems like the only investors that took part in the selling yesterday were the short-term holders, who are generally the more fickle ones. The long-term holders still look to be holding strong.

Related Reading | Bitcoin Long Squeeze Incoming? Funding Rates Surge Up

BTC Price

At the time of writing, Bitcoin’s price floats around $35.8k, down 8% in the last seven days. Over the past month, the crypto has lost 21% in value.

The below chart shows the trend in the price of the coin over the last five days.

The price of Bitcoin seems to have plummeted down over the past day | Source: BTCUSD on TradingView

Featured image from Unsplash.com, charts from TradingView.com, CryptoQuant.com

Bitcoin Bearish Signal: Exchanges Observe Huge Inflow From Long-Term Holders

On-chain data shows exchanges have received a huge Bitcoin inflow spike from long-term holders, a sign that could be bearish for the price of the crypto.

Investors Holding Bitcoin Since 12 Months To 18 Months Ago Transfer A Huge Amount To Exchanges

As pointed out by an analyst in a CryptoQuant post, some long-term investors holding on to their coins since between a year to a year and a half recently sent big inflows to exchanges.

The relevant indicator here is the “exchange inflow,” which measures the total amount of Bitcoin moving to centralized exchange wallets.

When the value of this indicator shows a large spike, it means investors have just deposited a lot of coins to exchanges. Such a trend is usually bearish for the price of the crypto as holders usually transfer to exchanges for selling purposes.

On the other hand, small values of the metric may show normal market behavior and that there isn’t largescale dumping going on at the moment.

Related Reading | Bitcoin Taker Buy/Sell Volume Shows “Buy” Signal As BTC Gears Up For Rally

A modified version of the Bitcoin exchange inflow shows only transfers from those investors who had been holding on their coins since 12 months to 18 months ago. Here is the chart for it:

Looks like a large amount of coins were deposited by these long-term holders recently | Source: CryptoQuant

As you can see in the above graph, the value of the indicator observed a huge spike just recently. This means that long-term holders within the age range of 12 to 18 months transferred a big number of coins to exchanges, possibly for selling them.

In the chart, the quant has also marked the previous times this kind of trend took place. It looks like shortly following such a spike, the price has always observed a decline.

Related Reading |Bitcoin Closes 1st Green Month After 3 Reds, What History Says May Happen

Since a spike has also occurred recently, the price of Bitcoin may be in for a similar plunge soon, if the pattern continues to hold.

However, in certain cases, it’s also possible the value of the coin doesn’t see any effects from this. An example of such a situation would be if an outflow of similar or larger amount took place soon.

BTC Price

At the time of writing, Bitcoin’s price floats around $43.3k, up 23% in the last seven days. Over the past month, the crypto has gained 17% in value.

The below chart shows the trend in the price of the coin over the last five days.

Following the sharp surge a few days back, the price of Bitcoin seems to have moved sideways | Source: BTCUSD on TradingView
Featured image from Unsplash.com, charts from TradingView.com, CryptoQuant.com

Bitcoin Investors Haven’t Responded To Russia-Ukraine War With Large Inflows (Yet)

On-chain data shows Bitcoin investors haven’t moved large amounts to exchanges in response to the Russia-Ukraine war (at least for now).

Bitcoin Exchange Reserve Doesn’t Spike Up Following The War Breakout Between Russia And Ukraine

As pointed out by an analyst in a CryptoQuant post, the BTC reserve hasn’t moved significantly after the news of the Russia-Ukraine war.

The “all exchanges reserve” is an indicator that measures the total amount of Bitcoin sitting in wallets of all exchanges.

When the value of this metric rises, it means exchanges are receiving net inflows as investors deposit their coins. Such a trend is usually bearish for the price of the crypto as holders generally transfer their coins to exchanges for selling them.

On the other hand, a falling reserve implies exchanges are observing more outflows at the moment. This kind of trend can be bullish as holders usually withdraw their coins for hodling purposes.

Related Reading | Quant Explains How Bitcoin NUPL Can Help Predict Bull Cycles

Now, here is a chart that shows the trend in the Bitcoin exchange reserve over the past few days:

Looks like the value of the indicator hasn’t seen any significant change over the last day | Source: CryptoQuant

As you can see in the above graph, the Bitcoin exchange reserve hasn’t increased that much since the start of the Russia-Ukraine war.

The price, though, has still observed a very sharp plunge down. This means that the majority of the sellers have to be those who were already keeping their coins on exchanges, planning in advance to sell them in case war broke out.

Related Reading | What’s Intel CEO Pat Gelsinger Saying While Promoting The Bitcoin Mining Chip?

Large inflows are common following big bearish news like this one. However, there haven’t been any such inflows yet. This would imply that those storing their coins in personal wallets haven’t panic transferred their Bitcoin to exchanges for selling, yet.

The quant in the post believes that things may very well change in the coming hours, but for now, BTC hodlers outside the exchanges seem to be holding strong.

BTC Price

At the time of writing, Bitcoin’s price floats around $35.1k, down 18% in the last seven days. Over the past thirty days, the crypto has lost 12% in value.

The below chart shows the trend in the price of BTC over the last five days.

BTC’s price seems to have crashed down over the past day | Source: BTCUSD on TradingView

In the plunge that followed the war breakout between Russia and Ukraine, the price of Bitcoin touched as low as $34.4k before quickly jumping back a little and recovering to the current levels.

Featured image from Unsplash.com, charts from TradingView.com, CryptoQuant.com