Will Recent Binance Events Trigger This Historical Bitcoin Bull Run Signal?

The recent events at cryptocurrency exchange Binance could trigger the next Bitcoin bull run if this pattern continues to form.

Will Bitcoin Exchange Reserve Ratio Turn Around After Binance News?

As explained by an analyst in a CryptoQuant Quicktake post, the BTC exchange reserve ratio for US versus off-shore platforms has followed a specific pattern during past bull markets of the asset.

The “exchange reserve ratio” here refers to an indicator that compares the exchange reserves of any two platforms or group of platforms. The exchange reserve is the total amount of Bitcoin sitting in the wallets of the exchange/group in question.

In the context of the current discussion, the exchange reserve ratio between the US-based exchanges and foreign platforms is of interest. The trend in this metric can tell us about which type of exchanges users prefer to use.

When the ratio’s value declines, the off-shore exchanges gain steam as investors deposit their coins to them faster than to the US platforms (alternatively, they are withdrawing at a slower pace).

On the other hand, an increase implies the dominance of the American exchanges is going up as their exchange reserve is growing relative to that of the global platforms.

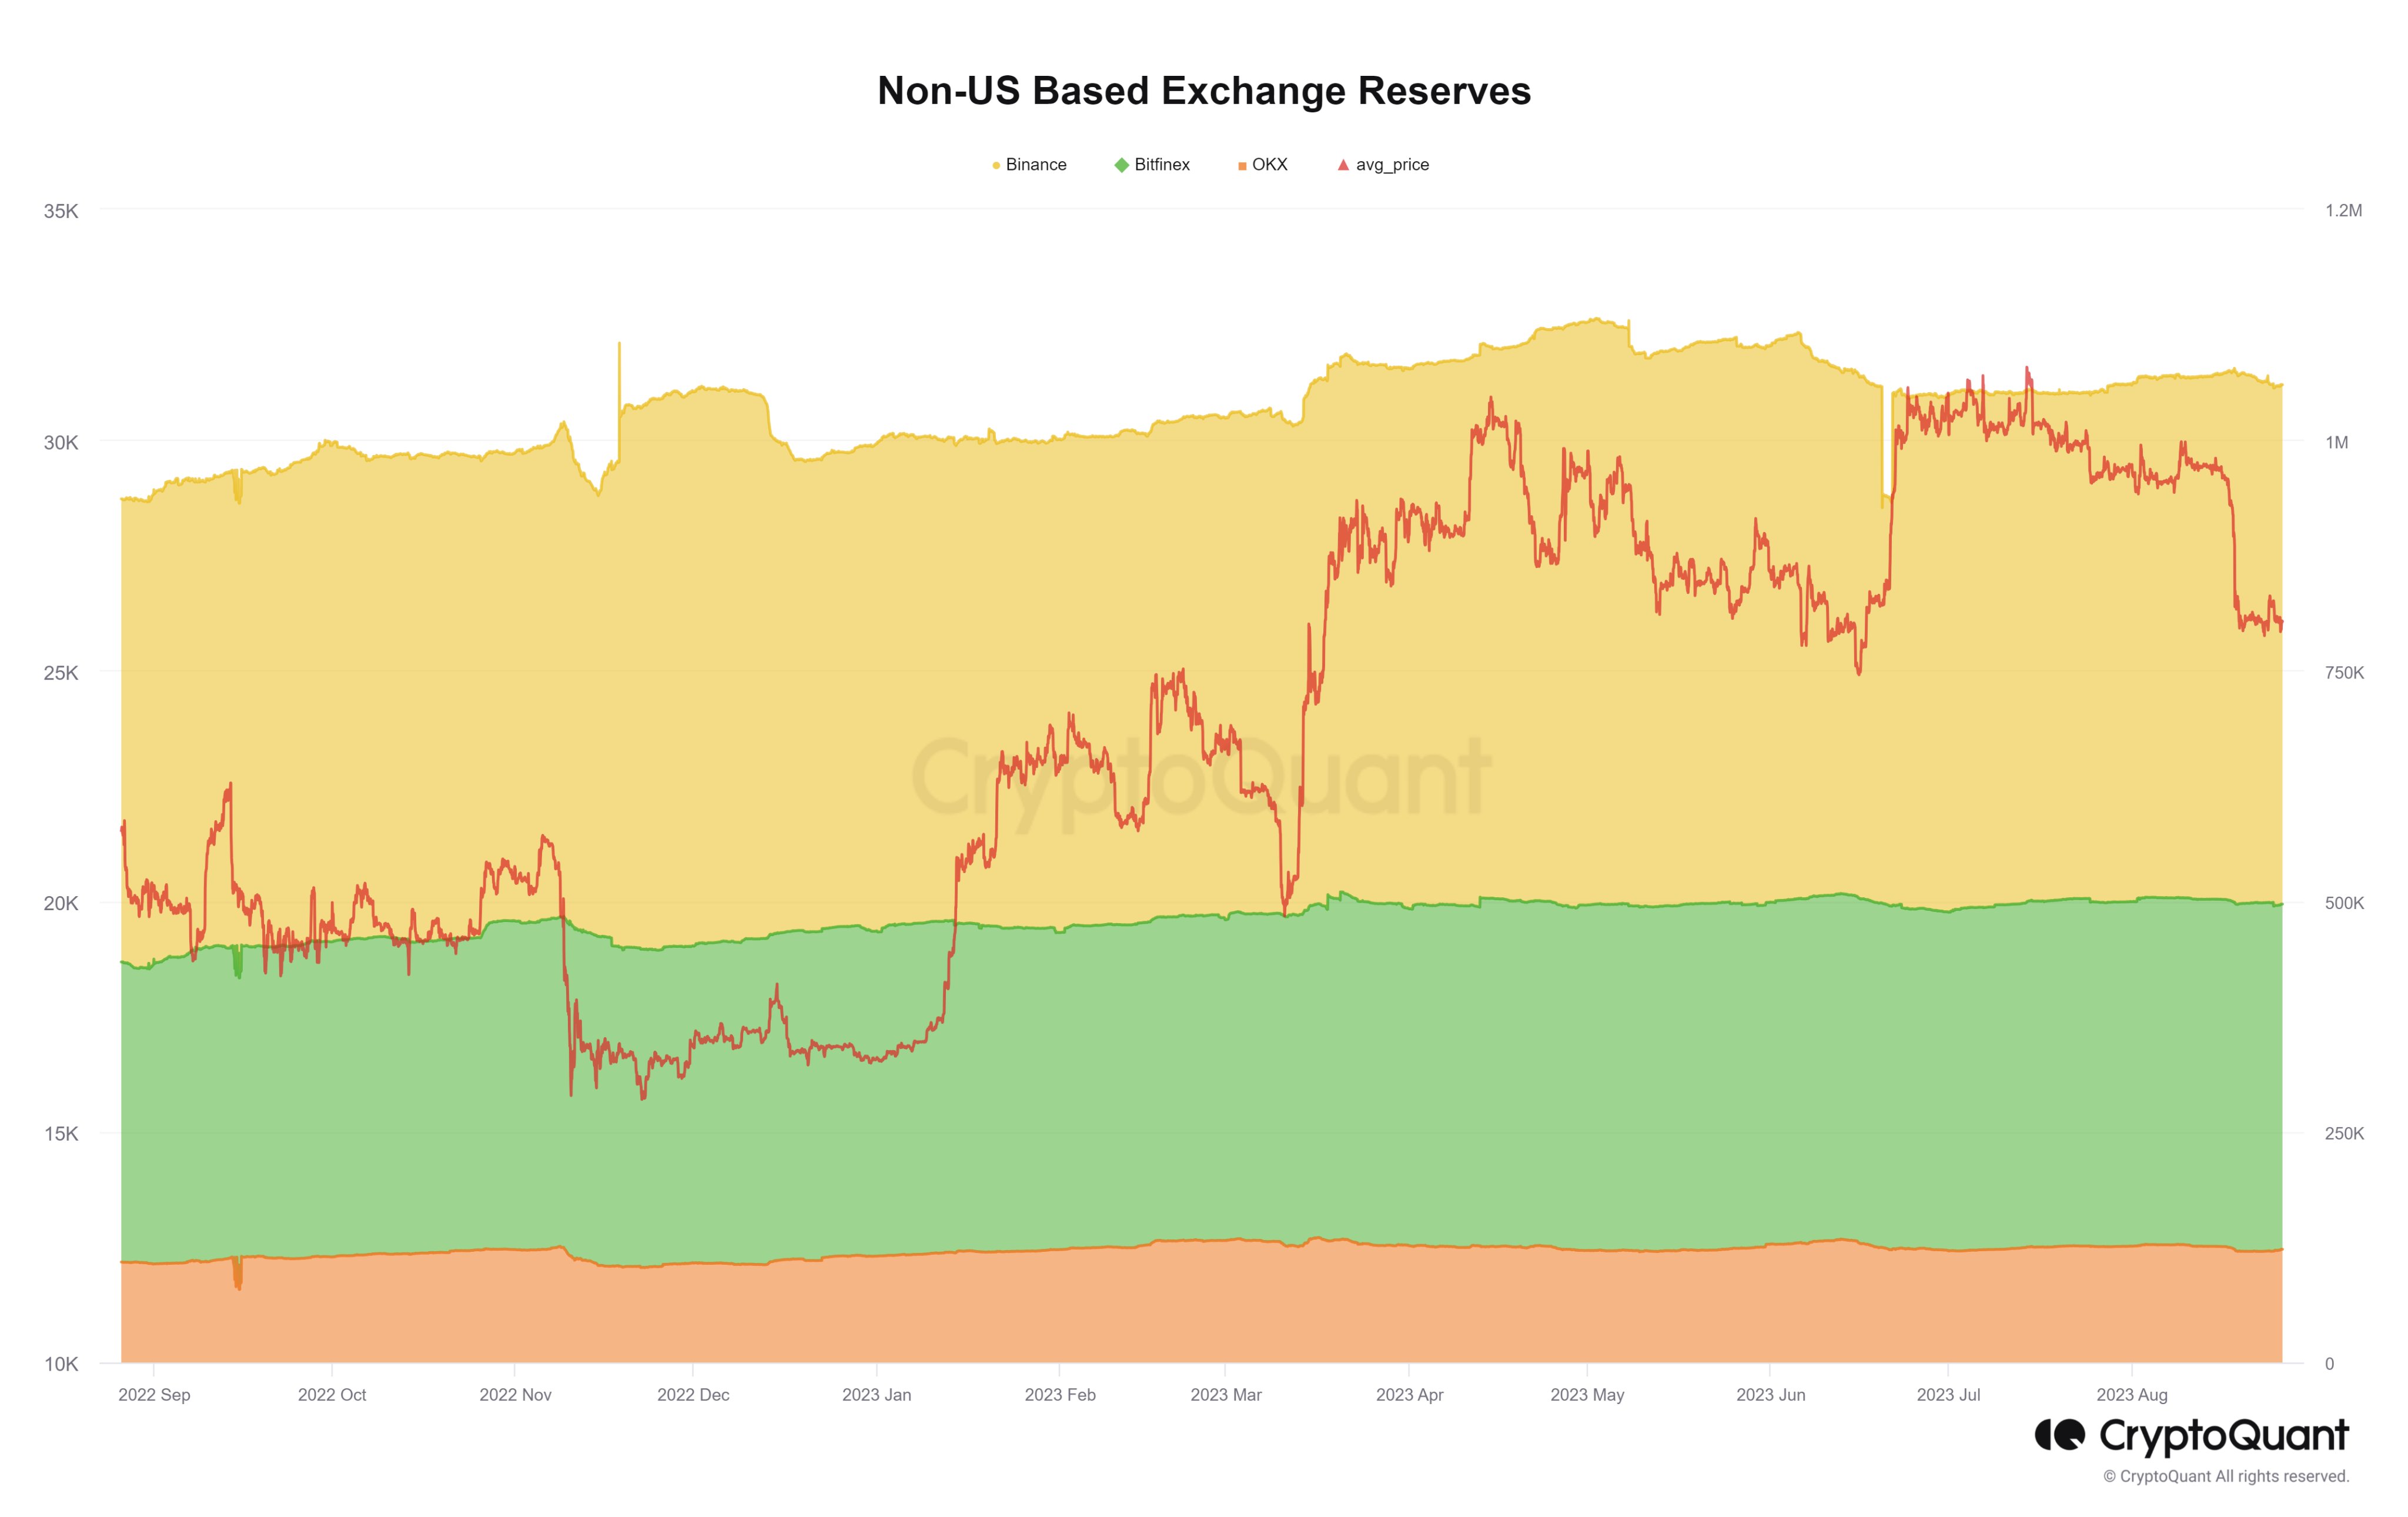
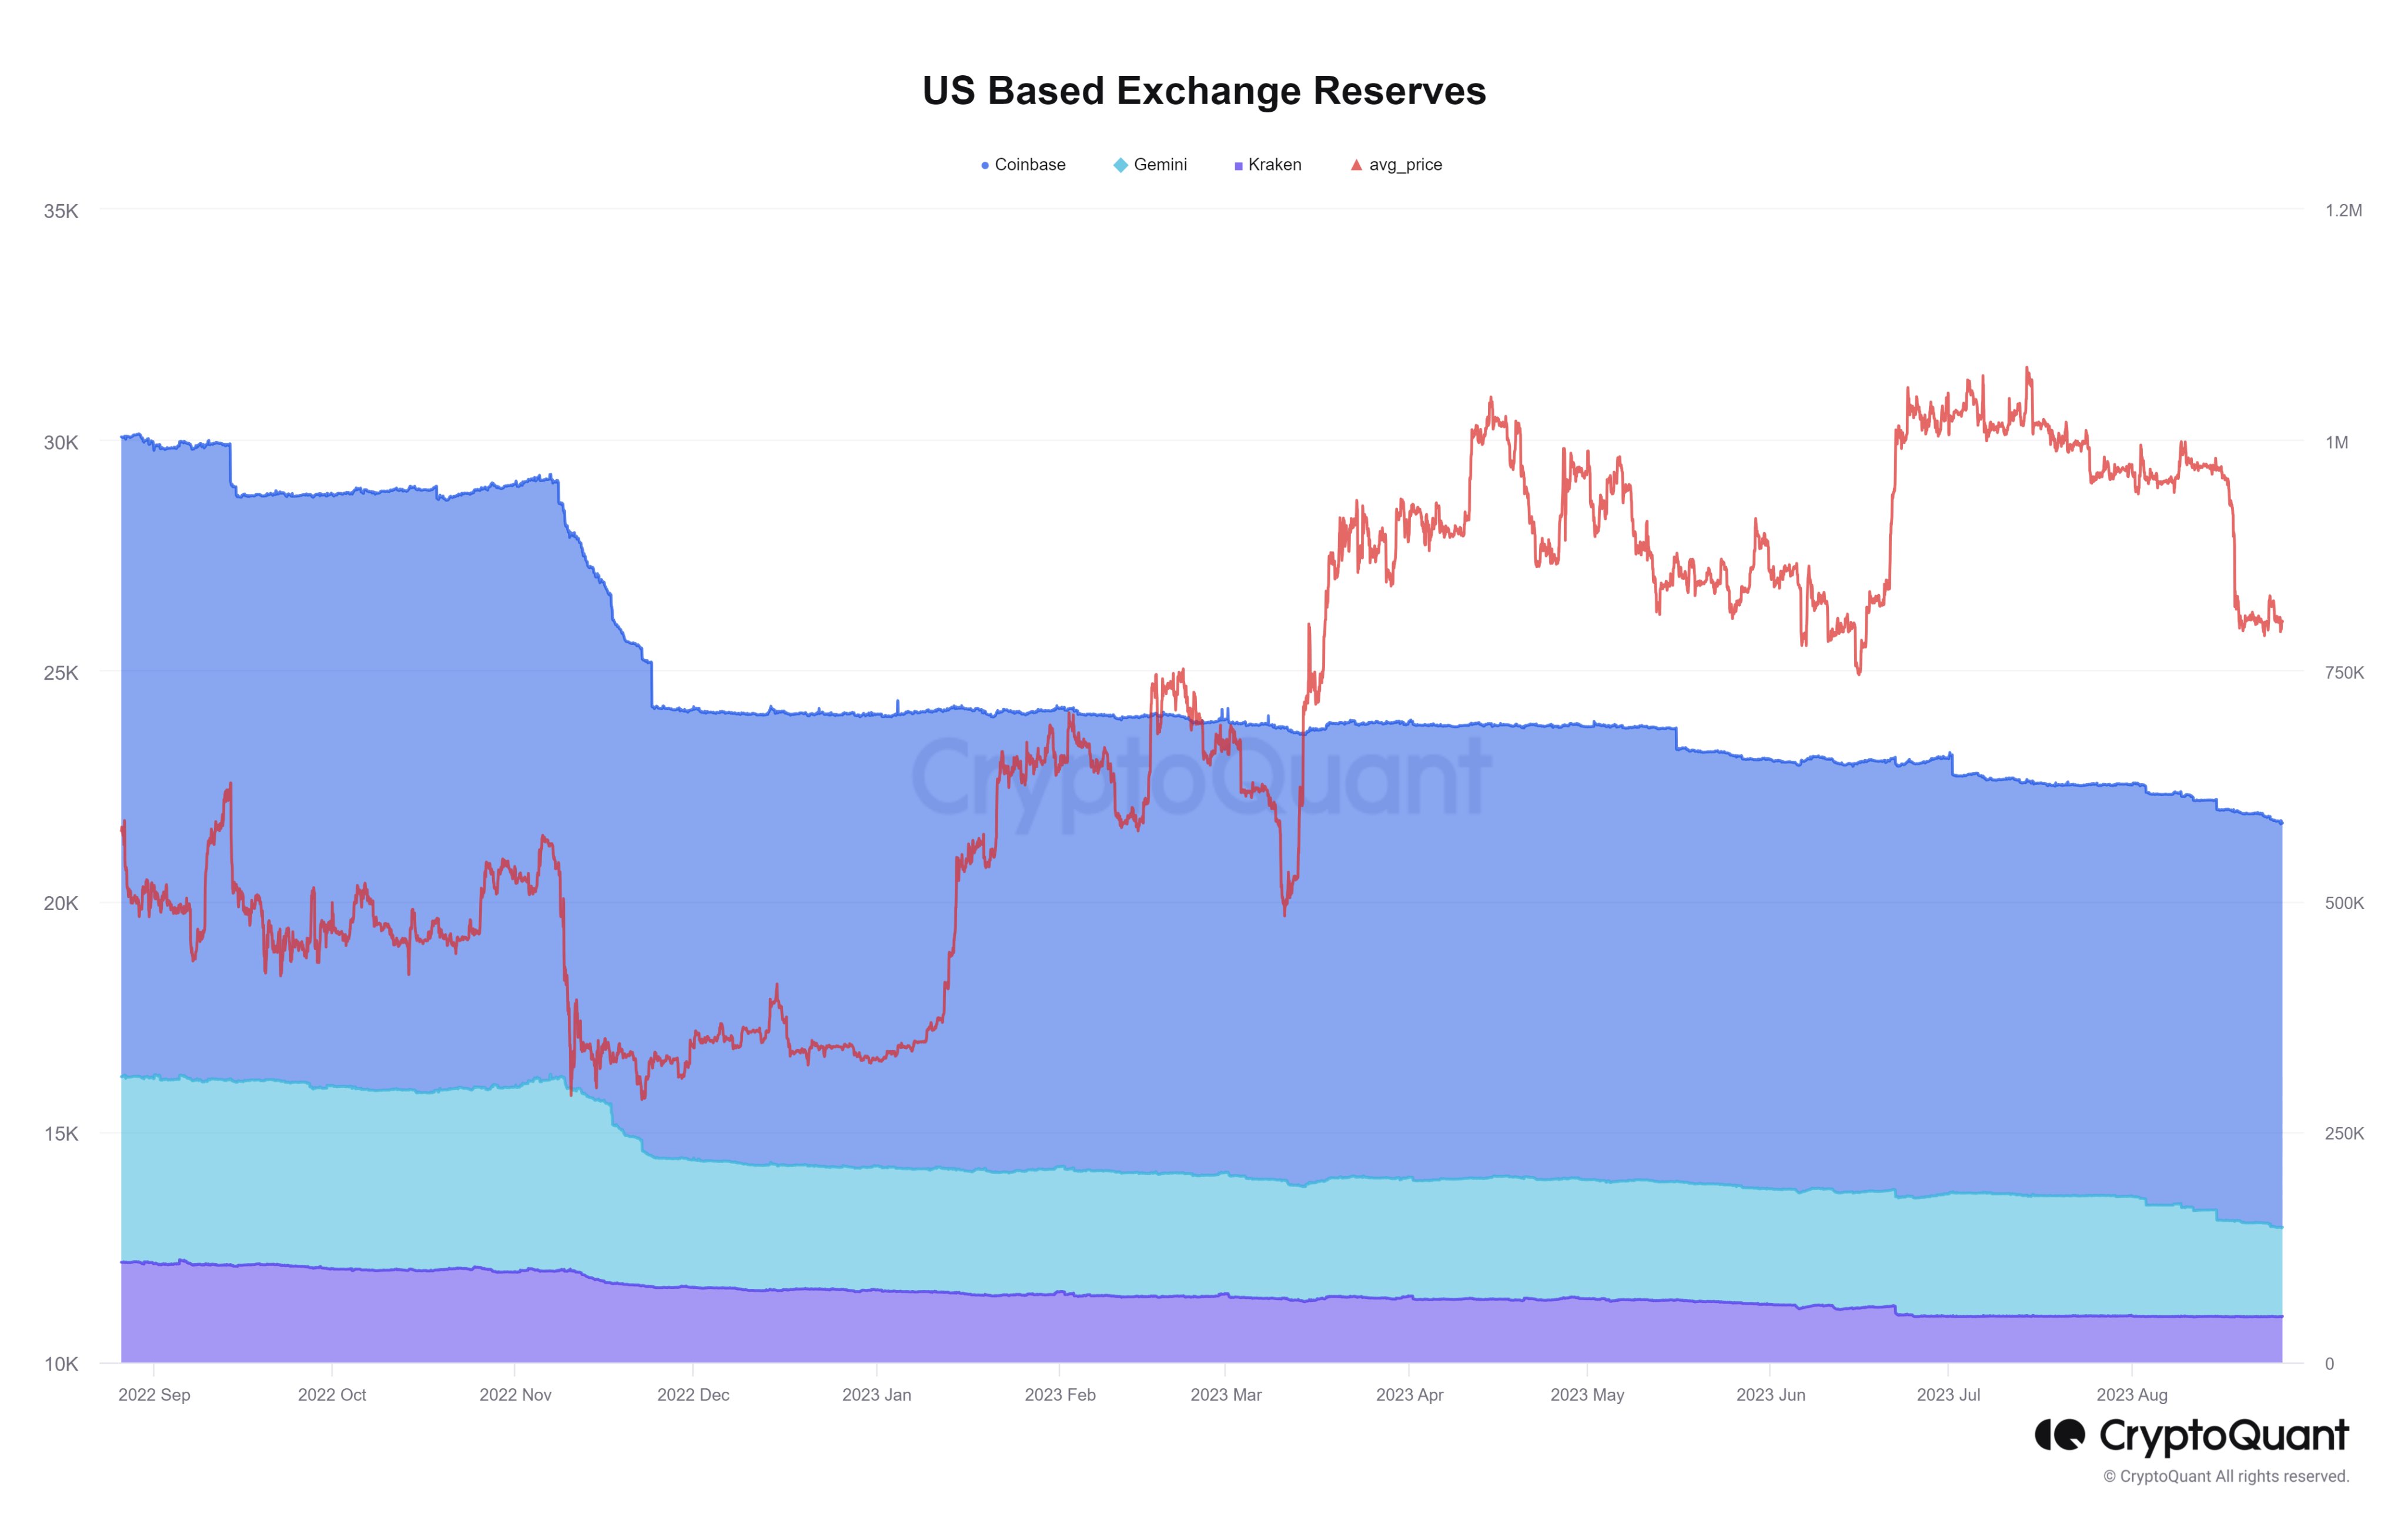
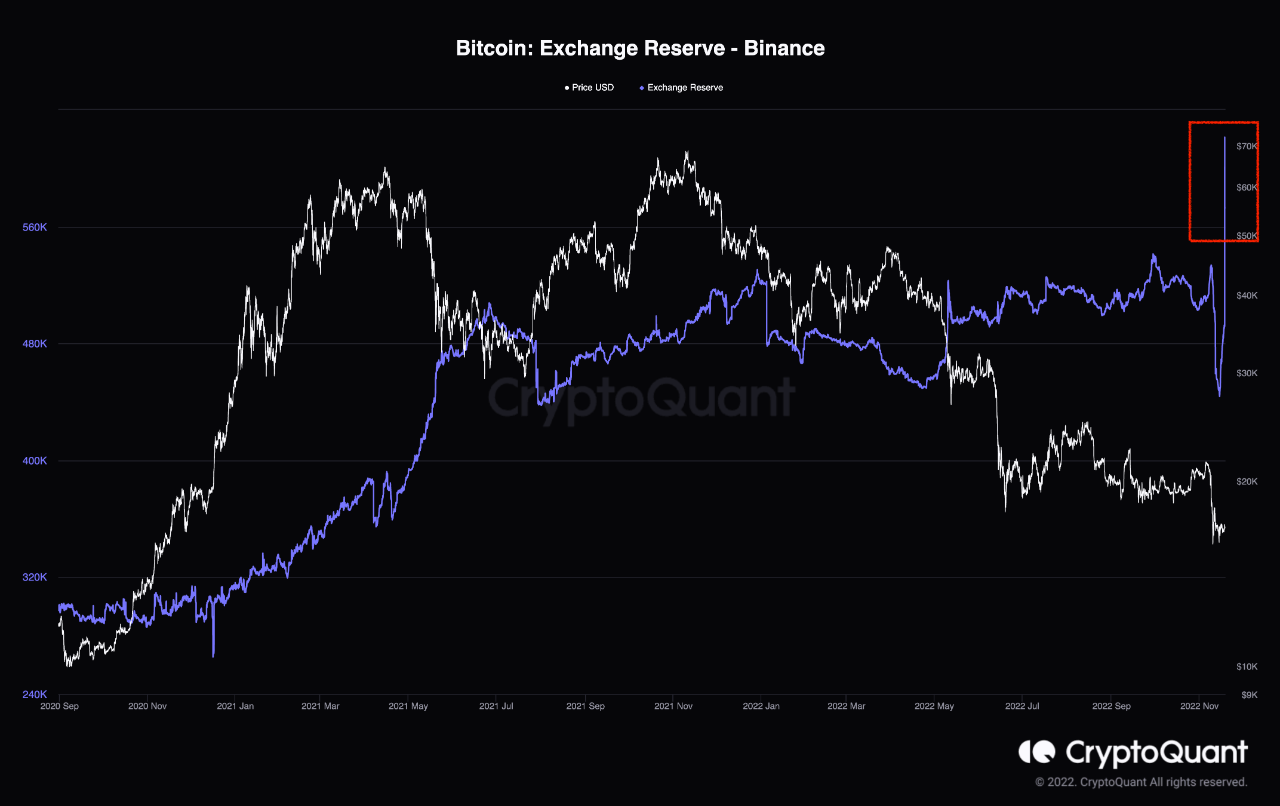
Now, here is a chart that shows the trend in the Bitcoin exchange reserve ratio for these two sets of exchanges over the last few years:

Bitcoin Exchange Reserve Ratio

In the graph, the quant has highlighted the two phases that the Bitcoin exchange reserve ratio for these platforms appeared to have followed during the last two bull runs.

In the first phase (marked in green), the indicator rises while the cryptocurrency goes through a buildup period for the bull rally. This suggests that large entities start participating in the American exchanges ahead of the bull run.

Once the bull run starts properly, the indicator’s value starts sliding down as investors withdraw their coins from these platforms again (the red box in the graph).

From the chart, it’s visible that the Bitcoin exchange reserve ratio for US vs. foreign exchanges was in a continued decline since the start of the bear market but has recently shown signs of turning around.

The indicator has only registered a small increase so far, so it’s hard to say if it’s a sign of a trend taking shape or just a temporary deviation. Whatever the case, though, a development has happened in the Bitcoin market that can tip the favor towards the American platforms regardless.

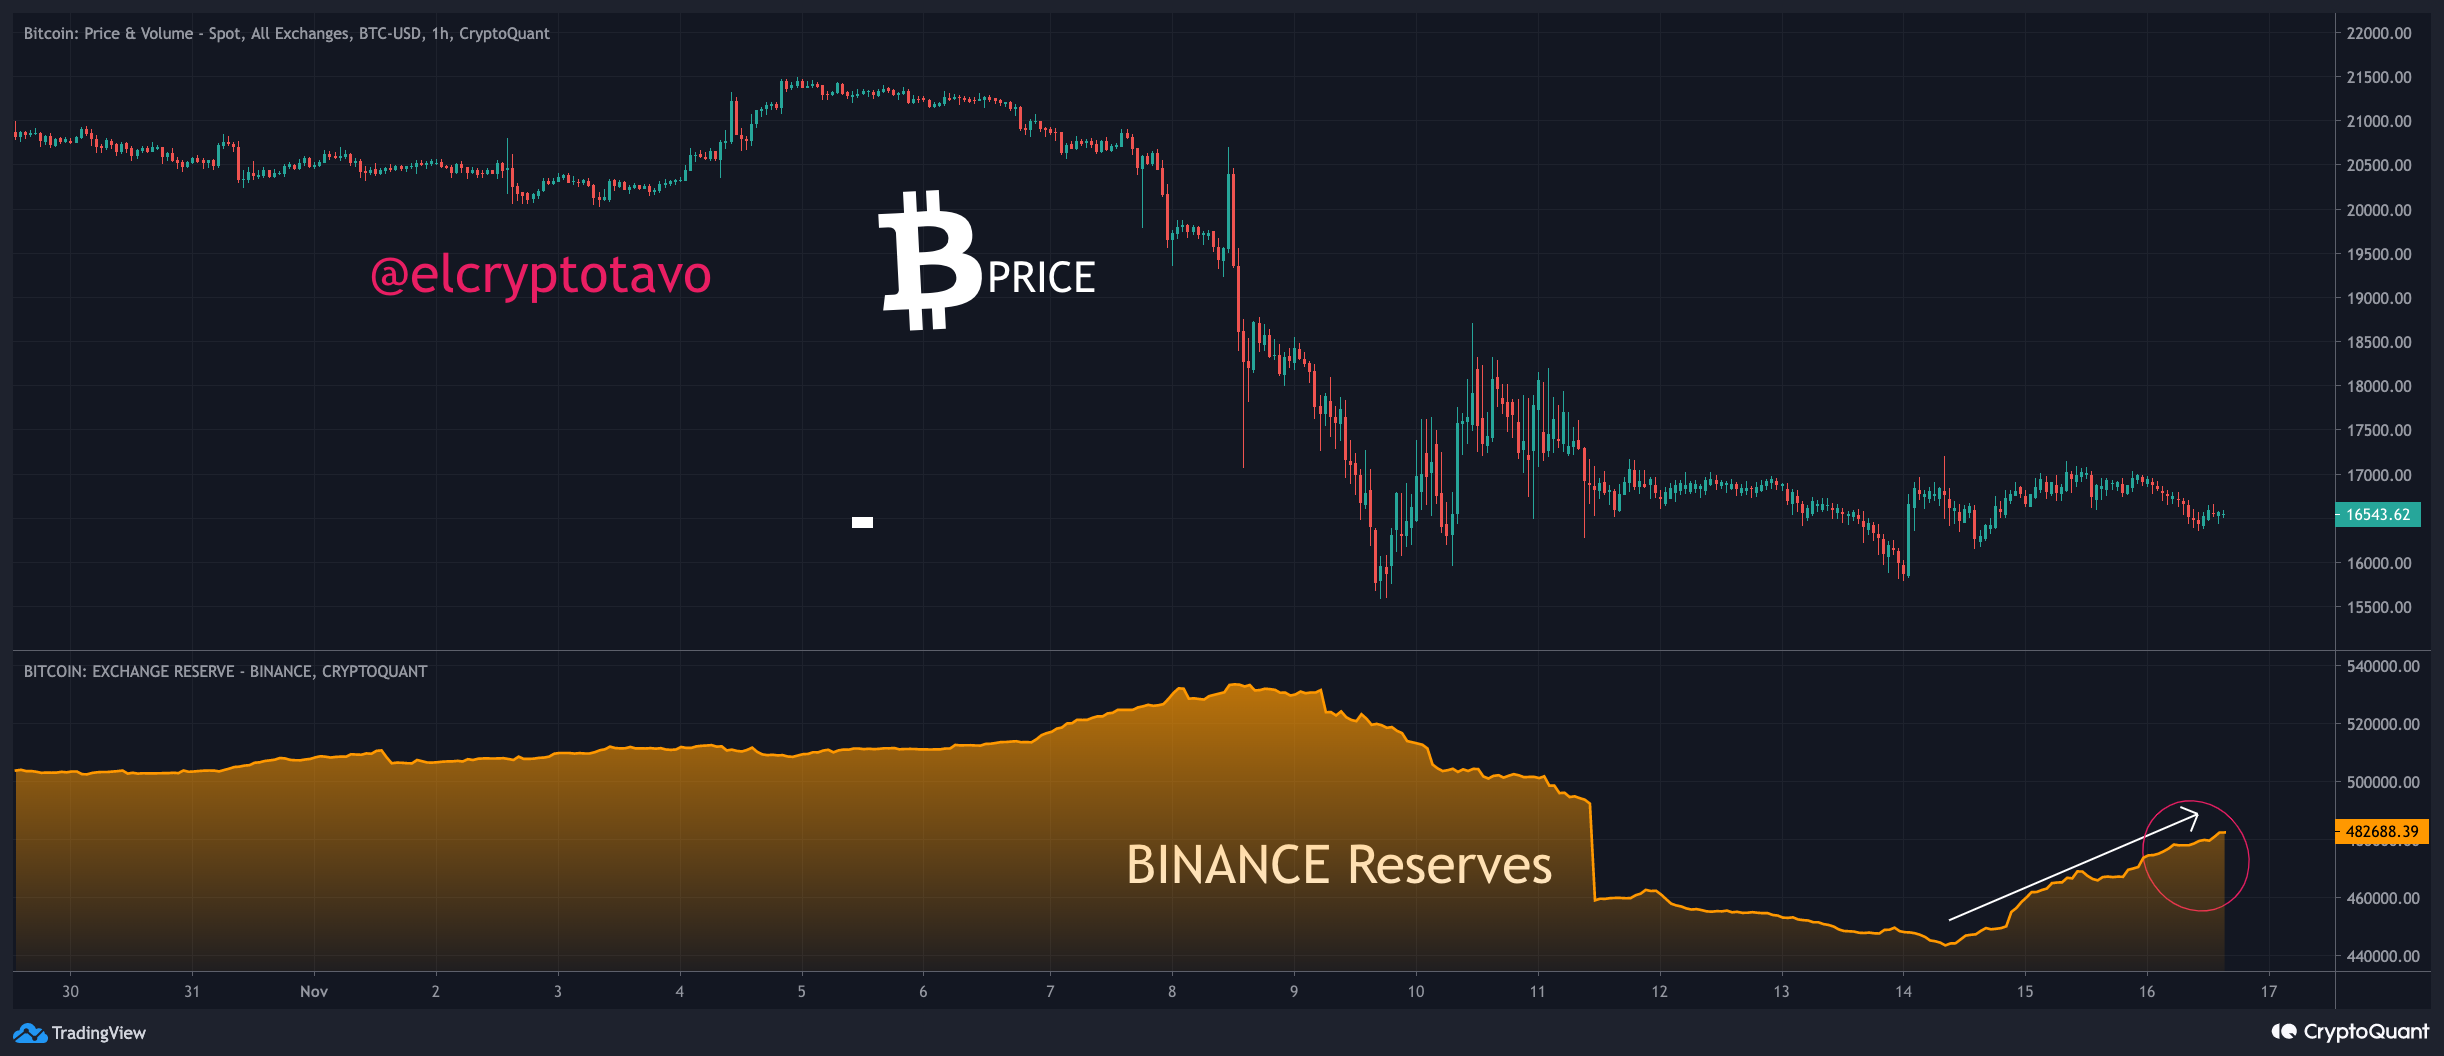
Binance, the largest cryptocurrency exchange based on trading volume, has seen a leadership change following Changpeng Zhao’s resignation. The instability has kickstarted outflows from the exchange, while US-based Coinbase has enjoyed inflows.

Thus, this may be the event that leads to a proper reversal in the BTC exchange reserve ratio. “If the recent regulations on CZ and Binance lead to an increase in the percentage of Bitcoin held on US exchanges, we will be ready for the next bull market,” notes the analyst.
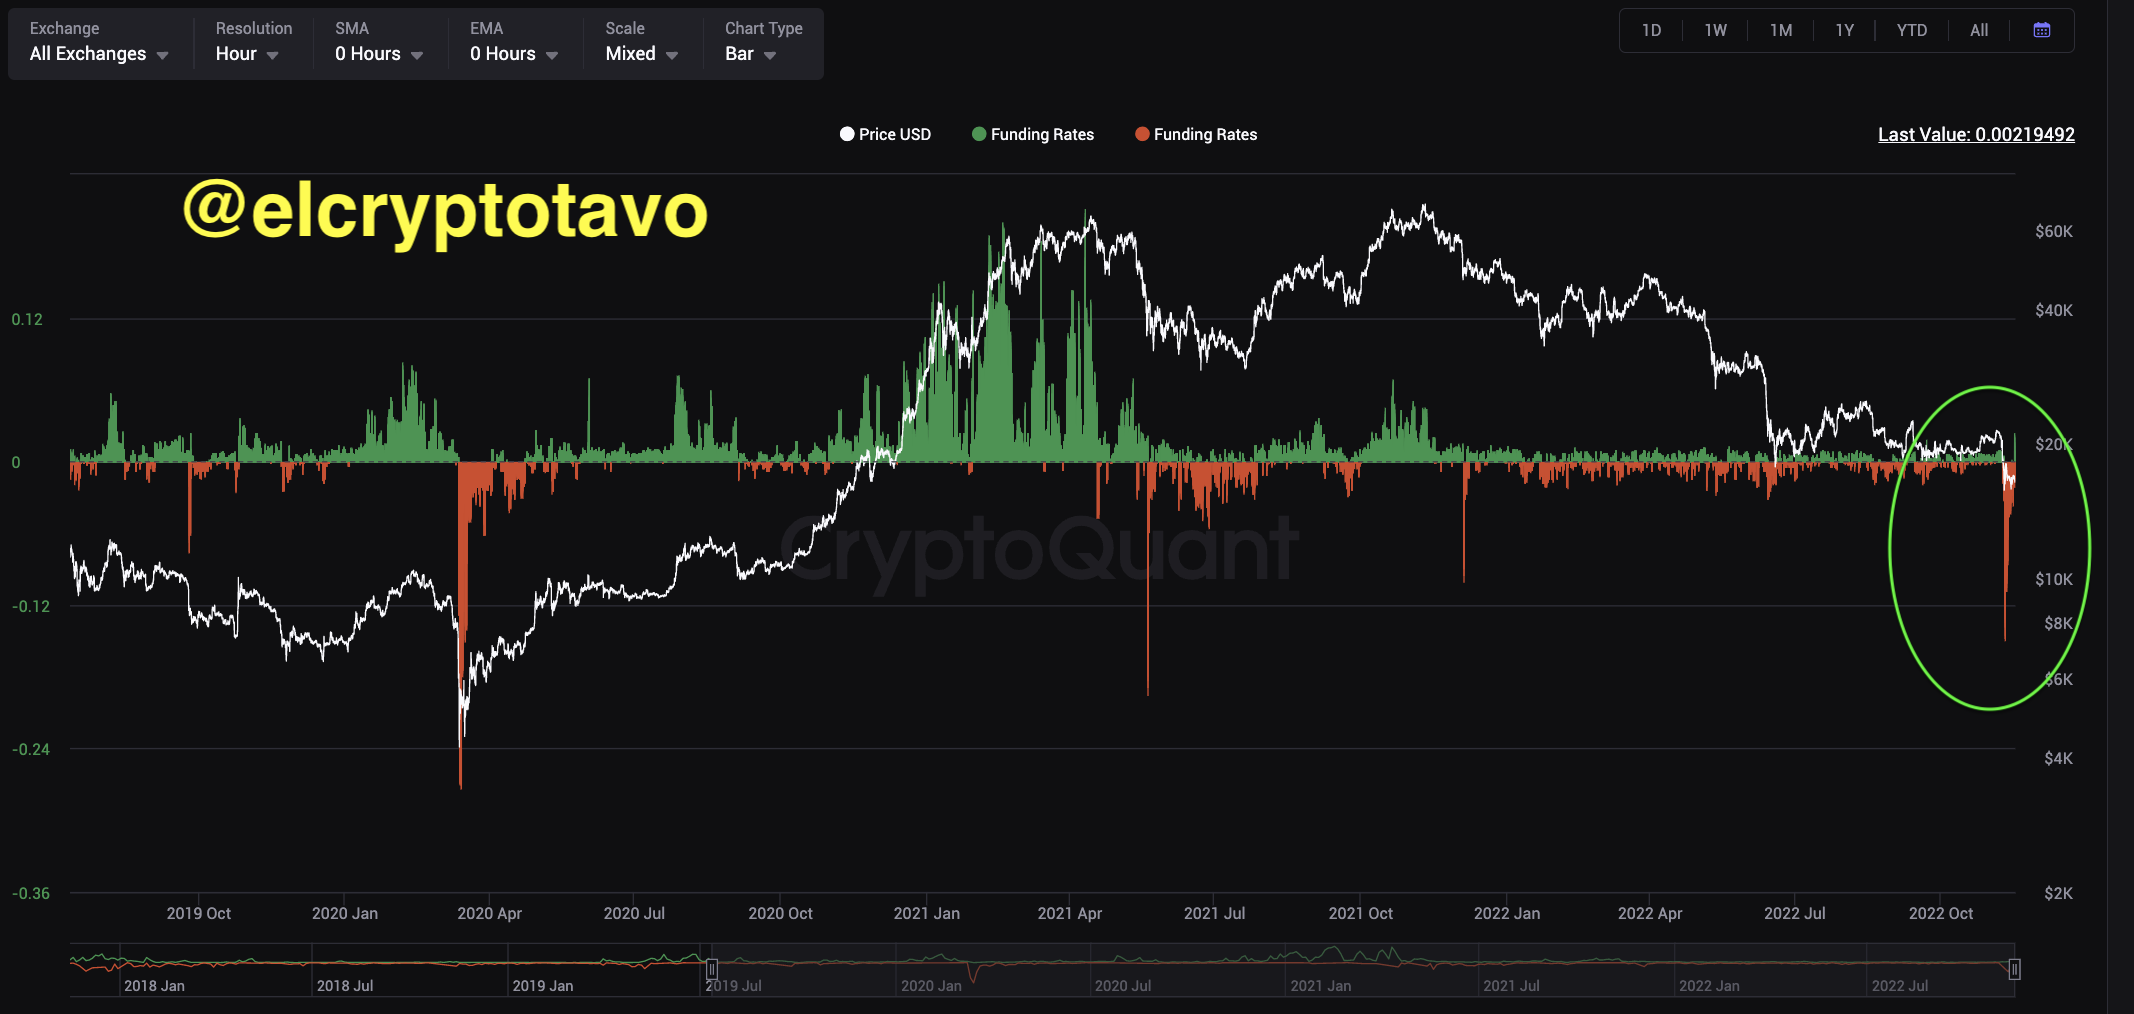
BTC Price

Bitcoin has once again been trying to breach the $38,000 level today, as the chart below shows.

Bitcoin Price Chart

CryptoQuant Discusses How Bitcoin Has Changed In Past 1 Year

The on-chain analytics firm CryptoQuant has discussed how the Bitcoin market has changed during the past year.

Bitcoin Has Been Going Through Some Changes Recently

In a new post on X, CryptoQuant has broken down the changes that the cryptocurrency’s landscape has observed recently. The first would be that the US-based exchanges have been registering withdrawals, while the global platforms have seen growing holdings.

The relevant on-chain indicator here is the “exchange reserve,” which keeps track of the total amount of Bitcoin stored inside the wallets of a centralized exchange or a group of exchanges.

First, here is a chart that shows the trend in this metric for the foreign platforms:

Bitcoin Exchange Reserve

The above graph shows that the Bitcoin exchange reserves for Binance, Bitfinex, and OKX have increased during the past year. In total, the indicator’s value for these non-US platforms has increased by 10% in this period.

This increase would naturally suggest that these exchanges have seen net deposits in the last year. However, the exchange reserve for the US-based platforms paints a different picture.

Bitcoin US exchanges

While the foreign exchanges have seen deposits, the platforms based in the US, such as Coinbase, Gemini, and Kraken, have observed declining reserves during the past year.

In general, the reserves of these platforms have dropped by at least 30%, which is a very significant value. The opposite trends being followed by the two groups of exchanges could imply a migration of coins between them, with investors increasingly preferring the non-US platforms.

The second change in the BTC market is that institutional investors have started displaying an accumulation behavior. “Considering the amount withdrawn and the deposit and withdrawal records of the wallets, institutions are continuously buying Bitcoin,” explains the analytics firm.

CryptoQuant notes that in August alone, Gemini has seen a huge withdrawal of more than 20,000 BTC, which can be a sign that institutional investors are buying.

Bitcoin Gemini

Finally, there is a change in how market participants have been looking at the futures sector recently, as they have increased their exposure to derivative products.

The ratio of the trading volume of the asset between spot and derivative platforms has dropped to pretty low values recently, a sign that activity on the derivative exchanges is overwhelmingly more than on the spot ones.

Bitcoin Trading Volume Ratio

The open interest, a measure of the number of positions open on the derivative market, also showcases this change, as the metric’s value hit very high just recently.

Image

The chart shows that while the open interest was at highs just a while ago, it has since observed a plummet. The reason behind this plunge was the latest Bitcoin crash, which resulted in a cascade of liquidations in the market.

BTC Price

Bitcoin is trading around the $25,900 level, unchanged from one week ago, showing how stagnant the cryptocurrency has been recently.

Bitcoin Price Chart

Bitcoin Exchange Reserve Shoots Up, Pain Not Over Yet?

On-chain data shows the Bitcoin exchange reserve has shot up during the past day, indicating that more drawdown may be coming for the price.

Bitcoin Exchange Reserve Has Registered A Large Increase

A few days back, a crash shook both Bitcoin and the wider cryptocurrency market, as the BTC price plummeted from above $29,000 to below $26,000 instantly.

In the days since then, the asset has failed to show any signs of recovery, either, as its value has only continued to move sideways, as the chart below displays.

Bitcoin Price Chart

Bitcoin is trading around $25,800, suggesting a decline of 11% during the past week. This weekly performance of the number one asset in the sector is worse than some of the other top coins, like Ethereum (ETH) and Cardano (ADA).

It’s currently unclear whether the asset has hit its bottom, or if more decline is on the horizon, but if on-chain data is anything to go by, the latter may be more likely. As pointed out by an analyst in a CryptoQuant post, the exchange reserve has risen during the past few hours.

The “exchange reserve” here refers to a measure of the total amount of Bitcoin currently being stored inside the wallets of all centralized exchange platforms.

When the value of this metric goes up, the investors are depositing a net amount of the asset to these platforms right now. As one of the main reasons holders may transfer their coins to the exchanges is for selling-related purposes, this trend can cause bearish implications for the cryptocurrency’s price.

On the other hand, decreases in the indicator’s value imply the holders are taking their BTC off these central entities. Such a trend may be a sign that the investors are accumulating currently, which can naturally be bullish for the cryptocurrency in the long term.

Now, here is a chart that shows the trend in the Bitcoin exchange reserve over the past week or so:

Bitcoin Exchange Reserve

The graph shows that the Bitcoin exchange reserve has registered a sharp uptick in the last few hours, implying that investors have been depositing big to these platforms.

The chart shows that the indicator also rose during the buildup to the crash, but the sharpness of the growth being observed this time is on another level.

In the lower graph, the quant has attached the data for the individual reserves of Coinbase and Binance, as well as for all spot and derivative platforms. It’s apparent that most of the rise has come from the derivative side of the market, with Binance seeing the largest spike.

Investors use spot exchanges for selling, so the fact that most of the deposits have been towards derivative platforms may imply that investors are just looking to open up new positions on the futures market, which can also lead to more volatility. Still, the direction of it could go either way.

Nonetheless, the spot exchange reserve has also observed a rise (although much smaller in scale), suggesting that a selloff might still be possible.

Bitcoin Bearish Signal: 130k BTC Just Flowed Into Binance

On-chain data shows the crypto exchange Binance has just received Bitcoin inflows of 130k BTC, a sign that may be bearish for the price of the crypto.

Binance’s Bitcoin Exchange Reserve Has Sharply Spiked Up Over Past Day

As pointed out by an analyst in a CryptoQuant post, Binance has received a massive Bitcoin deposit today.

The relevant indicator here is the “exchange reserve,” which tells us the total amount of BTC currently sitting in the wallets of a centralized exchange.

When the value of this metric goes down, it means investors are withdrawing their coins from the exchange right now. Such a trend, when sustained, could be bullish for the crypto’s price as it might be a sign of accumulation.

On the other hand, rises in the indicator suggest holders are transferring their BTC to the exchange’s wallets currently. As investors could be depositing for selling purposes, this kind of trend can be bearish for the coin’s value.

Now, here is a chart that shows the trend in the Bitcoin exchange reserve of the crypto exchange Binance over the last few years:

Bitcoin Exchange Reserve - Binance

The value of the metric seems to have suddenly jumped up in recent days | Source: CryptoQuant

As you can see in the above graph, the Bitcoin exchange reserve for Binance sharply fell off earlier in the month.

These outflows occurred as the crypto exchange FTX went belly up, reigniting fear among investors around central custody, and causing them to rush to withdraw their coins from such platforms.

In the last few days, however, Binance’s BTC reserve has once again started to trend up, implying that whales might be making moves to dump.

And today, the indicator has very rapidly increased to a new high, as investors have made a massive deposit of 130k BTC to the exchange.

At the moment, it’s unclear whether this is an organic increase in Binance’s Bitcoin reserve, or if it’s because of the exchange making some internal wallet shuffles that have been mistakenly picked up as fresh deposits by CryptoQuant’s metric.

However, if it’s indeed a true spike, then the outcome from this could be bearish for the price of BTC.

BTC Price

At the time of writing, Bitcoin’s price floats around $16.7k, down 3% in the last week. Over the past month, the crypto has lost 14% in value.

The below chart shows the trend in the price of the coin over the last five days.

Bitcoin Price Chart

Looks like BTC has continued to hold still in the last few days | Source: BTCUSD on TradingView
Featured image from Jonathan Borba on Unsplash.com, charts from TradingView.com, CryptoQuant.com

Bitcoin Reserve On Binance Sharply Rises, Whales Preparing For More Dumping?

On-chain data shows the Bitcoin reserve on Binance has been sharply going up in the last couple of days, something that could be a sign of dumping.

Bitcoin Reserve On The Crypto Exchange Binance Has Observed Sharp Growth In Recent Days

As pointed out by an analyst in a CryptoQuant post, the funding rates have been negative while these inflows have been made.

The “exchange reserve” is an indicator that measures the total amount of Bitcoin currently stored in the wallets of a centralized exchange (which, in this case, is Binance).

When the value of this metric goes up, it means investors are depositing their coins to the exchange right now. As investors could be depositing to such a platform for selling purposes, this kind of trend can have bearish impacts on the price of the crypto.

On the other hand, decreasing value of the reserve suggests coins are exiting the exchange currently. Such a trend, when sustained, can be a sign of accumulation from investors, and could thus be bullish for the BTC value.

Now, here is a chart that shows the trend in the Bitcoin exchange reserve for the crypto exchange Binance during the past month:

Bitcoin Exchange Reserve Binance

The value of the metric seems to have been riding an upwards momentum in recent days | Source: CryptoQuant

As you can see in the above graph, the Binance Bitcoin exchange reserve started to rapidly fall down around ten days ago as the crash started.

This happened because the collapse of FTX made investors more wary of crypto exchanges than ever before, and so they were withdrawing coins off centralized platforms in hordes.

After seeing a final sharp plunge a little less than a week ago, the indicator started moving sideways. In the past couple of days, however, this trend has changed.

The Binance Bitcoin exchange reserves are now climbing back up quickly, suggesting that investors have been depositing large amounts.

This could be a sign of activity from whales, and would imply that these humongous holders may be preparing to dump.

The quant has also talked about another indicator’s trend, the “Funding Rate,” which tells us whether the futures market is leaning towards shorts or longs right now. The below chart displays the trend in this metric.

Bitcoin Funding Rates

Looks like the metric has a red value currently | Source: CryptoQuant

The funding rates are highly negative at the moment, implying the majority of the contracts are shorts. Based on this the analyst thinks a short squeeze could possibly take place, which would propel the price in the short term.

However, the quant also believes that’s when the whales would potentially make their move, and dump the crypto.

BTC Price

At the time of writing, Bitcoin’s price floats around $16.5k, down 6% in the last week.

Bitcoin Price Chart

BTC continues to consolidate | Source: BTCUSD on TradingView
Featured image from Rémi Boudousquié on Unsplash.com, charts from TradingView.com, CryptoQuant.com

Bitcoin Exchange Reserve Spikes Up, Selloff Not Over Yet?

On-chain data shows Bitcoin exchange reserves have sharply increased in value, a sign that the selloff may not be over yet.

Bitcoin Exchange Reserve Observes Rapid Rise

As pointed out by an analyst in a CryptoQuant post, a high number of coins have entered exchanges over the last day.

The “exchange reserve” is an indicator that measures the total amount of Bitcoin currently present in wallets of all centralized exchanges.

When the value of this metric goes up, it means the supply on exchanges is going up as investors are depositing a net number of coins.

As holders usually transfer to exchanges for selling purposes, such a trend could be bearish for the price of the crypto.

Related Reading | Panic Vs Pandemic: Crypto Market Is More Fearful Than On Black Thursday

On the other hand, a declining value of the reserve suggests investors are withdrawing their coins at the moment. This kind of trend, when prolonged, can be a sign that holders are accumulating, which could prove to be bullish for the coin’s price.

Now, here is a chart that shows the trend in the Bitcoin exchange reserve over the past few months:

Looks like the value of the metric has jumped up recently | Source: CryptoQuant

As you can see in the above graph, the Bitcoin exchange reserve has observed a sharp increase in its value recently.

The chart also shows the curve for the “all exchanges netflow,” another metric which measures the net amount of coins entering or exiting exchanges.

Related Reading | Bitcoin Faces a New Downtrend Of 28.82%, Why Someone Still Makes More Than 1000% ROI

Basically, this metric tells us about how much the reserve is increasing or decreasing right now. As expected, its value also shot up over the last few days.

The fact that the Bitcoin exchange reserve doesn’t seem to have changed trend and is still rapidly rising after the crash may mean that the crypto’s price could see further decrease in its value in the near future.

BTC Price

At the time of writing, Bitcoin’s price floats around $21.1k, down 30% in the last seven days. Over the past month, the crypto has lost 32% in value.

The below chart shows the trend in the price of the coin over the last five days.

The price of BTC seems to have ben moving sideways since the crash | Source: BTCUSD on TradingView

Following the crash, Bitcoin touched as low as $20k, before rebounding back a little to the current levels. Currently, it’s unclear whether the carnage has ended, or if further decline is coming.

But if the exchange reserve is anything to go by, then signs aren’t looking in the crypto’s favor.

Featured image from Unsplash.com, charts from TradingView.com, CryptoQuant.com

Bitcoin Bullish Signal: Exchange Reserves Hit New 4-Year Lows

On-chain data shows Bitcoin exchange reserves have now reached new 4-year lows, a sign that could prove to be bullish for the crypto’s price.

Bitcoin Exchange Reserve Has Sunk Down Further Recently

As pointed out by an analyst in a CryptoQuant post, the BTC exchange reserve has been going down, suggesting buying has been going in the market.

The “all exchanges reserve” is an indicator that measures the total amount of Bitcoin currently stored in wallets of all centralized exchanges.

When the value of this metric goes up, it means investors are depositing a net amount of coins to exchanges right now.

Such a trend, when prolonged, can be bearish for the price of the crypto as holders usually transfer their crypto to exchanges for selling purposes.

Related Reading | When Greed? Bitcoin Market Crushed Under One Full Month Of Fear

On the other hand, a downtrend in the reserve suggests investors are withdrawing their BTC from exchanges at the moment. This kind of trend can be bullish for the price of the crypto.

Now, here is a chart that shows the trend in the Bitcoin exchange reserve over the last few years:

The value of the metric seems to have experienced downwards movement over the last year | Source: CryptoQuant

As you can see in the above graph, the Bitcoin exchange reserve has observed some sharp movement down recently, taking its value to new 4-year lows.

This is a continuation of the overall downtrend in the indicator that has been going on for almost a full 12 months now.

Related Reading | U.S. Macro Pressure Responsible For Entire Bitcoin Downtrend

This may imply that the market has been in a state of constant accumulation, which would mean a supply shock could be deepening in the BTC market.

Due to supply-demand dynamics, such a shock can be constructive for the price of the cryptocurrency in the long term.

However, some data from December 2021 suggests that the growth of new investment instruments like ETFs are likely one of the reasons behind the exchange reserve’s decline.

The coins are simply moving from one source of selling pressure into another. Such a shift would mean that a supply shock wouldn’t take place just by declining exchange reserves.

Nonetheless, some of the decline should still be from buying in the market so a decreasing reserve can still be bullish for the value of Bitcoin.

BTC Price

At the time of writing, Bitcoin’s price floats around $30.1k, up 1% in the past week. Over the last month, the crypto has lost 12% in value.

Looks like the value of the crypto has moved sideways over the past couple of days | Source: BTCUSD on TradingView
Featured image from Unsplash.com, charts from TradingView.com, CryptoQuant.com

Bitcoin Bullish Signal: Exchange Reserve Loses Another 50k BTC Over Past Week

On-chain data shows the Bitcoin exchange reserve has lost another 50k BTC over the past week, a sign that could be bullish for the price of the crypto.

Bitcoin Exchange Reserve Continues To Observe Further Decline In Recent Weeks

As pointed out by an analyst in a CryptoQuant post, 50k BTC in net outflows has exited exchange wallets over the past week.

The “all exchanges reserve” is an indicator that measures the total amount of Bitcoin stored in wallets of all centralized exchanges.

When the value of this metric goes up, it means the supply on exchanges is rising as investors deposit a net amount of coins. Such a trend may be bearish for the price of the coin as holders usually transfer to exchanges for selling purposes.

On the other hand, the reserve’s value decreasing implies that a net amount of Bitcoin is exiting exchange wallets at the moment. This kind of trend when sustained over a period can prove to be bullish for the coin’s price as it may be a sign that investors are accumulating.

Related Reading | Current Stretch Of Bitcoin Fear Surpasses 2021 Selloff

Now, here is a chart that shows the trend in the BTC exchange reserve over the past few months:

Looks like the value of the indicator has sharply gone down recently | Source: CryptoQuant

As you can see in the above graph, the Bitcoin exchange reserve has been going down over the last few months. In the past week alone, the metric has dropped 50k BTC in value. The last couple of days especially saw large downward spikes amounting to around 10k to 11k BTC.

Related Reading | Mike Novogratz: Bitcoin Price To Range Between $30k-$50k Throughout The Year

The exchange reserve has traditionally been considered the “selling supply” of the coin. As it has been shrinking for a while now, the effect on the price should be positive due to supply-demand dynamics.

Some have referred to this decline as creating a “supply shock” in the market. However, recent data suggests that the reserve is no longer the main source of selling pressure, coins exiting from exchanges have instead just shifted into investment vehicles like ETFs.

Nonetheless, the reserve declining does reduce part of the selling supply so the net effect of such a trend may still be bullish.

BTC Price

At the time of writing, Bitcoin’s price floats around $41k, up 5% in the past week. Over the last month, the crypto has lost 6% in value.

The below chart shows the trend in the price of the coin over the past five days.

The price of Bitcoin seems to have seen a surge over the last couple of days | Source: BTCUSD on TradingView
Featured image from Unsplash.com, charts from TradingView.com, CryptoQuant.com

Bitcoin Outflows Spike As 30k BTC Exits Exchanges, Reserve Plunges Down

Bitcoin outflows have shown a spike amounting to 30k BTC today, leading to a plunge in the all exchanges reserve.

Bitcoin Netflow Shows Deep Negative Spike As 30k BTC Exits Exchanges

As pointed out by an analyst in a CryptoQuant post, the BTC exchange netflow showed a large negative spike earlier today.

The “outflow” is a measure of the total amount of Bitcoin exiting wallets of all exchanges. Similarly, the number of coins being deposited to exchanges is the “inflow.”

The difference between the inflow and the outflow is called the netflow. This indicator tells us the net amount of coins moving into or out of exchanges.

When the value of this indicator is negative, it means outflows are currently overwhelming the inflows and a net amount of Bitcoin is exiting exchanges. Such a trend, when prolonged, can be bullish for the price of the crypto as it may be a sign of accumulation.

Related Reading | USDC Inflow Spikes Up, Will It Act As Dry Powder For New Bitcoin Rally?

On the other hand, a positive netflow shows that a net amount of coins are entering exchange wallets at the moment. Since investors usually deposit to exchanges for selling purposes, this trend can be bearish for the coin.

Now, here is a chart that shows the trend in the Bitcoin netflow over the past couple of weeks:

Looks like the indicator showed a large downward spike recently | Source: CryptoQuant

As you can see in the above graph, the Bitcoin netflow had a huge negative spike earlier today. This amounted to an outflow of more than 30k BTC, or over $1.2 billion.

Such a large amount of coins exiting exchanges has made the exchange reserve (a metric that measures the total number of BTC present on exchanges) plunge down:

The indicator’s value seems to have plummeted today | Source: CryptoQuant

If this outflow belongs to one or more whale entities withdrawing their Bitcoin for hodling in cold wallets, then it can be quite bullish for the price of the crypto as it has significantly reduced its sell supply (that is, the reserve).

Related Reading | Bitcoin On Course To Hit $100K Nine Months From Now, Bitbull CEO Predicts

However, as the quant notes, it’s yet unclear at the moment what this negative netflow may signify. It’s possible it could be just an internal transfer within the exchange wallets. And if so, it shouldn’t have any positive effect on the price.

BTC Price

At the time of writing, Bitcoin’s price floats around $40k, down 3% in the last seven days. Over the past month, the crypto has lost 6% in value.

The below chart shows the trend in the price of the coin over the last five days.

BTC’s price plunged down yesterday | Source: BTCUSD on TradingView
Featured image from Unsplash.com, charts from TradingView.com, CryptoQuant.com

Bitcoin Exchange Reserve Has Now Reached An Equilibrium After 2 Years Of Downtrend

On-chain data shows the percentage of Bitcoin supply on exchanges seems to have plateaued over the past few months, ending an overall downtrend that lasted about two years.

Bitcoin Exchange Reserve Starts Moving Sideways As Inflow And Outflows Attain Equilibrium

As per the latest weekly report from Glassnode, the percentage of the total BTC supply on exchanges looks to have ended its decline recently and is now moving sideways.

The “exchange reserve” is an indicator that measures the total amount of Bitcoin stored in wallets of all exchanges.

When the value of this metric rises, it means exchanges are observing net inflows right now. Such a trend can be bearish for the price of the coin as it represents an increase in the sell supply of the crypto.

On the other hand, when the reserve’s value decreases, it implies outflows are overwhelming the inflows at the moment. This trend may turn out to be bullish for the value of Bitcoin as it may be a sign of accumulation from holders.

Related Reading | Risk Aversion Pulls Crypto Market Down, Bitcoin Still Below $40K

Now, here is a chart that shows how the percentage of the total supply that the exchange reserve accounts for has changed over the past couple of years:

Looks like the value of the indicator seems to have moved sideways recently | Source: Glassnode’s The Week Onchain – Week 10, 2022

As you can see in the above graph, the metric had an all-time high back in March 2020, following which the percentage of the Bitcoin supply on exchanges went on a constant decline until May 2021, where there was a brief increase due to the selloff that month.

Soon after, the indicator did resume the downtrend, but following September 2021 the metric has mostly consolidated sideways.

Related Reading | Goodbye, Russia – A Number Of Goldman Sachs Employees Are Leaving Russia To UAE

This means that at the current value of the exchange reserve, an equilibrium between the inflows and the outflows has been established.

The sideways trend is interesting since while the price of Bitcoin has struggled recently and macro uncertainties like the Russian-Ukraine war are looming over the market, there has been no significant increase in the indicator.

Usually, a large selloff occurs during periods as now, but as the metric still continues to go sideways, it means there has still been enough demand (that is, outflows) to counteract any inflows. This trend may be bullish for the price of Bitcoin.

BTC Price

At the time of writing, Bitcoin’s price floats around $38.7k, down 13% in the past week.

BTC’s price seems to have shown lesser volatility since the plunge a few days back | Source: BTCUSD on TradingView
Featured image from Unsplash.com, charts from TradingView.com, Glassnode.com

Despite Struggling Price, Bitcoin Exchange Reserve Hits Lowest Value Since Sept 2018

Despite the recent struggling Bitcoin price, on-chain data shows the exchange reserve has just hit the lowest value since September 2018.

Bitcoin Exchange Reserve Declines To Lows Not Seen Since Sept 2018

As pointed out by an analyst in a CryptoQuant post, the BTC exchange reserve has observed further decline recently, reaching the lowest values in more than 3.5 years.

The “all exchanges reserve” is an indicator that measures the total amount of Bitcoin present on wallets of all exchanges.

When the value of this indicator goes up, it means the supply on exchanges is rising as investors deposit their coins. Such a trend is usually bearish for the price of the crypto as holders usually transfer to exchanges for selling purposes.

On the other hand, the reserve’s value decreasing would imply that investors have been withdrawing a net amount of Bitcoin recently. This trend can prove to be bullish for the coin as it may be an indication of accumulation behavior.

Related Reading | Battle Of The Hedges: How Gold And Bitcoin Have Performed With Russia-Ukraine Conflict

Now, here is a chart that shows the trend in the price of BTC over the past four years:

The value of the indicator seems to have decreased over the past couple of years | Source: CryptoQuant

As you can see in the above graph, the Bitcoin exchange reserve has been on a downtrend since the last two years.

The metric did observe a temporary upwards trajectory during May 2021, but after a few months of sideways movement the reserve resumed its decline. Now, the indicator has hit its lowest value since September of 2018.

Related Reading | TA: Why Bitcoin Must Close Above $40K For Trend Reversal

The exchange reserve is often considered the “selling supply” of the crypto. With its value going down for such a large timespan now, some analysts believe it may be creating a supply shock in the Bitcoin market.

Due to supply-demand dynamics, such a supply shock would be quite bullish for the price of the crypto in the long term.

However, others think the lowering reserves are simply because of the market structure being redistributed, and that exchanges aren’t the only major source of selling pressure today.

Nonetheless, the reserve still trending down despite the recent struggling Bitcoin price amid uncertainty due to the Russia-Ukraine war can be a positive sign of conviction among holders.

BTC Price

At the time of writing, Bitcoin’s price floats around $38.3k, up 1% in the last week. Over the past month, the crypto has gained 3% in value.

The below chart shows the trend in the price of BTC over the last five days.

Looks like Bitcoin has moved sideways in the last few days | Source: BTCUSD on TradingView
Featured image from Unsplash.com, charts from TradingView.com, CryptoQuant.com


Bitcoin Bearish Signal: Exchange Reserves Show Sharp Increase

Bitcoin exchange reserves have shown a sudden sharp spike recently, despite being in a declining trend for months.

After Months Of Downtrend, Bitcoin Exchange Reserves Shoot Up

As pointed out by a CryptoQuant post, on-chain data shows that BTC exchange reserves have spiked up in the past couple of weeks.

The “all exchanges reserve” is an indicator that measures the total amount of Bitcoin stored in wallets of all exchanges at a particular point in time.

If the value of the metric goes down, it means investors are taking their coins off exchanges. Holders may be withdrawing their BTC to accumulate them as they might believe that the price would appreciate further. As a result, this trend could be bullish for the crypto.

On the other hand, if the indicator increases in value, it implies holders are transferring their Bitcoin to exchanges, possibly for withdrawing to fiat or for purchasing altcoins. Such a trend can prove to be bearish for the coin.

Related Reading | Bitcoin Open Interest Remains Elevated Post Dramatic Dip

Now, here is a chart that shows the trend in the BTC exchange reserves over the past few months:

The indicator seems to have spiked up recently | Source: CryptoQuant

As you can see in the above graph, the Bitcoin exchange reserves have been falling down for a while now. However, in the past couple of days, the indicator’s value has shown a sudden increase.

This rise in the reserve amounts to around 39k BTC being deposited to exchanges between yesterday and today alone.

Related Reading | The Bitcoin Saga: A Look At BTC’s History Of Up’s And Down’s

Such sharp trend is usually an indication of whale activity. The price of Bitcoin has struggled recently so it’s possible some institutional investors could be preparing to pull out from the market.

If it’s indeed a sign of whale dumping, then the outlook of the crypto’s price could be bearish at least in the near future.

BTC Price

At the time of writing, Bitcoin’s price floats around $56.4k, down 2% in the last seven days. Over the past month, the crypto has lost 8% in value.

The below chart shows the trend in the price of the coin over the last five days.

BTC’s price has mostly consolidated in the past few days | Source: BTCUSD on TradingView

Over a week ago, Bitcoin had a crash triggered by fud from the Omicron COVID variant. The coin’s price dropped to as low as $53k, but a few days ago the coin recovered its losses.

However, since then, the crypto has mostly trended sideways. It’s unclear at the moment which direction the coin might break out of this consolidation, but if the exchange reserve is anything to go by, BTC might face bearish trend soon.

Featured image from Unsplash.com, charts from TradingView.com, CryptoQuant.com

Bitcoin Bearish Signals Go Off Despite Recovery Above $44k, Dead Cat’s Bounce?

Bitcoin observes a few different bearish signals going off despite strong recovery above $44k, could it be a dead cat’s bounce?

On-Chain Data Shows Bitcoin Miners Have Started Selling, Funding Rates Have Turned Negative


As explained by a CryptoQuant post, a bunch of bearish Bitcoin signals have gone off despite some fresh movement up.

First, the miners reserve has started to decline. This indicator shows the total number of coins that miners are holding in their wallets.

A downtrend in the metric’s value suggests miners have started sending their Bitcoin to exchanges for selling purposes.

Second is the Long-Term Holder SOPR (LTHSOPR) that shows the degree of realized profits and loss for those coins that haven’t moved on the chain since at least 155 days (which means these coins belong to long-term holders).

Related Reading | Will Fear And Greed Keep Bitcoin Buyers From The Halloween Effect?

This metric has also been showing low values, implying these long-term holders are more likely to sell their coins right now.

Here is a chart showing the trend in both these indicators for Bitcoin:

The BTC miners reserve and the LTH SOPR | Source: CryptoQuant

Next is the Bitcoin exchange reserve, an indicator that measures the total number of coins present on wallets of all centralized exchanges.

The below chart shows how the reserve’s value has changed recently:

The indicator seems to showing some uptrend | Source: CryptoQuant

As the graph shows, the Bitcoin exchange reserve has started trending up after a long period of constant decline. When the metric’s value goes up, it means investors are starting to send their coins to exchanges for withdrawing to fiat or purchasing altcoins.

Finally, there is the funding rate, which highlights whether investors are finding long positions better or short ones.

funding rates look to be moving negative again | Source: CryptoQuant

As the above chart shows, the BTC funding rates have dipped below zero, signifying that short positions are more hot right now.

Related Reading | Mid-Cap Altcoins Hold Onto Highs Better Than Bitcoin And Ethereum

What Do These Indicators Mean For BTC’s Price?

All of these signals show a bearish outcome in the short term at least. However, the price has started moving up for now nonetheless.

It’s possible this recovery above $44k is just a dead cat’s jump, and that the price would move down soon as these indicators suggest, but there is still some chance this recovery holds.

At the time of writing, Bitcoin’s price floats around $44k, down 7% in the last 7 days. The below chart shows the trend in the price of the coin over the last five days.

BTC’s price has started moving up after making a touch of $39.6k | Source: BTCUSD on TradingView
Featured image from Unsplash.com, charts from TradingView.com, CryptoQuant.com

Despite Dips, Bitcoin Exchange Reserves Reach Lowest Values Since 2018

On-chain data shows Bitcoin exchange reserves continue to decline despite the recent dips, as values reach lowest since 2018.

Bitcoin Exchange Reserves Continue To Go Down

As pointed out by a CryptoQuant post, the BTC all exchanges reserve is moving down despite the recent downtrend in the price of the cryptocurrency.

The Bitcoin all exchanges reserve is an indicator that shows the total amount of coins held on all centralized exchange wallets. A dip in the value of the metric suggests investors are transferring their BTC to personal wallets, either for holding or for selling through OTC deals.

On the contrary, an increase in the indicator implies investors are sending their coins to exchanges for withdrawing to fiat and stablecoins, or for purchasing altcoins.

Here is a chart showing how the Bitcoin exchange reserve has changed over the years:

The exchange reserve continues to decline

As you can see from the above graph, the BTC all exchanges reserve has hit lows not seen since 2018. Usually, during periods of big price swings, the indicator’s value shows a spike as investors look to shift their positions in the market.

Related Reading | Bitcoin Holders Take Profits As Price Falls, Indicators Remain Bullish? 

However, despite the recent dips, the metric has only been trending downward. What’s the reason behind this? Well, one possible scenario could be that there are now more long-term holders in the market that are waiting for the price to appreciate further before they make any moves.

A downtrend in the exchange reserve is often a bullish indicator as it shows buyers are accumulating Bitcoin, while an uptrend could lead to crashes in the crypto.

Below is another chart that shows the BTC netflow indicator over the last couple of days.

Looks like the Bitcoin netflow showed a huge negative spike yesterday

The netflow indicator measures the net number of coins exiting or entering exchanges. As is apparent from the above graph, the metric had a big negative spike yesterday, which implies a large amount of BTC was pulled off exchanges.

Related Reading | Did Turkey’s President Say “We Are In A War Against Bitcoin”? An Investigation

BTC Price

Yesterday, Bitcoin’s price crashed down to $40k after peaking just below $49k a few days back. But the price has since jumped back a bit as it floats around $43k at the time of writing. The crypto is down 7% in the last 7 days, while over the past 30 days, the value is 11% less.

Here is a chart showing the trend in the price of the coin over the last five days:

BTC’s price crashes down to $40k, but quickly recovers back up a little | Source: BTCUSD on TradingView
Featured image from Unsplash.com, charts from TradingView.com, CryptoQuant

Bitcoin Exchange Reserves Lowest In 3 Years, What Does It Mean For The Price?

On-chain data shows Bitcoin exchange reserves have hit the lowest value in 3 years, here’s what it might mean for BTC’s price.

Bitcoin Exchange Reserves Lowest In 3 Years As Negative Netflows Continue

As pointed out by a CryptoQuant post, exchange reserves have been continuing their downtrend, and have now reached lows not seen since 3 years ago.

The all exchanges reserve is an indicator that shows the total amount of Bitcoin held in wallets of all centralized exchanges.

An increase in the metric’s value suggests more investors are depositing their coins for withdrawing to fiat or altcoin purchasing. On the other hand, a decrease means more buyers are moving their BTC to personal wallets for hodling or OTC deals.

Here is the latest chart for the Bitcoin all exchanges reserve:

The BTC all exchanges reserve plunges down

As the above graph shows, the value of the indicator has sharply gone down recently. The current level of the metric is the lowest it has been in the last three years.

As already mentioned before, a downtrend like this one means investors are withdrawing their coins from exchanges possibly to hodl or sell through OTC deals.

Related Reading | Indicators Show Bitcoin Might Be Gearing Up For One Last Push Up

Such values are typically bullish in the long-term as they may mean that there are more long-term holders in the market who are hodling out of exchanges.

There is another relevant indicator here, called the Bitcoin netflow, which shows the net amount of BTC entering or exiting exchanges.

A positive spike in the chart for the exchange netflows means exchanges are observing more inflows compared to the outflows. A negative value implies just the opposite.

Big spikes or a prolonged period of smaller spikes in one direction can affect the value of the exchange reserves. Naturally, positive values can increase the reserve while negative ones can decrease it.

Related Reading | Ukraine Adopts New Law To Legalize Bitcoin And Other Cryptocurrencies

The below chart shows the current trend for the exchange netflows:

The BTC netflows show big negative spikes

As expected, the netflows have been negative recently, leading to the low values of the Bitcoin exchange reserves.

What Could It Mean for BTC’s Price?

As mentioned earlier, a downtrend in the exchange reserves can be bullish for the price in the long-term as it may imply a greater amount of long-term holdings. This has also been usually true historically, but there can be certain exceptions.

However, looking at the current Bitcoin price movement, it looks like selling has been going on. But as the exchange reserves haven’t shot up (unlike the crash from the May ATH), sales are being done likely through OTC deals.

Now, depending on if most of the outflows are being done to sell through OTC deals, a bearish picture can be there instead.

BTC’s price continues to decline | Source: BTCUSD on TradingView
Featured image from Unsplash.com, charts from TradingView.com, CryptoQuant

Bitcoin Bullish Signal: BTC Exchange Reserve Plummets

Bitcoin exchange reserve has fallen off a cliff, on-chain analysis shows. This behavior is usually a bullish indicator for the BTC market.

Bitcoin All Exchanges Reserve Is Down

As pointed out by a CryptoQuant post, the BTC all exchanges reserve indicator has surged downhill over the past couple of days.

The Bitcoin all exchanges reserve is an indicator that shows the amount of BTC stored in wallets of all exchanges. When the metric’s value goes up, it means more investors are sending their crypto to exchanges.

More BTC in exchanges implies a selling pressure. On the other hand, when its value goes down, it means investors are sending their coins from exchange wallets to personal ones.

Related Reading | Bitcoin To Reach New All-Time Highs, Market Strategist

Here is a chart showing the trend in the value of the BTC all exchanges reserve over the last two months:

Bitcoin All Exchanges Reserve

The BTC all exchanges reserve seems to have steeply declined | Source: CryptoQuant

As the above graph shows, the metric has fallen down with quite the steep slope. Just over the past two days, the indicator has dropped more than 100K Bitcoin in value!

Since the value of the indicator going down means more BTC moving out of exchanges, it might mean that there is a buying pressure in the market. The price should be affected positively by this.

Related Reading | Survey Says! Institutional Investors Are Still Bullish On Bitcoin

A look at outflow charts of popular exchanges shows massive movement. Coinbase Pro saw 30k BTC exiting the platform on Wednesday, while Binance, the largest exchange by trading volume, saw around 29k BTC moving out of its wallets.

A couple of days back, Binance observed huge netflows. The price moved positively afterwards so that it’s possible that the all exchanges reserve plummeting will make the price go up this time too.

Bitcoin Price

At the time of writing, Bitcoin’s price is floating around $39.8k, up 24% in the last 7 days. Over the last month, the crypto has gained almost 15% in value.

Here is a chart that shows the trend in the price of BTC over the last 3 months:

Bitcoin Price Chart

BTC catches a sharp upwards trend | Source: BTCUSD on TradingView

After struggling in a range bound market for quite the while, Bitcoin has finally gained some of the volatility back. The rapid price swing of $34.5k to $39.5k was accompanied by the biggest short squeeze in the history of the coin as short sellers hurried to cut their loses.

The crypto is now testing the $40k resistance level, and if it can keep the rally up and push through, it’s likely that the coin will reach the $45k mark. However, if the level can’t be surpassed, BTC could fall back to a range bound market.