Bitcoin Greed No More: Sentiment Back At Neutral After $57,000 Plunge

Data shows that Bitcoin sentiment has cooled off to neutral from greed following the asset’s latest plunge to the $57,000 level.

Bitcoin Fear & Greed Index Has Returned To Neutral Levels

The “Fear & Greed Index” is an indicator created by Alternative that shows the average sentiment among investors in the Bitcoin and wider cryptocurrency market.

This index estimates sentiment by considering five factors: volatility, trading volume, social media data, market cap dominance, and Google Trends.

The metric uses a scale that runs from zero to 100 to represent this average sentiment. All values under 46 suggest that investors are fearful, while those above 54 imply a greedy market. The zone between these two cutoffs naturally corresponds to the territory of neutral mentality.

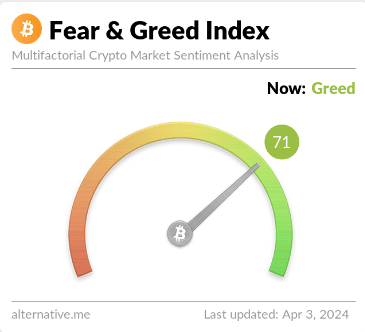
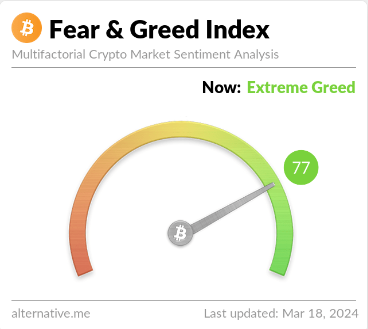
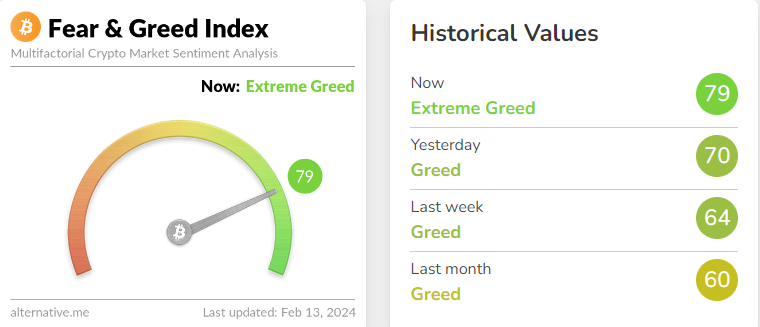
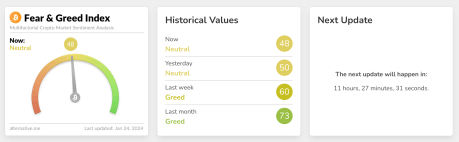
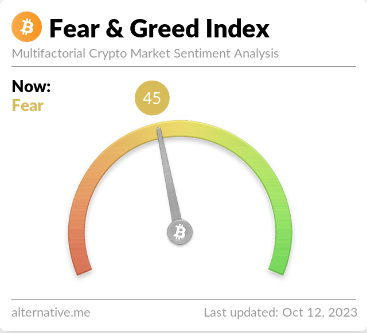
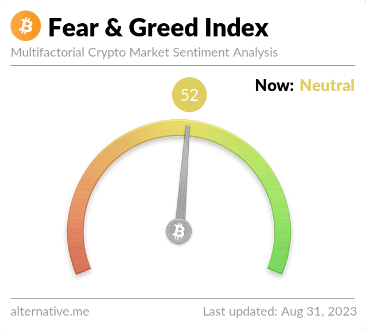
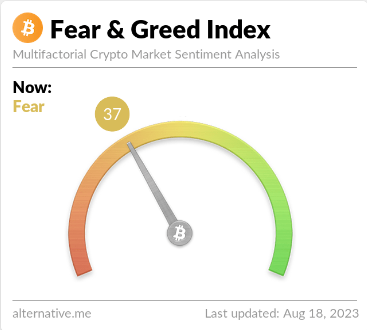
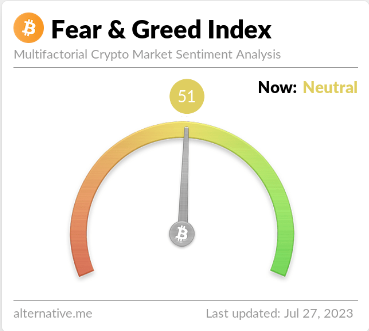
Now, here is what the Bitcoin sentiment looks like right now, according to the Fear & Greed Index:

Bitcoin Fear & Greed Index

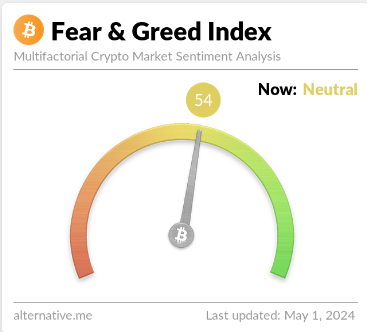
As displayed above, the Bitcoin Fear & Greed Index is at a value of 54, implying that investors share a neutral sentiment currently. However, the neutrality is only just, as the metric is right at the boundary of the greed region.

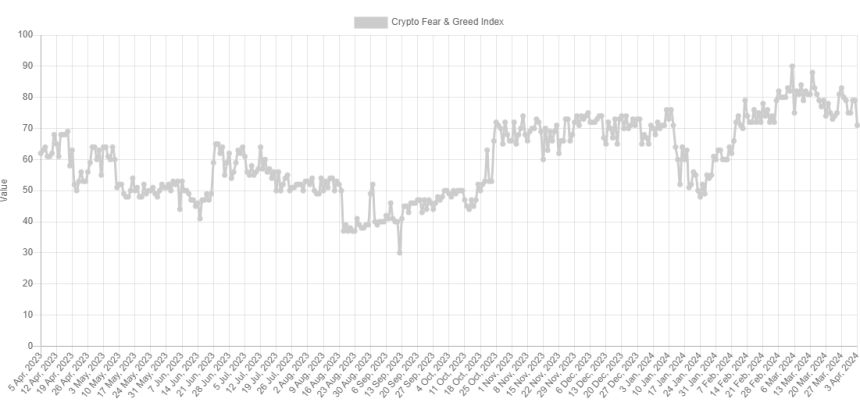
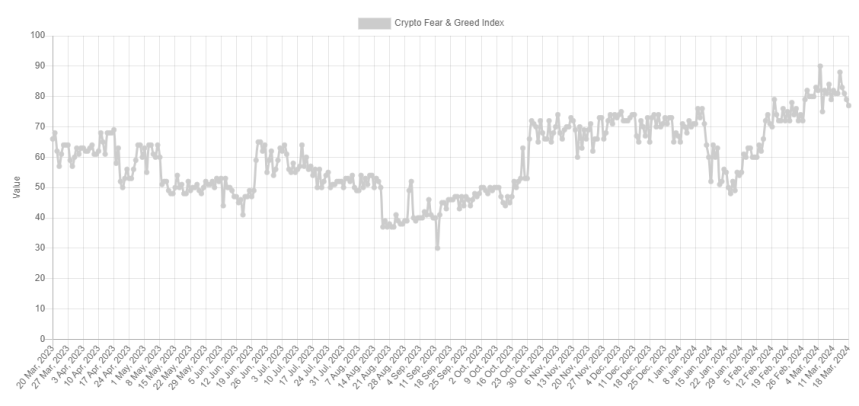
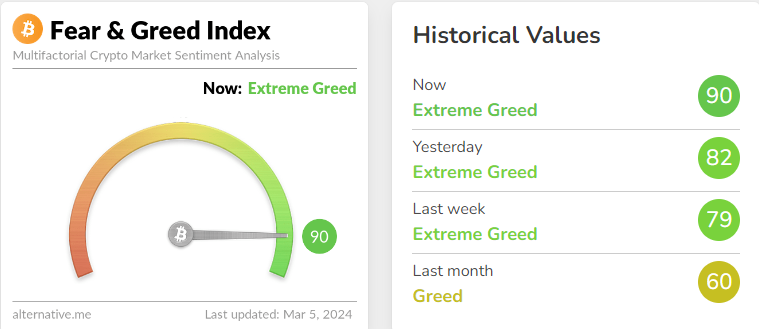
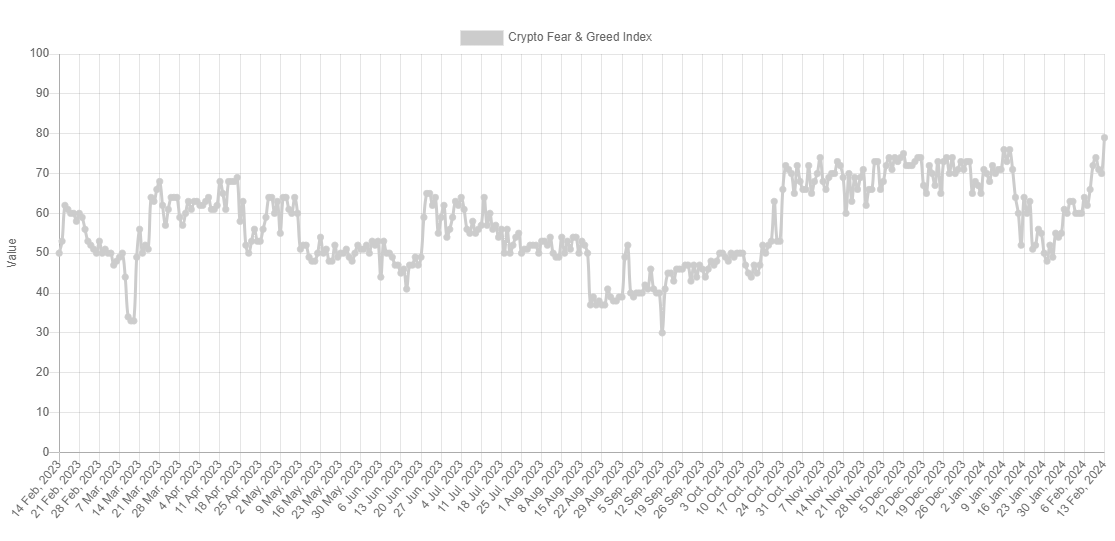
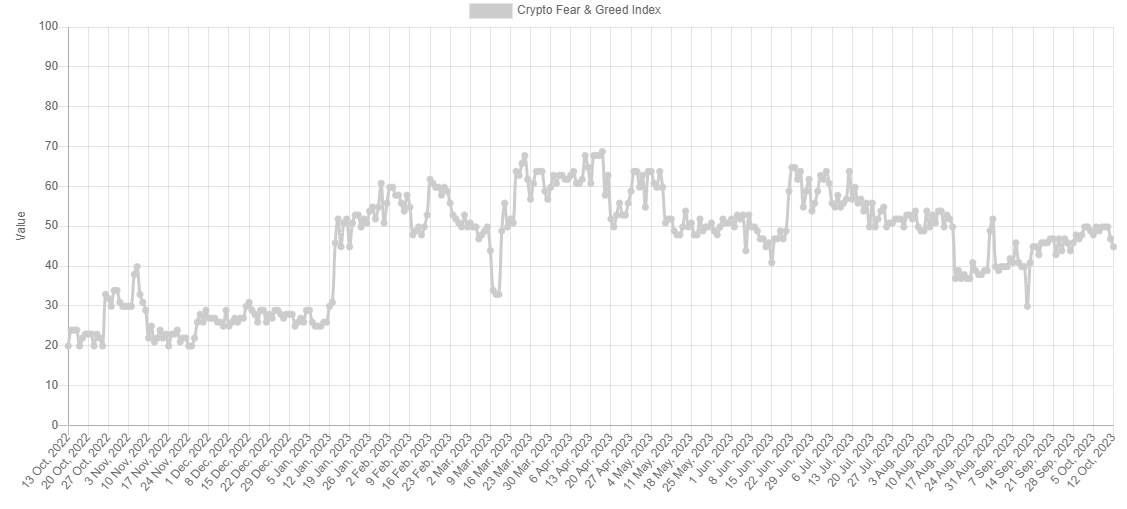
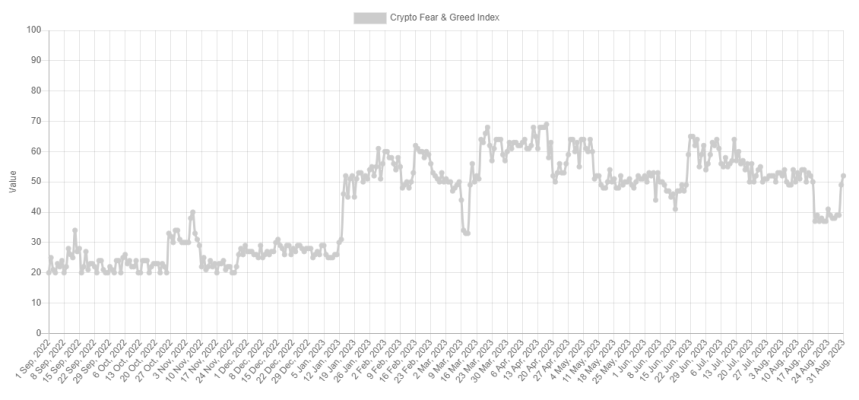
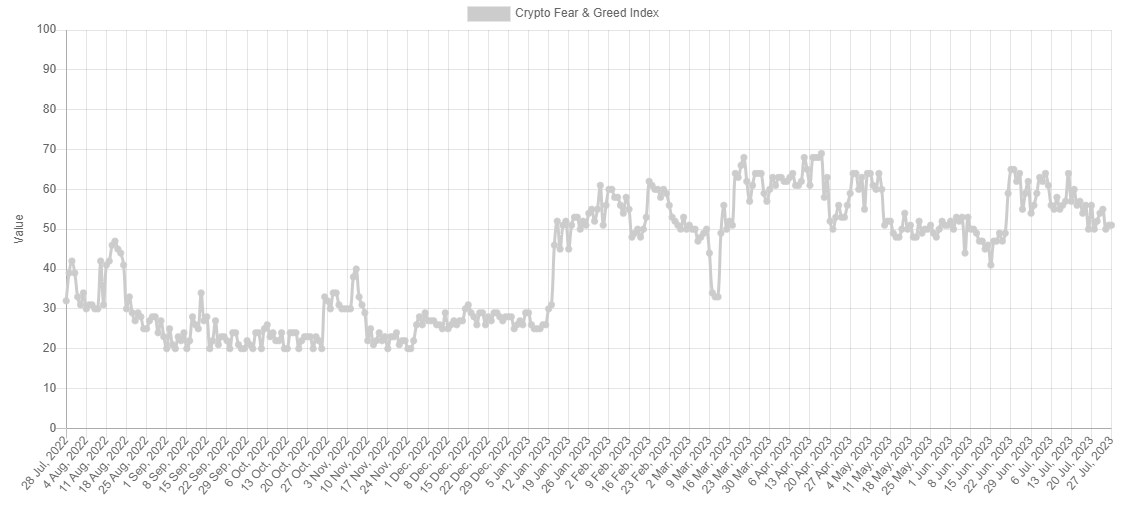
This is a significant departure from yesterday’s sentiment: 67. The chart below shows how the indicator’s value has changed recently.

Bitcoin Neutral

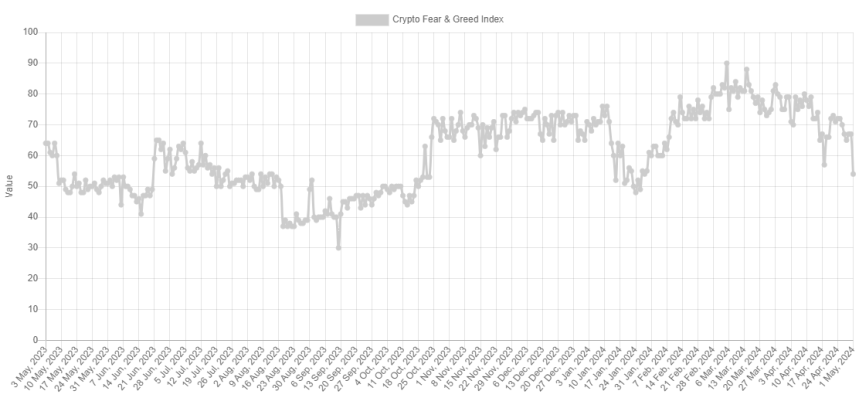
As the graph shows, the Bitcoin Fear & Greed Index has been declining recently. For most of February and March, as well as the first half of April, the indicator was in or near a special zone called extreme greed.

The market assumes this sentiment at values above 75. As the asset price struggled recently, the mentality cooled off from this extreme zone and entered the normal greed region. With the latest crash in BTC, the index has seen a sharp plunge, now exiting out of greed altogether.

Historically, cryptocurrency has tended to move against the majority’s expectations. The stronger this expectation, the higher the probability of such a contrary move.

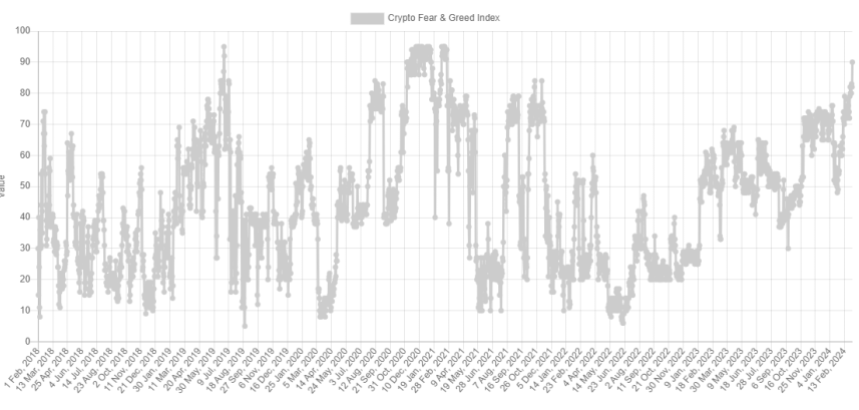
This expectation is considered the strongest in extreme sentiment zones, as well as extreme fear and greed. As such, major bottoms and tops have often occurred in these territories.

The all-time high (ATH) price last month, which continues to be the top of the rally so far, also occurred alongside extreme values of the Bitcoin Fear & Greed Index.

With the sentiment now cooled to neutral, some investors may be watching for a fall into fear. This is natural because a rebound would become more probable the worse the sentiment gets now.
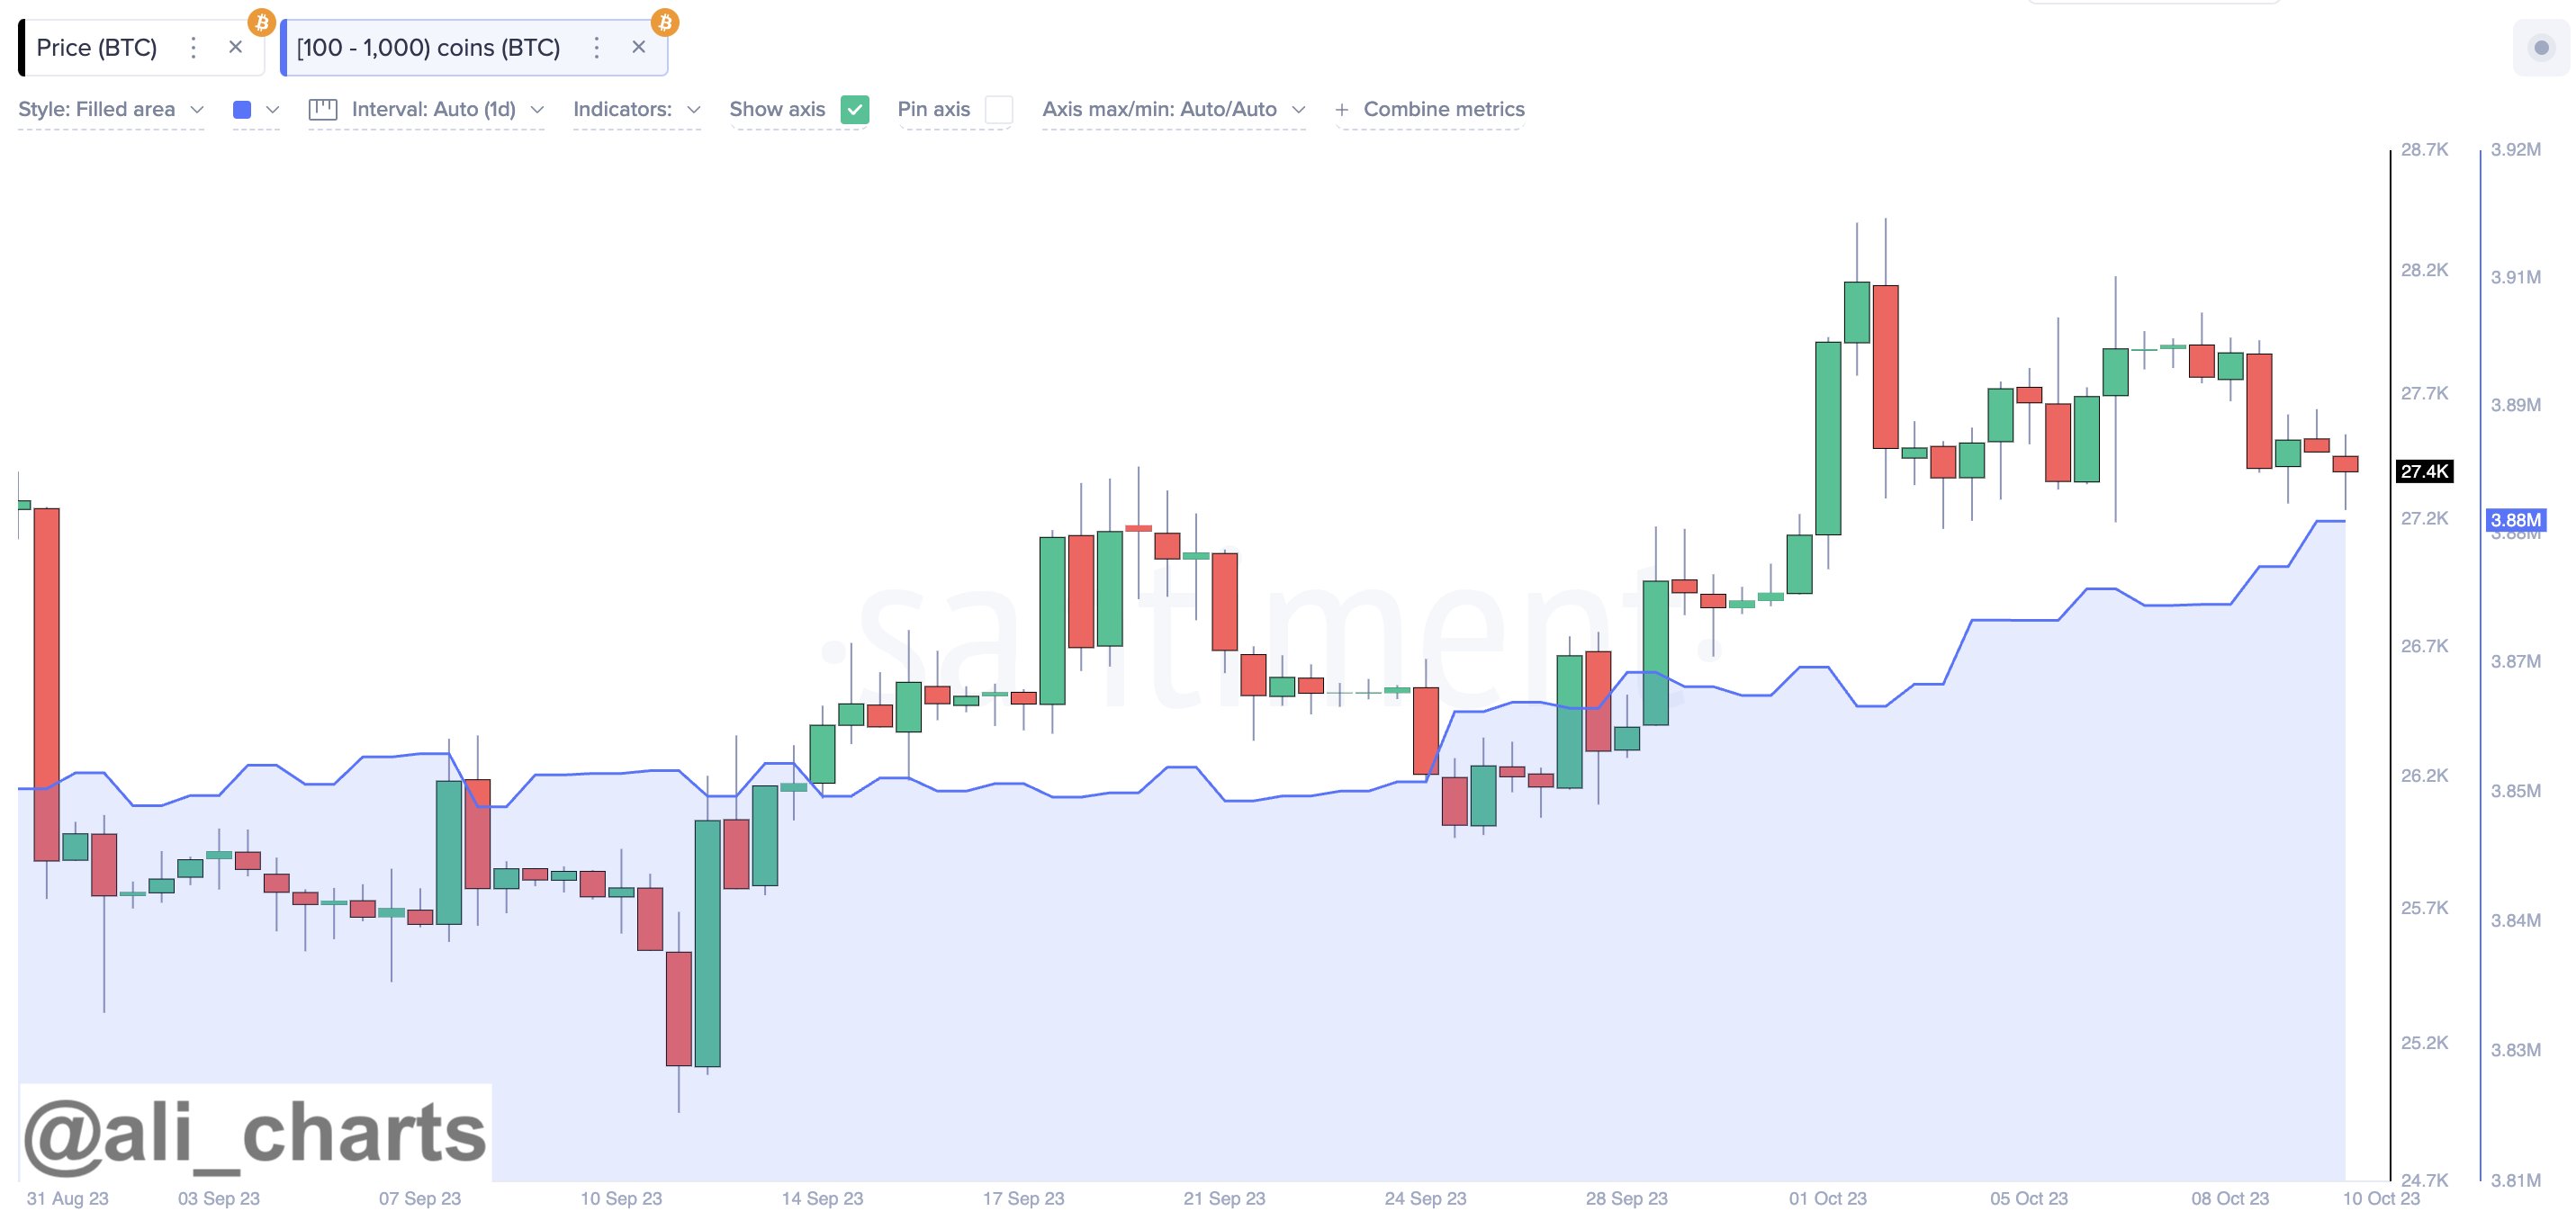
BTC Price

During Bitcoin’s latest plunge, its price briefly slipped below $57,000 before surging back to $57,300.

Bitcoin Price Chart

Bitcoin Traders No Longer Extremely Greedy: Rebound Signal?

Data shows that Bitcoin investor sentiment has cooled to the lowest level since February, something that could facilitate a rebound in the price.

Bitcoin Fear & Greed Index Now Points At Just ‘Greed’

The “Fear & Greed Index” is an indicator created by Alternative that tells us about the general sentiment among investors in the Bitcoin and broader cryptocurrency sector.

This metric uses a numeric scale from zero to hundred to represent the sentiment. To calculate the score, the index considers the data of five factors: volatility, trading volume, social media sentiment, market cap dominance, and Google Trends.

All values of the indicator above the 53 mark suggest the presence of greed among the investors, while below the 47 level implies a fearful market. The region between these two corresponds to the neutral sentiment.

Here is how the latest value of the Bitcoin Fear & Greed Index looks:

Bitcoin Fear & Greed Index

As is visible above, the Bitcoin Fear & Greed Index currently has a value of 71, implying that the investors share a majority sentiment of greed. Just yesterday, the index’s value had been notably higher than this, implying that there has been a bit of a cooldown of sentiment in the past 24 hours.

Below is a chart that shows the trend in the index over the past year.

Bitcoin Fear & Greed Index

Besides the three core sentiments, there are also two “extreme” sentiments: extreme greed and extreme fear. The former occurs at values above 75, while the latter occurs under 25.

The Bitcoin Fear & Greed Index was 79 yesterday, implying that the market had been extremely greedy. The indicator has been regularly inside this zone for the past month, so the current normal greed values go against the trend.

The sentiment among investors has naturally been so high recently because the BTC price has gone through a sharp rally in this period and has explored fresh all-time highs (ATHs).

The Bitcoin price has historically tended to go against the majority’s expectations. And the stronger this expectation has been, the more likely such a contrary move will occur.

Due to this reason, the extreme sentiments have been where reversals in the asset have been the most probable to take place in the past. For instance, the current ATH of the asset formed when the index was at a value of 88.

With the recent price drawdown, sentiment has also taken a hit. The fact that it has fallen out of the extreme greed zone, though, may be conducive to a bottom forming. The earlier bottom, around 20 March, also formed when the index exited the zone.

The current level of the Bitcoin Fear & Greed Index is not only lower than it was then but also the lowest since 11 February, when the asset was still trading around $48,000.

BTC Price

Bitcoin is now down to the $65,800 level after facing a drawdown of more than 7% over the last few days.

Bitcoin Price Chart

Bitcoin Sentiment Returns To Extreme Greed As BTC Breaks $71,000

Data shows the Bitcoin market sentiment has returned to the extreme greed territory as BTC has registered its rally beyond the $71,000 level.

Bitcoin Fear & Greed Index Now Points To “Extreme Greed”

The “Fear & Greed Index” is an indicator made by Alternative that tells us about the general sentiment among the investors in the Bitcoin and wider cryptocurrency market.

This index represents the sentiment as a score between zero and hundred. To calculate this value, the indicator takes into account the data of these factors: volatility, trading volume, social media sentiment, market cap dominance, and Google Trends.

When the indicator has a value of 46 or less, it means that the average investor holds a sentiment of fear right now. On the other hand, a value of 54 or more implies the market shares a majority mentality of greed. Naturally, the region in-between these two (47 to 53) corresponds to the neutral sentiment.

Now, here is what the latest value of the Bitcoin Fear & Greed Index looks like:

Bitcoin Fear & Greed Index

As is visible above, the Bitcoin Fear & Greed Index is at 81 right now, meaning that it’s deep into the greed region. In fact, this value is so deep that it’s inside a territory known as “extreme greed.”

Extreme greed occurs when the index hits values higher than 75. Fear also has its own extreme region; this one occupying values under 25. Historically, these two sentiments have proven to be particularly significant for the market.

BTC and other assets in the sector have often tended to move in the opposite direction from what the majority expect. In the territory of the extreme sentiments, this expectation is naturally the strongest, and hence, the probability of a contrary move taking place is also the highest.

Because of this reason, major tops and bottoms in Bitcoin’s price have typically taken shape when the cryptocurrency has been inside the respective extreme zones.

Earlier in the month, the Fear & Greed Index had assumed especially high extreme greed levels, as the asset’s rally towards new all-time highs (ATHs) had occurred.

Two of the major tops in this period, including the current ATH, coincided with peaks in the indicator, implying that the overheated sentiment may have once again played a role.

Bitcoin Fear & Greed Index

With the recent drawdown in the asset, though, the sentiment also cooled off and exited out of the extreme greed territory, as is visible in the above chart. In bullish periods, the sentiment retreading back to the normal greed region can be a positive sign for fresh upward moves to start.

And indeed, this has followed for the cryptocurrency this time as well, as its price has made notable recovery over the past couple of days. With the coin making a return back towards $71,000, the sentiment has also heated up again, hence why the index’s latest value is pointing at extreme greed.

The aforementioned tops from earlier in the month occurred at Fear & Greed Index values of 90 and 88, respectively, suggesting that the current extreme greed value of 81 may not be too high for another peak to be probable.

BTC Price

Bitcoin had broken above the $71,000 level earlier in the day, but the digital asset has since registered a bit of a pullback towards $70,700.

Bitcoin Price Chart

Bitcoin Sentiment Cools Off, Price Rebound Soon?

The Bitcoin Fear & Greed Index shows that the sentiment around the asset has cooled off a bit recently, something that could pave the way for a rebound.

Bitcoin Fear & Greed Index Has Gone Through Some Decline Recently

The “Fear & Greed Index” is an indicator created by Alternative that tells us about the average sentiment present among the investors in the Bitcoin and wider cryptocurrency market

To determine the trader mentality, the index takes into consideration for these five factors: volatility, trading volume, social media sentiment, market cap dominance, and Google Trends.

The metric uses a numeric scale that runs from zero to hundred for representing this sentiment. A score of 46 or less implies the presence of fear among the investors, while that of 54 and above suggests greed in the market.

The territory between these two (47 to 53) naturally corresponds to the neutral mentality. Besides these three sentiments, there are also two extreme sentiments called “extreme greed” and “extreme fear.”

The extreme greed occurs at values above 75, while the extreme fear takes place below 25. Historically, these two sentiments have been quite relevant for BTC’s trajectory.

Tops have generally tended to form when the investors have held the former sentiment, while bottoms have been probable to happen when the market has been in the latter region.

At present, the traders are holding a mentality of extreme greed, as the latest data of the Bitcoin Fear & Greed Index shows.

Bitcoin Fear & Greed Index

As is visible, the indicator’s value is 77 right now, meaning that while it’s indeed inside extreme greed, it’s only so just. This is a fresh change from how it has been recently, as the chart below displays.

Bitcoin Extreme Greed

From the graph, it’s visible that the Bitcoin Fear & Greed Index has mostly stayed deep inside the extreme greed region recently. On the 14th of this month, the indicator hit the 88 mark, and alongside this high, the BTC price registered its current all-time high of about $73,800.

Since this peak, though, the asset has plunged, and it appears that alongside it, so has the sentiment among the traders. As mentioned earlier, tops have been more likely to occur when the market has shared a mentality of extreme greed and this probability has generally only gone up the more extreme levels the metric has hit.

This could perhaps explain why the recent top occurred when it did. Another top this month, the one that took place on the 5th, also coincided with high values in the Fear & Greed Index (a peak of 90 this time).

Shortly after this earlier peak and the plummet in the cryptocurrency that had followed, the asset found its bottom as the metric briefly exited the extreme greed region.

As the Bitcoin Fear & Greed Index is once again looking to dip outside this territory, it’s possible that a bottom may be near for the price this time as well. It now remains to be seen if the sentiment would cool down enough in the coming days so as to leave the extreme region behind, at least temporarily.

BTC Price

Bitcoin had plunged towards $64,500 during the weekend, but it seems the coin has made some recovery in the past day as it’s now back at $68,000.

Bitcoin Price Chart

Bitcoin Extreme Greed At Levels Higher Than Nov. 2021 Peak, Top Signal?

Data shows the Bitcoin sentiment has now reached extreme greed levels higher than even those at the price all-time high (ATH) in November 2021.

Bitcoin Fear & Greed Index Is Deep Inside Extreme Greed Territory Now

The “Fear & Greed Index” is an indicator created by Alternative that keeps track of the general sentiment present among the investors in the Bitcoin and wider cryptocurrency market right now.

The metric represents this average sentiment in the form of a score lying in the zero to hundred range. To calculate this score, the index takes into account the following five factors: volatility, trading volume, social media sentiment, market cap dominance, and Google Trends.

When the indicator shows a value less than 47, it means that the sentiment around the sector is that of fear. On the other hand, the index being above the 53 mark implies the presence of greed among the investors. Naturally, the region between these two territories belongs to the neutral mentality.

Besides these three main sentiments, there are two “extreme” sentiments called extreme fear and extreme greed. The former of these occurs at and below 25, while the latter is 75 and above.

Now, here is what the Bitcoin Fear & Greed Index currently looks like:

Bitcoin Fear & Greed Index

As is visible above, the Bitcoin Fear & Greed Index’s current value is 90, which means that the investors are holding a strong sentiment of extreme greed. This latest value is quite the jump from the sentiment from yesterday, when the index was around 82.

The reason behind this sharp increase in the indicator is obviously because of the fact that the cryptocurrency’s price has been pushing towards a new all-time high during its latest rally.

The current level of the Fear & Greed Index isn’t only high compared to the recent trend, but also when considering the historical data. The below chart shows how the metric’s value has fluctuated since its inception back in 2018:

Bitcoin Extreme Greed

As displayed in the graph, the Bitcoin Fear & Greed Index has now surpassed the level that it assumed during the November 2021 price all-time high, as it stands at values just below those observed between late 2020 and early 2021.

Besides this period, there has only been one other instance in the history of the metric where it has achieved levels higher than now: the rally peak during mid-2019.

Historically, Bitcoin has tended to move against the expectations of the majority, and as this expectation has leaned more towards one side, the probability of such a contrary move taking place has only gone up.

The top in the 2019 rally and November 2021 are just two such examples of this pattern in action. As such, it’s possible that the current extreme levels of the indicator mean that the price is at risk of forming a top right now.

It should be noted, however, that a top doesn’t necessarily have to immediately follow, as during the first half 2021 bull run, the metric was able to maintain at even higher levels for a while, without the rally being compromised.

BTC Price

Bitcoin was on the brink of setting a new all-time high just earlier, but its price has since cooled off towards the $66,700 level.

Bitcoin Price Chart

Bitcoin Fear & Greed Index Reaches Highest Level Since 2021, What To Expect Next

The Bitcoin Fear & Greed Index has risen to its highest level in almost three years, hitting Extreme Greed at rocket speed. Using past performance and indicators, it is possible to deduce where the BTC price is headed next after reaching this new milestone.

Bitcoin Fear & Greed Index At New 2-Year High

The Bitcoin Fear & Greed Index is a measure of investor sentiment and how they are looking at the market. This can help to figure out if investors are currently putting money into the market or if they are taking money out of it.

There are five major categories across the Fear & Greed Index, including Extreme Fear, Fear, Neutral, Greed, and Extreme Greed. The index is ranked on a scale of 0-100, with a range of numbers representing a category of investor sentiment.

Extreme Fear is the lowest on this scale, which ranges from 0 to 25. Then, from 26 to 46, we have the Fear. Both of these categories indicate an unwillingness of investors to enter the market and have often presented as the best time to invest in crypto.

Next on the scale is 47 to 52, which represents the Neutral territory. Then 53 to 75 is Greed when investors are beginning to feel confident in the market. Finally, 76 to 100 is Extreme Greed, which represents peak bullishness. As the Bitcoin Fear & Greed Index currently sits at 79, which is Extreme Greed, it could carry some implications for the market.

BTC price chart from Tradingview.com (Bitcoin Fear & Greed Index)

Extreme Greed Marks The Top?

Just as the Bitcoin Fear & Greed Index can be helpful in determining what is a good time to buy, it can also provide pointers for when a market top might be in. Looking through the historical performance of the crypto market compared to the Fear & Greed Index, we see a persistent correlation between peak euphoria and the market top.

The most recent example of this is November 2021, when the index’s score climbed to as high as 84, just 5 points shy of the current 79 score. At this point, the price of Bitcoin had risen to $69,000 before meeting resistance, which it will eventually succumb to,

In the following days, sentiment would begin turning, as did the price of Bitcoin. A similar pattern was also seen in February and March 2021 when the index hit a high of 94. The next few days saw interest taper off, marking the peak at that particular point.

If the same pattern were to be repeated in this scenario, then Bitcoin could have another few days of runway before it blows off top. Presently, the cryptocurrency is already seeing significant resistance at $57,000, which could suggest that the top is near.

Extreme Greed Is Back For Bitcoin, Is It Time To Sell?

Data shows extreme greed sentiment has made a return among the Bitcoin investors after the cryptocurrency’s price has broken above $50,000.

Bitcoin Fear & Greed Index Now Points Towards “Extreme Greed”

The “Fear & Greed Index” refers to an indicator that tells us about the general sentiment among Bitcoin traders and broader cryptocurrency sectors.

The metric represents this sentiment using a numerical scale from zero to hundred. According to Alternative, its creator, the index calculates this score using five factors: volatility, trading volume, social media sentiment, market cap dominance, and Google Trends.

When the Fear & Greed Index has a value of 54 or greater, the investors now share a sentiment of greed. On the other hand, values of 46 or less imply the presence of fear among the traders.

The region between these two ranges (values 47 to 53) corresponds to the territory of “neutral” sentiment. In addition to these three core sentiments, “extreme fear” and “extreme greed” occur at the deep ends of the fear and greed ranges.

Here is what the Bitcoin Fear & Greed index looks like right now to see which of these regions the market is in:

Bitcoin Fear & Greed Index

As displayed above, the Bitcoin Fear & Greed Index has surpassed the 75 threshold for extreme greed during the past day and has attained a value of 79. The metric was at 70 yesterday, so it has seen a bit of a jump in just the last 24 hours.

This surge in sentiment from greed to extreme greed has occurred as cryptocurrency broke past the $50,000 barrier for the first time since December 2021.

Historically, the extreme sentiments have been quite significant for the asset, as major bottoms and tops for the price have occurred in these regions. This relationship between the two, however, has been inverse.

Extreme fear has been when bottoms have taken shape, while extreme greed has been where tops have formed. In the past, Bitcoin has usually tended to move against the majority’s expectations. This expectation is the strongest in these ranges, so it makes sense that a reversal is the primarily likely here.

Followers of a trading philosophy called “contrarian investing” exploit this fact to time their buying and selling moves. “Be fearful when others are greedy, and greedy when others are fearful” is a famous quote from Warren Buffet that sums up the idea.

As the chart below shows, the last time the Fear & Greed Index attained extreme greed levels was around the time of the spot ETF approval.

Bitcoin Extreme Greed

As BTC investors are very well aware, the coin hit a top coinciding with the event as the market took to selling the news. Since the sentiment is now back inside extreme greed with its latest surge, another similar reversal point may be close for its price.

Perhaps it’s at a time like this when a contrarian investor would consider moving towards selling, going against the hype and euphoria floating around the market.

BTC Price

Bitcoin has enjoyed a surge of over 4% in the past day, which has taken its price towards the $50,000 mark.

Bitcoin Price Chart

Bitcoin Fear & Greed Index Reaches Lowest Level In Three Months, Is The Bleed Over?

Amid the current market turmoil, the Bitcoin Fear & Greed Index has continued on a sharp decline. This decline has seen the index fall to its lowest level in over three months as crypto investors become more fearful and hold their investments from the market.

Bitcoin Fear & Greed Index Takes A Nosedive

In the months leading up to the end of the year 2023, the Bitcoin Fear & Greed Index climbed steadily until it reached high greed levels. Now, this index takes a number of factors into consideration to place investor sentiment across a number of categories ranging from Extreme Fear, Fear, Neutral, Greed, and Extreme Greed.

The Fear & Greed Index represents investor sentiment using scores between 1 and 100, with the lower end of the score representing fear levels and the higher ends representing greed. A score between 1 and 25 puts investor sentiment in Extreme Fear, 26-46 is Fear, 47-52 is Neutral, 53-75 is Greed, and 76-100 is Extreme Greed.

In 2023, the score climbed as high as 74 as Bitcoin rallied toward $50,000. However, as the market has retraced, so has investor sentiment, which is currently trending toward fear. At the time of writing, the Bitcoin Fear & Greed Index is showing a score of 58, which puts it in Neutral territory. It is also two scores down from the previous day’s figures of 50 which means that investor sentiment is trending more toward fear than greed.

Bitcoin Fear & Greed Index

The current figure is the lowest that the index has been since October 2023. The last time the Bitcoin Fear & Greed Index fell below 48 was on October 17 2023. In cases like these, it shows that investors are less inclined to put money into the market. This causes demand to fall, and as a result, prices of assets across the space suffer for it.

Bitcoin price chart from Tradingview.com (Fear & Greed Index)

When Will The Bleed Stop?

So far, the decline in the Bitcoin price has been triggered by massive outflows from the Grayscale Bitcoin Trust (GBTC) as investors redeemed their shares. Over $2 billion in BTC has flowed out from the fund, and this has put a lot of selling pressure on the asset.

However, as the week progresses, the outflows are expected to slow down as investors stop selling. In such a case, the demand would be all to catch up with the supply being dumped on the market, thereby giving Bitcoin and other assets a chance to recover.

At the time of writing, the Bitcoin price is still trending around $40,000 after a bounce back from a dip to $38,500. The price is up 2.6% in the last week, according to data from Coinmarketcap.

Bitcoin Plunge Below $27,000 Drives Investors Into Fear, Will Rebound Occur?

Data shows the Bitcoin drop below the $27,000 level has made most investors fearful for the first time this month.

Bitcoin Fear & Greed Index Is Pointing At “Fear” Right Now

The “fear and greed index” is an indicator that tells us about the general sentiment among investors in the Bitcoin and broader cryptocurrency market. Alternative created the metric, and according to the website, it’s based on these factors: volatility, trading volume, social media sentiment, market cap dominance, and Google Trends data.

The indicator uses a numeric scale from zero to hundred to represent the sentiment. When the index has a value greater than 54, it means that the average investor is greedy right now, while it being under 46 implies a fearful mentality is dominant.

The region between these two thresholds naturally signifies a neutral sentiment among the holders. Until today, the sector had been stuck inside this region since the last couple of days of September, as the investors had been split about the trajectory of Bitcoin.

The chart below shows that the market sentiment has worsened with the latest drop in the cryptocurrency’s price below the $27,000 level.

Bitcoin Fear & Greed Index

After this latest drop in sentiment, the fear and greed index has hit a value of 45, meaning that investor sentiment has just entered the fear region.

Bitcoin Fear

Historically, the market has tended to move in a way that’s opposite to what the majority of the investors believe. The likelihood of such a contrary move happening increases as this imbalance in the sentiment rises.

While the holders are leaning towards one side (fear), the imbalance is small, as the fear and greed index is barely inside the territory. As such, the probability of a rebound would be pretty high right now (at least based on the sentiment).

Besides the core sentiments discussed before, there are also two special zones, called “extreme fear” (at or below values of 25) and “extreme greed” (at or above values of 75).

These regions are where the cryptocurrency has often turned around in the past. Naturally, bottoms have occurred in the former zone, while tops have formed in the latter area.

If the Bitcoin fear and greed index continues declining in the coming days and reaches values near the extreme fear region, a bounce could become a real possibility.

For now, one sign pointing to the chances of a rebound may be that the large investors have been buying recently, as an analyst on X pointed out.

Bitcoin Whales

Since the start of October, Bitcoin investors holding between 100 and 1,000 coins have purchased a combined 20,000 BTC worth around $533.6 million at the current exchange rate.

BTC Price

At the time of writing, Bitcoin is trading at around $26,700, down almost 5% in the past week.

Bitcoin Price Chart

Bitcoin Sentiment Returns To Neutral, Will Traders Embrace Greed Next?

Data shows that Bitcoin investors may be close to embracing greed as market sentiment has surged into neutral territory.

Bitcoin Fear & Greed Index Points At Neutral Trader Sentiment

The “Fear & Greed Index” is an indicator that tells us about the general sentiment among the investors in the Bitcoin and wider cryptocurrency sector. According to the index’s creator, Alternative, the metric takes into account multiple factors for calculating this sentiment.

The five factors it currently uses in the indicator’s value are namely: volatility, trading volume, social media sentiment, market cap dominance, and Google Trends data. Earlier, the index also made use of surveys, but for now, they are on pause.

To represent the market sentiment, the fear and greed index uses a numeric scale that runs from 0-100. All values above the 54 mark suggest greed among the traders, while values below 46 imply fear. The in-between region means the presence of a neutral mentality.

Besides these three basic sentiments, there are also two extreme sentiments, called “extreme fear” (taking place below 25) and “extreme greed” (occurring above 75). Historically, these two regions have been quite significant for Bitcoin, as cyclical bottoms and tops have usually formed in the respective zones.

Now, here is what the Fear & Greed Index looks like for the market right now:

Bitcoin Fear & Greed Index

According to the index, the investors as a whole are sharing a neutral sentiment, meaning that they aren’t leaning one way or the other. Although, at the current 52 value, the metric is certainly closer to the greed territory than the fear one.

Earlier in the month, when BTC witnessed a crash from the $29,000 level to below the $26,000 mark, the sentiment in the market naturally plummeted. Investors had become fearful and had remained so for the duration that the asset consolidated around these lows.

After the rally spurred by Grayscale’s lawsuit victory, though, the sentiment rapidly registered an improvement and surged toward the current neutral values.

The below chart represents how the Fear & Greed Index’s value has changed recently:

Bitcoin Fear & Greed Index

While the sentiment in the market has seen a rapid improvement with the latest rally, the investors haven’t quite yet made up their minds if they want to give in to greed or not.

It’s possible that more positive price action would need to happen before the investors are able to fully embrace the bullish momentum.

Nevertheless, a break into the greed territory would naturally be a green signal for any surge’s sustainability, as it would mean that the majority of the investors are ready to support the move.

BTC Price

After observing a pullback since the rally high, Bitcoin is currently trading around the $27,200 level, with investors still enjoying profits of about 3% over the past week.

Bitcoin Price Chart

Bitcoin Investors Fall Into Fear As BTC Crashes To $26,500

Data shows the Bitcoin market sentiment has plunged into fear as the cryptocurrency’s price has observed a crash to the $26,500 level.

Bitcoin Fear & Greed Index Points At “Fear” In The Market

The “Fear & Greed Index” is an indicator that tells us about the general sentiment among investors in the Bitcoin and wider cryptocurrency market. This metric uses a numeric scale that runs from 0-100 for displaying the sentiment.

All values above the 54 mark suggest the presence of greed among the investors, while those below 46 imply a majority mentality of fear. The region between these cutoffs reflects the neutral sentiment.

As for how the index calculates the sentiment, Alternative.me, the creator of the metric, explains that it takes into account several different factors. Namely; volatility, trading volume, social media sentiment, market cap dominance, and Google Trends are what the indicator currently makes use of to pinpoint the market mentality.

Now, here is what the Bitcoin Fear & Greed Index’s value looks like right now:

Bitcoin Fear & Greed Index

As you can see above, the index’s value is 37 currently, which suggests that the majority of the investors are fearful. This latest value of the indicator reflects a new shift in the sector, as prior to today, the indicator had been stuck inside the neutral territory for more than three weeks straight.

The below chart displays the trend in the fear and greed index over the past year.

Bitcoin Fear

From the graph, it’s visible how sharp this latest drop in the metric has been. In a flash, the market sentiment went from being completely neutral (50), to firmly inside the fear territory (37).

The reason behind this hit to the investor mentality has been the sharp crash that Bitcoin has observed during the past day, as the cryptocurrency’s price has now slumped below $26,500.

Earlier, when the index was consolidating in neutral territory, investors had been hesitant and undecided. But with this price action, it would appear that their mind has been made up, and they think that the asset would go down even lower.

Historically, the market has actually tended to make moves that the majority of the holders aren’t expecting. The harder investors lean toward any one direction (fear or greed), the more probable price action of the opposite type becomes.

The Bitcoin Fear & Greed Index also has two sub-sentiments inside fear and greed called extreme fear and extreme greed. These take place at values below 25 and above 75, respectively. Cyclical bottoms and tops in the asset have usually always formed whenever the market has been inside these zones, showcasing the aforementioned effect in action.

As the market hasn’t yet dipped too deep into the fear region, the probability of a bottom is likewise not raised too much yet. Back in March, however, Bitcoin did manage to find its bottom when the investors were fearful to a degree not much greater than right now.

It now remains to be seen how the market sentiment will develop in the coming days, and if BTC will be able to find its bottom off the back of this fearful situation.

BTC Price

At the time of writing, Bitcoin is trading around $26,400, down 10% in the last week.

Bitcoin Price Chart

Bitcoin At Decision Point As Investors Hold Neutral Sentiment

Bitcoin may be at a decision point right now as investor sentiment is exactly neutral. Which way will the market tip in the coming days?

Bitcoin Fear & Greed Index Suggests Market Is Neutral

A few days back, Bitcoin had observed a sharp plunge that had taken the cryptocurrency’s value towards the $29,000 level. In the days that followed, the asset had only consolidated around these relatively low levels, but during the last 24 hours, things appear to have changed a bit.

The impetus for this latest volatility appears to have been the US Federal Reserve (Fed) hiking interest rates by an expected 25 bps. Shortly after the FOMC meeting had announced this increase, Bitcoin started to surge, giving investors hope that the coin may be traveling back toward the $30,000 level.

This new rise, however, seems to have already run out of steam, as BTC has fallen back to lower levels. At the time of writing, Bitcoin is trading around $29,400, down 2% in the past week.

Bitcoin Price Chart

While Bitcoin has retraced from its peak during the past day, the cryptocurrency is still up a net amount in this period, meaning that the asset has managed to hold onto some recovery nonetheless.

The fact remains, though, that the coin has been unable to keep up its upward trend, a sign that the market is still perhaps indecisive about its direction. This is reflected in the general investment sentiment in the space, as the “Fear & Greed Index” shows.

Bitcoin Fear & Greed Index

The Fear & Greed index makes use of various market-related metrics (like volatility, dominance, and volume) to judge what the most likely sentiment of the average participant in the sector is currently.

This index has a value of 51 right now, which means that the Bitcoin investor sentiment is almost exactly in the balance. This lack of direction in the market isn’t a new development; the investors have been leaning towards neutrality for a week or so now.

Bitcoin Neutral

The current neutral sentiment must not be confused with a lack of interest in Bitcoin, however, as data from the on-chain analytics firm Santiment shows that the share of social media discussions related to the 100 largest assets in the cryptocurrency sector occupied by BTC alone (the “social dominance“) is now at a two-week high.

Bitcoin Social Dominance

The traders look to have an active interest in Bitcoin at the moment, but their collective opinion isn’t favoring any one side. In situations like these, it’s generally hard to say which way the cryptocurrency might go in next.

Related Reading: Bitcoin Exchange Supply Only Slips Further Despite Price Decline

If this indecisiveness in the market stays in the coming days, though, it’s likely that BTC’s stagnation will continue further, as moves in either direction (if any) may not be able to go on for long.