Will Bitcoin Break $74,000 Driven By TradFi FOMO?

Willy Woo, an on-chain analyst, believes the Bitcoin upswing is far from over. Citing the development in the Bitcoin Macro Oscillator and the possibility of traditional finance jumping on the bandwagon (FOMO), the odds of BTC rallying in at least two strong legs up in the coming session could not be discounted. 

On-Chain Data Signals More Upside For Bitcoin

In a post on X, Woo remains confident about what lies ahead for the world’s most valuable cryptocurrency. Based on on-chain development, there are indicators that the coin may firmly push higher, breaking above the current lull.

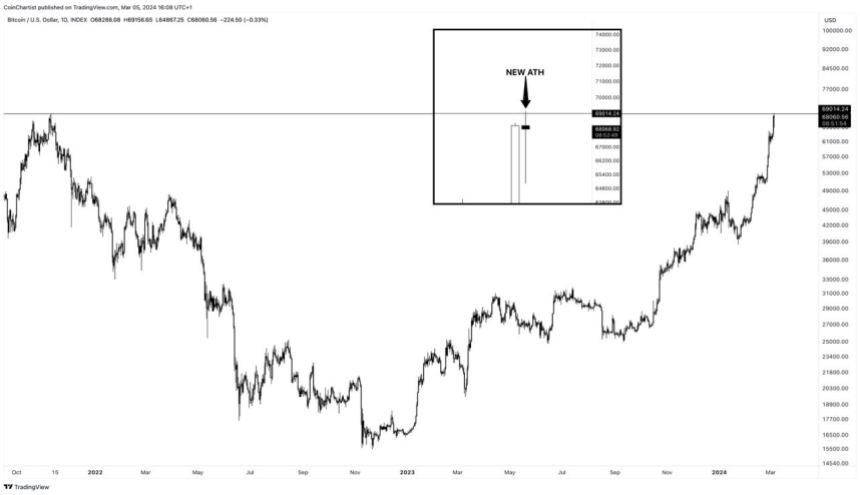
Bitcoin remains mostly range-bound when writing, trading within a tight zone capped by $73,800 on the upper end and $69,000 as immediate support. Even with analysts being confident of what lies ahead, the coin has failed to overcome strong selling momentum from sellers to breach all-time highs in a buy-trend continuation.

Bitcoin price trending upward on the daily chart | Source: BTCUSDT on Binance, TradingView

From how the coin is set up, the current sideways movement may be accumulation or distribution, depending on the breakout direction. For instance, any upswing above $72,400 might spur demand, lifting the coin towards $73,800. Conversely, losses below $69,000 and the middle BB might see BTC slump to March 5 lows or even lower.

Will TradFi FOMO And Short Squeeze Lift BTC?

Even with the slowdown in upside momentum, Woo says there is strong potential for “another solid leg up.” The analyst also added that there could be two surges if TradFi investors “FOMO” into Bitcoin. In the 2017 bull run, the rally to $20,000 was primarily due to retailers jumping in and FOMOing on the coin. 

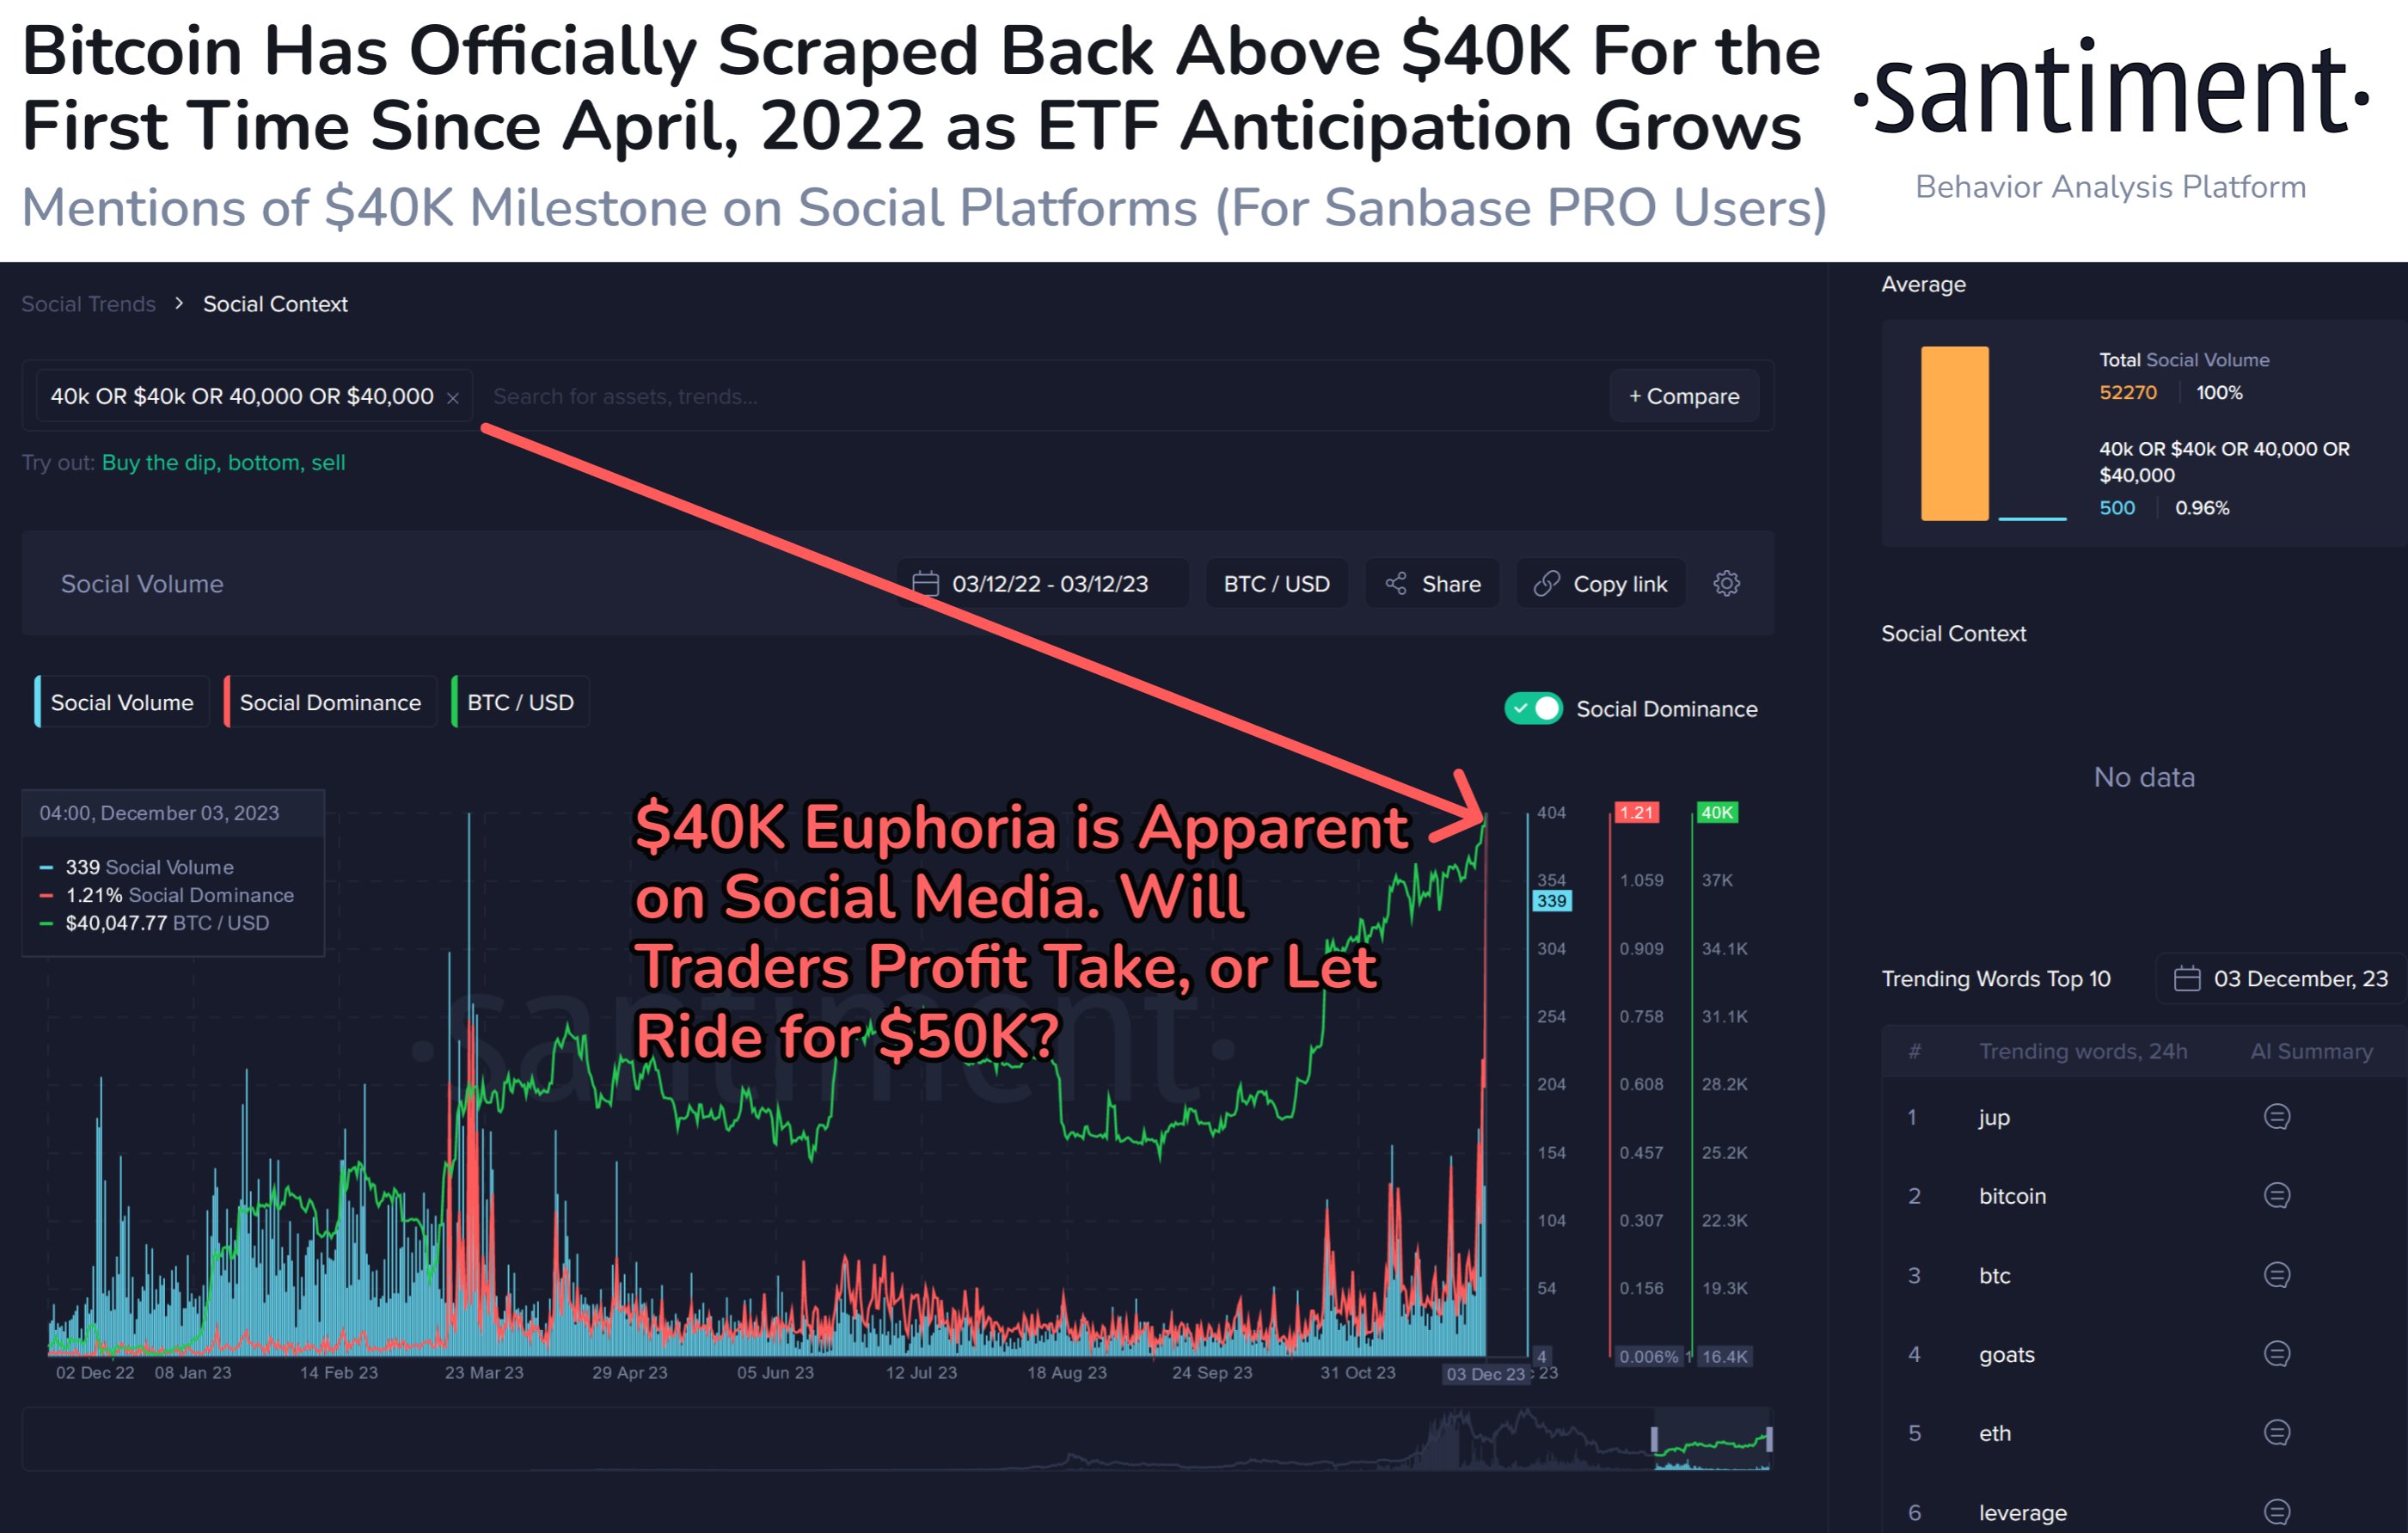
With spot Bitcoin exchange-traded funds (ETFs) available in the United States, speculation is that more institutions and high-net-worth individuals are buying the coin. If BTC rips higher, breaking $74,000, more inflow will likely be into the multiple spot Bitcoin ETFs, fueling demand.

This bullish outlook comes when other analysts expect Bitcoin to surge in the sessions ahead. In a post on X, one analyst says the incoming short squeeze will likely propel the coin above March highs. Whenever a short squeeze happens, prices rise, forcing sellers to buy back at higher prices, accelerating the uptrend.

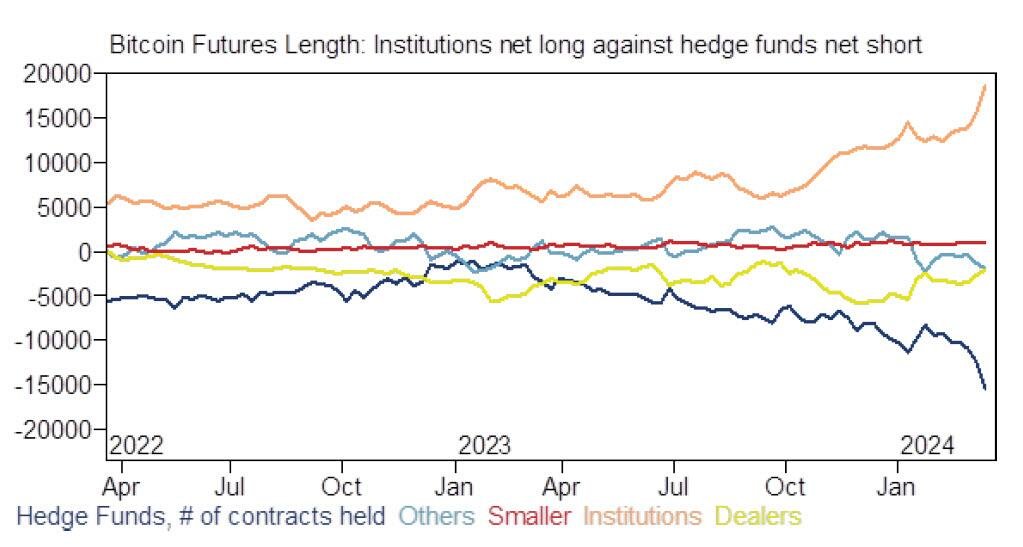
The assessment is behind a record-breaking gap between institutional investors betting on price increases and hedge funds selling the coin. 

Bitcoin FOMO: Over 533,330 Addresses Bought Above $70,180

On-chain data suggests more than 533,330 addresses FOMO’d into Bitcoin above $70,180. Following the latest plunge, these investors would all be in losses.

Over 500K Bitcoin Addresses Have A Cost Basis Between $70,180 & $71,340

As pointed out by analyst Ali in a post on X, many investors have bought at the recently high price levels. Below is the chart shared by the analyst that shows how the distribution of the BTC supply looks right now across the various price ranges.

Bitcoin Cost Basis

The data is from the market intelligence platform IntoTheBlock, which has used on-chain data to determine the average acquisition price for any given address based on when its coins moved into its balance.

In the chart, the size of the dots represents the amount of coins that have their cost basis inside the corresponding range. It would appear that the $64,743 and $66,700 range is below the current price that hosts the cost basis of a significant amount of addresses.

More particularly, 382,000 addresses acquired 275,450 BTC at these levels. As the Bitcoin spot price is currently trading above this range, all these investors would naturally be carrying some profits.

Generally, investors are sensitive to retests of their cost basis, as such retests can potentially flip their profit-loss status. For holders who were in profit before the retest, the dip may appear as an opportunity to buy more.

The emerging reaction can be significant when many hands share their cost basis inside the same narrow range. If this retest occurs from above, the asset could feel some support as these investors rush to accumulate more.

Since the $64,743 to $66,700 range is dense with investors and is situated below the current spot price of the cryptocurrency, it could act as a major support center.

“Monitoring this level closely is crucial, as losing it could shift the focus to the next significant demand zone between $60,760 and $62,790, safeguarded by 797,500 addresses with over 298,000 BTC,” notes Ali.

In terms of the levels above, the $70,180 to $71,340 range particularly stands out, as 533,330 addresses bought a total of almost 433,000 BTC. A lot of these new buyers would be those FOMO’ing into the asset after seeing it explore new all-time highs.

This large block, however, may serve as a point of resistance for the cryptocurrency. These fresh hands might sell just as quickly as they bought in when a retest of their cost basis happens since they may be willing to just exit at their break-even, fearing more drops in the near future.

BTC Price

Bitcoin has seen a sharp correction during the past day, following which its spot price is now trading around the $67,900 level.

Bitcoin Price Chart

Bitcoin Sets New All-Time High Above $69,000 As Institutionals Show FOMO

Bitcoin has set a new all-time high (ATH) above the $69,000 level as institutional investors have aggressively bought on Coinbase.

Bitcoin Has Set A New ATH Above $69,000

The moment that every Bitcoin investor had been looking forward to has finally arrived today. The cryptocurrency just smashed past the record set in November 2021 to create a brand new ATH beyond the $69,000 level.

Bitcoin All-Time High

This historical moment has come for the asset as institutional investors have been showing some strong buying pressure recently.

Bitcoin Coinbase Premium Index Spikes To Highest Levels For 2024

As an analyst in a CryptoQuant Quicktake post explained, US institutional investors appear to be scrambling to buy Bitcoin as they are starting to feel FOMO with the sharp bullish momentum the cryptocurrency has enjoyed.

The metric of interest here is the “Coinbase Premium Index,” which keeps track of the percentage difference between the Bitcoin prices listed on cryptocurrency exchanges Coinbase (USD pair) and Binance (USDT pair).

The former exchange is the preferred platform for institutional traders based in the US, while the latter serves more global traffic. As such, the Coinbase Premium Index can provide hints about the differences in the buying and selling behaviors of the two groups.

When the indicator has a positive value, the price listed on Coinbase is higher than on Binance. Such a trend implies that the buying pressure is higher (or selling pressure is lower) from the US-based investors compared to Binance users.

On the other hand, the negative metric suggests that American institutional traders may be applying relatively high selling pressure on the market.

Now, here is a chart that shows the trend in the Bitcoin Coinbase Premium Index over the past few months:

Bitcoin Coinbase Premium Index

As displayed in the graph, the Bitcoin Coinbase Premium Index has registered a large positive spike recently, implying the difference between the prices on Coinbase and Binance has widened.

The indicator had been floating inside the green territory for a while before this spike, and in this period of high buying pressure on Coinbase, the coin observed a sharp rally.

This recent buying pressure would probably include sources like the spot exchange-traded funds (ETFs) approved this year. From the chart, it’s visible that the buying pressure has been even higher in the last couple of weeks, culminating in the latest spike.

Interest around the asset among these institutional entities had only been growing recently, but the latest spike suggests FOMO has gone up a level for these investors.

Given that institutional buying has been one of the main forces behind the latest rally in the cryptocurrency, it’s no wonder that its price has hit a fresh high off the back of the latest spike.

Bitcoin FOMO Hasn’t Spiked Yet: Green Signal For Rally To Continue?

Data shows social media users aren’t yet showing FOMO around Bitcoin, a sign that the current rally could still have the potential to continue.

Bitcoin Social Volume Hasn’t Been Too High Recently

According to data from the analytics firm Santiment, the crowd FOMO that may be associated with a rally like BTC has seen recently hasn’t yet cropped up on social media.

The indicator of interest here is the “Social Volume,” which keeps track of the total amount of discussion any given topic or term is receiving on the major social media platforms right now.

The metric measures this by counting up the posts/threads/messages that are making at least one mention of the given term. The reason it tracks the number of posts themselves rather than the mentions is so that a few threads with a significant number of mentions can’t skew the indicator by themselves.

When a topic truly receives widespread attention on social media, a large number of posts crop up as users across the platforms participate in talks. Mentions, on the other hand, can sometimes spike just because some niche circles decide to discuss the term.

As such, measuring Social Volume through posts is what provides a better representation of the general trend being followed. Now, here is a chart that shows the trend in the indicator for terms related to Bitcoin and cryptocurrency:

Bitcoin Social Volume

As displayed in the above graph, the Bitcoin Social Volume hasn’t been too out of the ordinary recently, despite the sharp rally that the asset’s price has witnessed.

Generally, the indicator tends to rise as rapid moves in the cryptocurrency take place since users get spurred to talk more about the coin. When discussions rise too high, though, it’s often a sign that FOMO is increasing in the sector.

Historically, Bitcoin has tended to move against the expectations of the majority, so such a rise in FOMO has often resulted in top formations for the asset. When discussions rise alongside a drawdown instead (that is, a signal that FUD is going up), a bottom rather takes place for the coin.

From the chart, it’s visible that last month, the indicator registered a spike around the time of the spot ETF approvals, which coincided with the top, but such FOMO hasn’t reappeared for the coin yet.

“Despite Bitcoin’s +74% price rise in 4 months, the crowd FOMO that would normally be associated with this kind of surge has not been present,” notes the analytics firm.

“There was certainly an interest in BTC in the weeks directly before and after the SEC’s approval of 11 ETF’s, but the lack of new greed in the space can actually be considered a promising sign that this rally can continue,” explains Santiment.

BTC Price

Bitcoin has seen some pullback in the past day as its price has slipped under the $51,000 level.

Bitcoin Price Chart

Bitcoin Triumphs Over $41,000, But Here’s What Could Prevent $50,000

Bitcoin has broken past the $41,000 level during the past day, but FOMO could be the number one danger to a further surge towards $50,000.

Bitcoin Social Dominance Has Spiked Following The Rally

According to data from the on-chain analytics firm Santiment, signs of euphoria have appeared among Bitcoin traders following the latest climb in the asset’s price.

The main indicator of interest here is the “social dominance,’ which is based on another metric called the “social volume.” This latter indicator basically tells us about the amount of discussion related to a given topic that is happening on the major social media platforms right now.

The metric tracks this by going through each post/thread on these platforms to see if they are making mentions of the topic or not. However, rather than counting the number of mentions themselves, it separates the posts and counts the total number of them instead.

Because of this approach, a more organic overview of the market becomes apparent, as the indicator will only spike when discussions are happening across social media, rather than inside just one or two large threads.

The social dominance compares this social volume of any given coin against that of the top 100 cryptocurrencies combined. Thus, whenever this indicator shoots up, it means that the mindshare related to the asset is going up among social media users.

Now, here is a chart that shows the trend in both the Bitcoin social volume and social dominance over the past year:

Bitcoin Social Dominance

As displayed in the above graph, the Bitcoin social dominance observed a huge increase when the Bitcoin price broke above $40,000 during the past day. This implies that users shifted focus toward BTC from the other coins after this rally.

While some attention is healthy (it’s even required, otherwise the move would become unsustainable), too much hype has often not turned out to be favorable for the cryptocurrency in the past.

An example of this is clearly visible in the chart, where the BTC rally hit its brakes back in March of this year after the social volume and social dominance both registered significant spikes.

Going by this, the current even higher values of social dominance could be a worrying sign for the asset’s hopes of rallying toward the $50,000 mark. Though, so far, BTC has still been able to continue its climb despite this development, as it has now broken past the $41,000 barrier as well.

In the end, it comes down to whether the discussions have a bullish or a bearish view. More of the latter would provide better chances for the rally to continue. As Santiment explains, “FUD & FOMO toward the ongoing ETF confirmation dates will dictate whether $50,000 arrives sooner rather than later.”

BTC Price

It would appear that Bitcoin isn’t done with its surge yet as the coin has now risen above $41,800, inching closer to $42,000.

Bitcoin Price Chart