Bitcoin 40% Of Way Through Bull Run If This Metric Is To Go By

A pattern in the holdings of the Bitcoin long-term holders may suggest that the current bull run is 40% of the way to completion.

Bitcoin Long-Term Holders Have Been Distributing Recently

In a new post on X, Glassnode lead analyst Checkmate discussed the recent behavior of the long-term Bitcoin holders. The “long-term holders” (LTHs) here refer to the BTC investors who have been holding onto their coins for over six months.

Statistically, the longer an investor holds onto their coins, the less likely they become to sell them at any point. Since the LTHs hold for significant periods, they are considered quite resolute.

And indeed, they display this resilience in their behavior, rarely selling despite whatever is happening in the broader market. As such, the times they sell are all the more noteworthy.

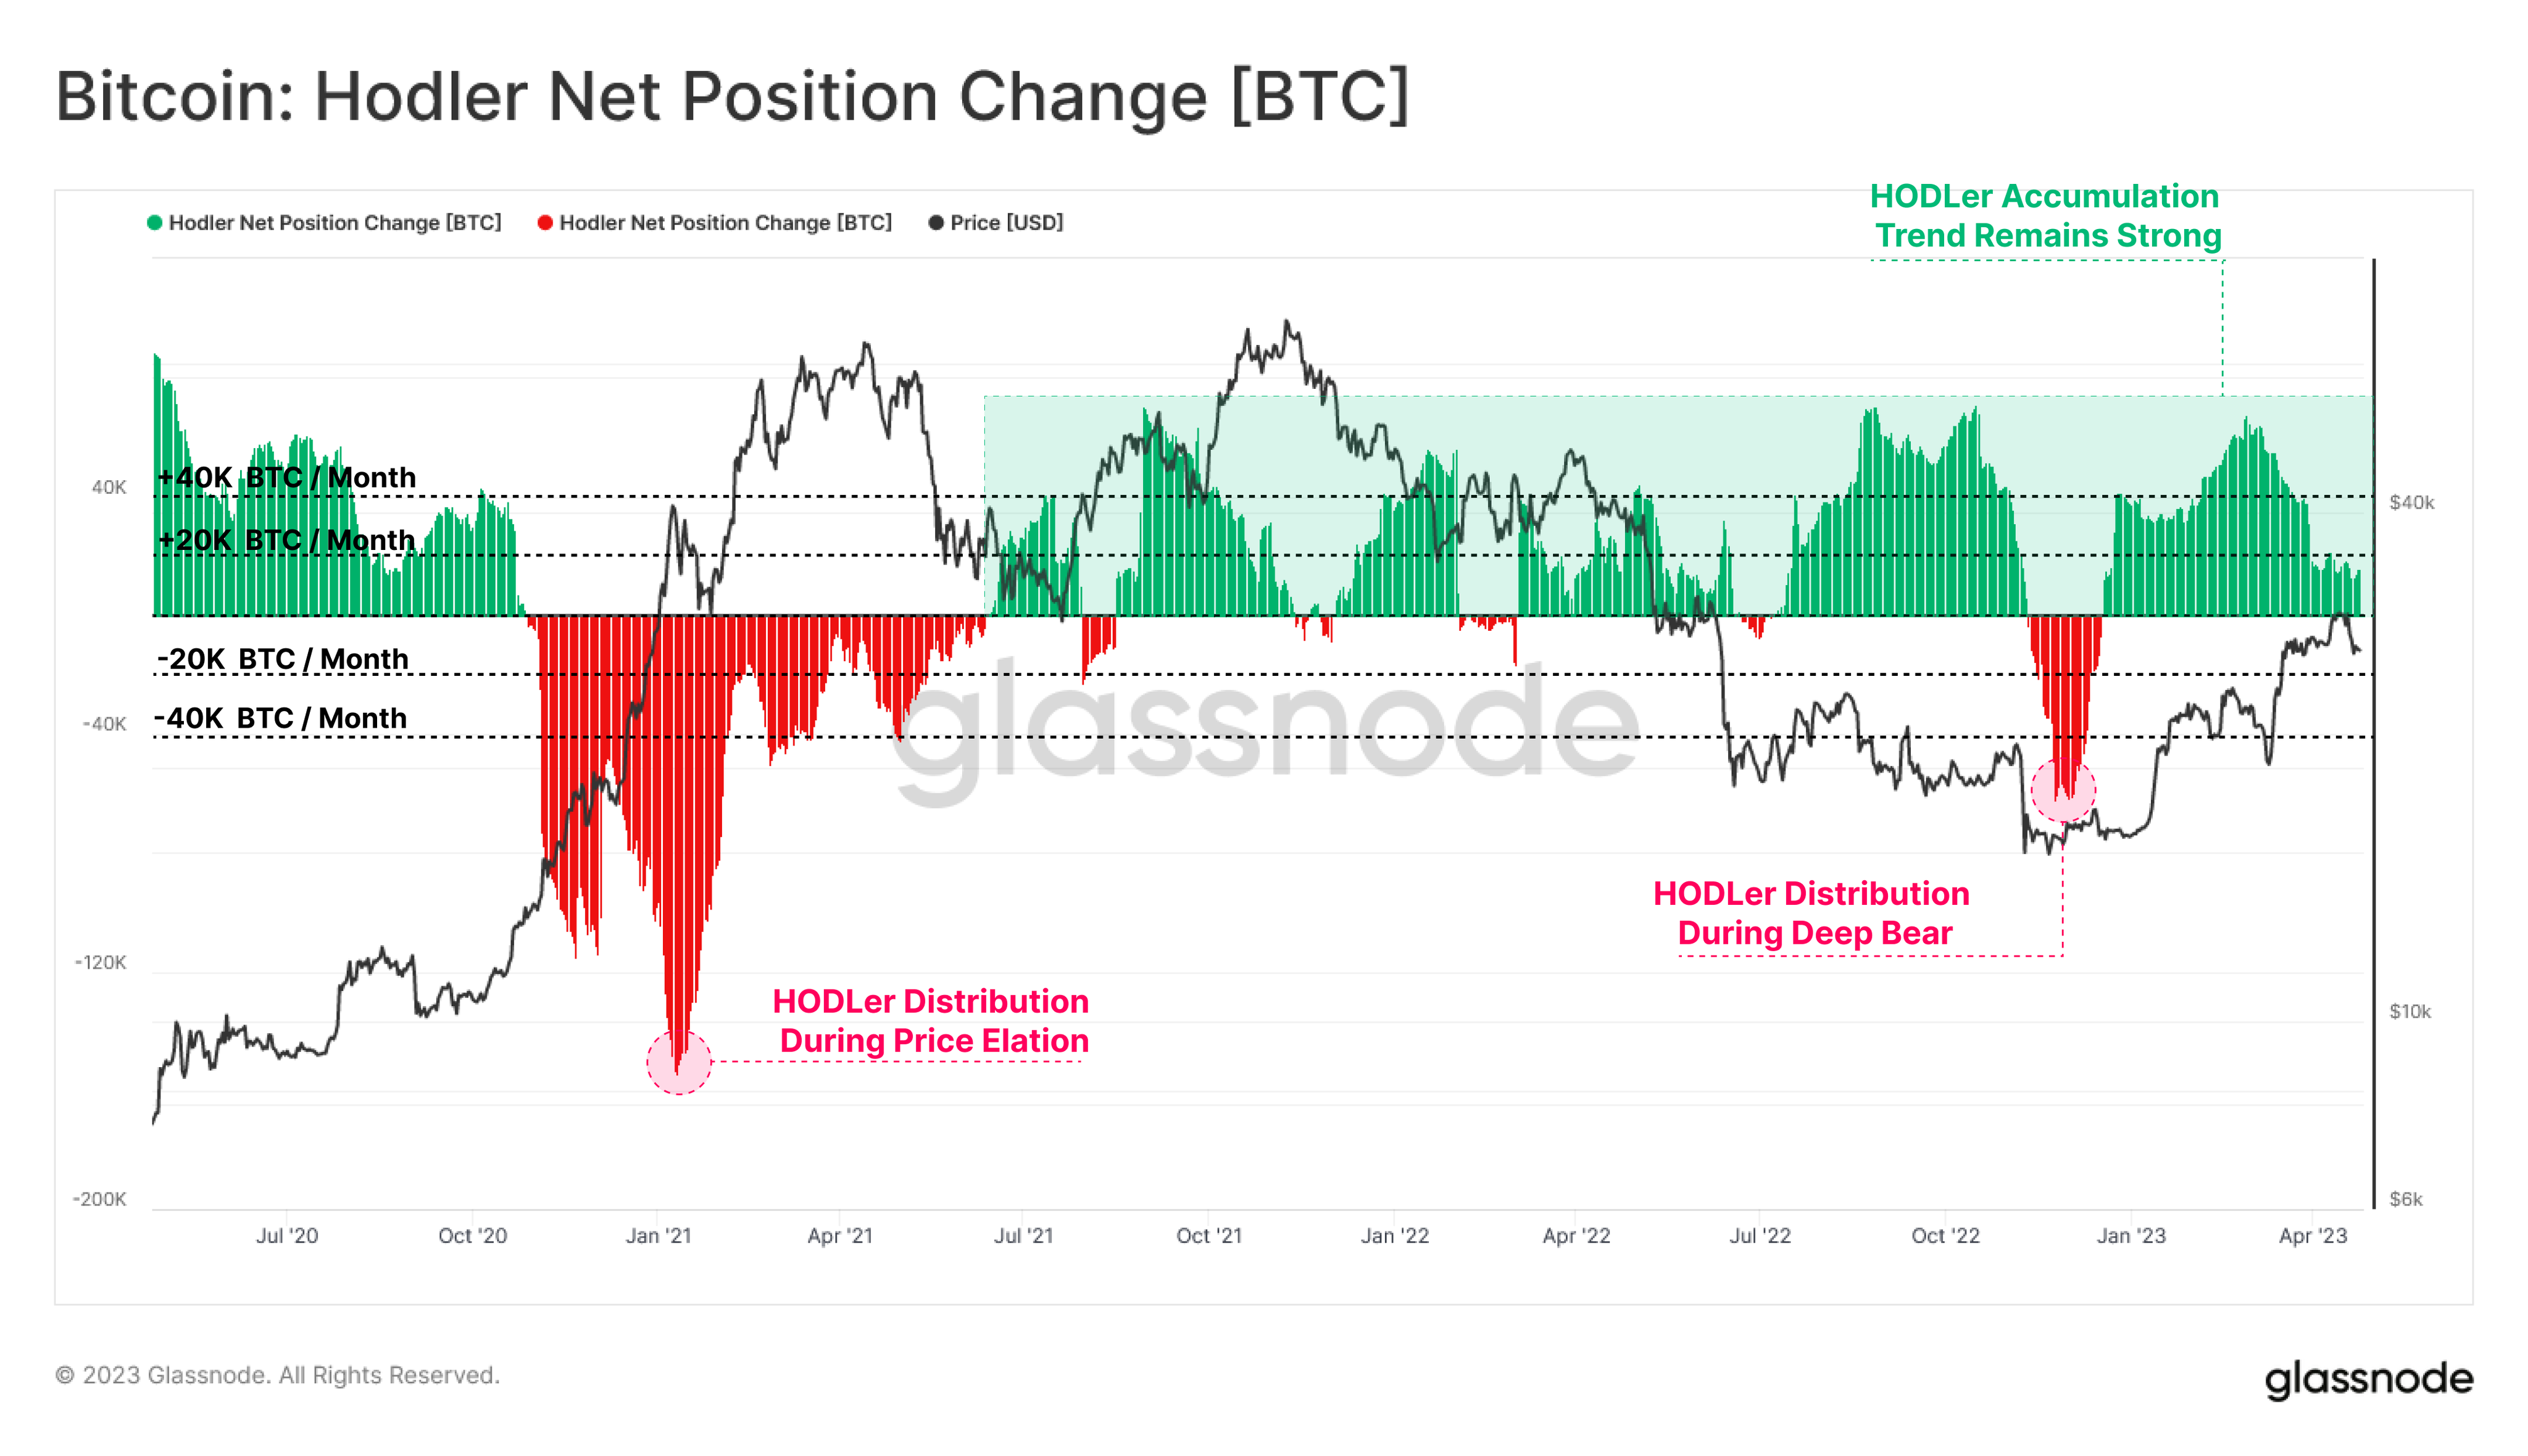
Historically, the LTHs have taken to distribution during bull runs when the asset has broken its previous all-time high (ATH) price. Due to their long holding times, these investors amass large profits, which they start to spend when a high amount of demand comes in during bull rallies that happily take coins off their hands at high prices.

Checkmate explained that the recent ATH break of the cryptocurrency has looked similar to any other past one, with the LTHs already having started spending for this round.

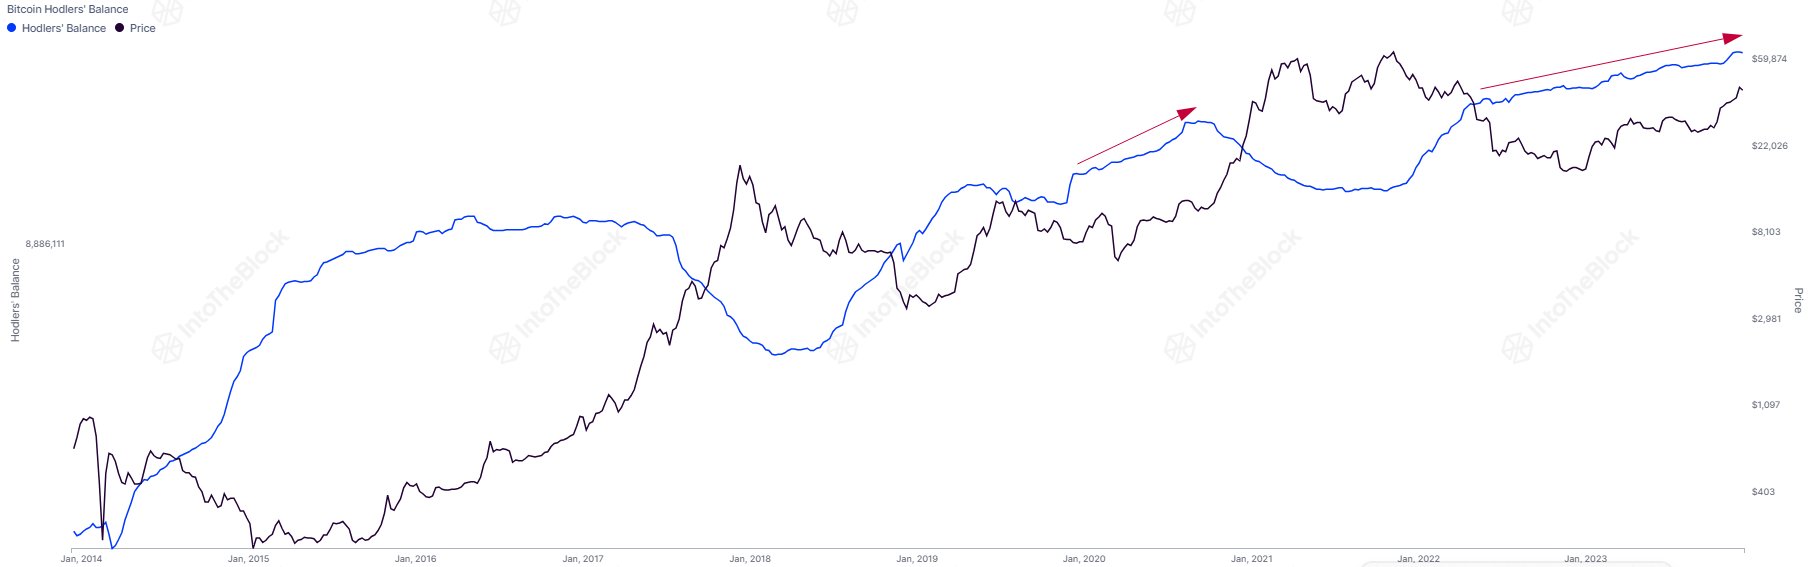
The chart below shows the trend in the supply of Bitcoin LTHs over the past few years.

Bitcoin Long-Term Holders

As displayed in the above graph, the Bitcoin LTHs have recently observed their supply heading down. Remember that when it comes to increases in this metric, there is a delay associated with when buying is happening and when this supply is going up.

This is natural because the newly bought coins must age for six months before they can be considered a part of the cohort’s holdings. When it comes to drawdowns, though, the same delay doesn’t emerge, as the age of the coins instantly resets back to zero, and they exit the group.

Thus, the latest distribution from the LTHs is indeed happening. “In the prior two cycles, new demand for Bitcoin was able to absorb this LTH sell-side for around 6-8 months while pushing prices multiples higher,” explains the Glassnode lead.

The chart below shows that the LTH supply has typically gone through a drawdown of around 14% during these bull run selloffs.

Bitcoin LTH Selloff

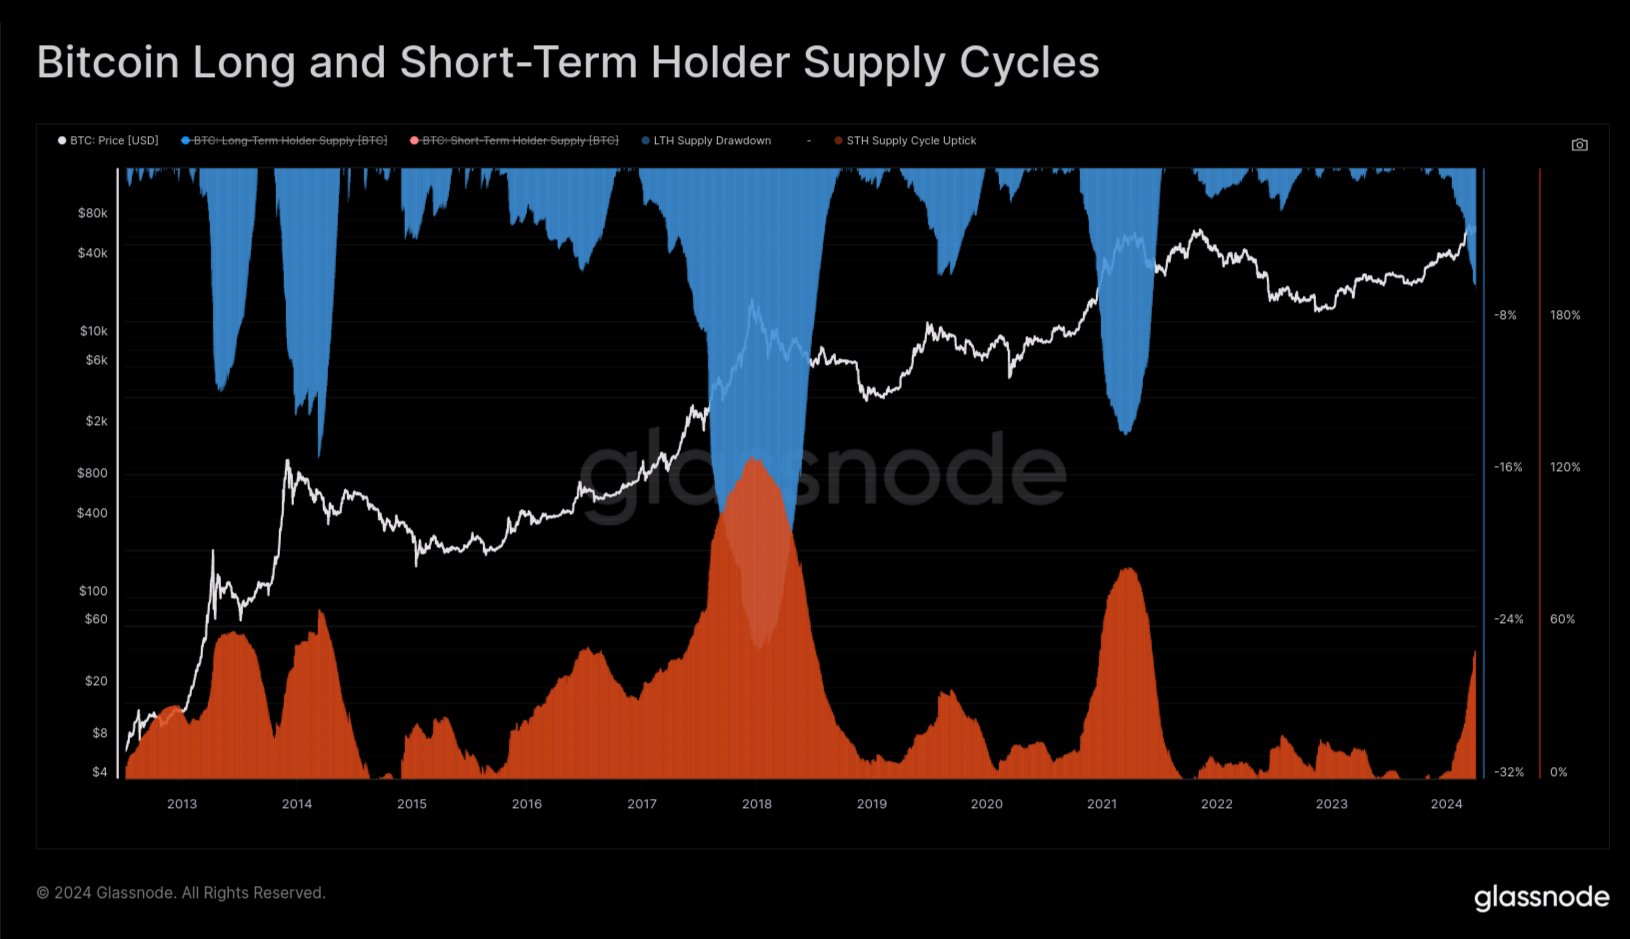
Checkmate notes that, based on this historical average drawdown in the LTH supply, the current Bitcoin cycle would be around 40% completion for this process.

BTC Price

Bitcoin has surged during the past 24 hours as its price has now returned to $71,800.

Bitcoin Price Chart

HODLing Rewards: Average Bitcoin Long-Term Holder Now Carries 55% Profit

On-chain data shows the Bitcoin long-term holders (the so-called HODLers) are now carrying an unrealized profit of 55% on average.

Bitcoin Long-Term Holder NUPL Has Hit A Value Of 0.55

According to the latest weekly report from Glassnode, the profit that the BTC long-term holders are holding has gone up recently. The indicator of interest here is the “Net Unrealized Profit/Loss” (NUPL), which keeps track of the difference between the unrealized profit and loss that Bitcoin investors are carrying currently.

By “unrealized,” what’s meant here is that the profit or loss is yet to be harvested, as the investor carrying it hasn’t transferred their BTC on the blockchain yet. Once the holder would eventually move the coins, the profit/loss they were holding would then become “realized.”

In the context of the current discussion, the NUPL of only a specific segment of the market is of relevance: the long-term holders (LTHs). The LTHs are the Bitcoin holders who have been keeping their coins dormant on the network since at least 155 days ago.

These are the diamond hands of the market who are known to hold through periods of uptrends and downtrends alike, only selling when major market events take place.

“This includes periods when the market sets new ATHs, around cycle tops and bottoms, and during large shifts in market structure (e.g. Mt Gox, Halvings, and now the launch of spot ETFs),” explains the analytics firm.

Now, here is a chart that shows the trend in the Bitcoin LTH NUPL over the history of the asset:

Bitcoin LTH NUPL

As displayed in the above graph, the Bitcoin LTH NUPL has registered a rise in the last couple of months as the cryptocurrency’s spot price has gone through a notable surge.

“This metric reached 0.55 this week, which is meaningfully positive, and puts the average long-term investor at a 55% unrealized profit,” notes the report. Interestingly, BTC has registered some resistance around this level during the past.

As Glassnode has highlighted in the chart, the bulls encountered trouble here during August 2012, June 2016, July 2019, and August 2020. In all of these cases, the resulting top was only a local one, except for July 2019, where the recovery rally of the cycle hit a top that BTC wouldn’t surpass for a significant period of time.

Generally, investors in profit are more likely to sell their coins. The higher the gains that they hold, the stronger can be the allure of profit-taking. Thus, it’s not surprising to see that the LTHs holding significant profits has lead to selling pressure in the market during previous cycles.

The LTHs have indeed participated in some selling recently as well, as the data for their supply suggests.

Bitcoin Long-Term Holder Supply

The Bitcoin LTH supply has now come down 75,000 BTC since the all-time high registered in November, while the opposite cohort, the short-term holders (STHs), have naturally gained some share.

“Whilst 75k BTC is a meaningful sum, it should also be viewed within the context of total LTH supply accounting for a whopping 76.3% of the circulating coin supply,” says the report.

BTC Price

Bitcoin has continued its recent sideways trend during the past day as its price currently floats around the $42,600 level.

Bitcoin Price Chart

When Will Bitcoin Bull Run Begin? This Could Be The Metric To Watch

A pattern in the supply of the Bitcoin long-term holders could provide some hints about when the next bull run might begin in earnest.

Bitcoin HODLer Balance Has Followed A Specific Pattern In Previous Cycles

According to the market intelligence platform IntoTheBlock, the supply of the BTC HODLers is “an excellent indicator for measuring market cycles.” The “HODLers” or long-term holders (LTHs) refer to the Bitcoin investors who have held onto their coins since at least a year ago without having sold or transferred them on the blockchain.

The LTHs are the resolute hands in the market, which rarely sell their coins even when a profitable opportunity has presented itself or a deep price crash has occurred.

One way to track the behavior of these diamond hands is through the combined amount of balance they carry in their wallets. The chart below shows this Bitcoin metric trend over the past few years.

Bitcoin Long-Term Holder Supply

As displayed in the above graph, the Bitcoin supply held by the HODLers has been showing some growth over the past couple of years, suggesting that the LTHs have been accumulating.

This rise in the indicator has also continued through the latest rally, implying that the LTHs aren’t yet ready to start taking their profits. Something to note is that when the metric goes up, it doesn’t mean buying is happening in the present.

The indicator naturally has a 1-year lag associated with it, as coins must mature for that long before they can be included in the cohort. However, this only applies to buying as the holders moving their coins to sell instantly reset the age back to zero and, hence, remove them from the group.

In the chart, the analytics firm has highlighted a pattern that the Bitcoin LTH supply has observed during the leadup to past bull runs. It would appear that the HODLers have shown accumulation in such periods.

On the other hand, the start of selling from this cohort coincided with the beginning of the bull rally in proper. So far, the HODLers have only been accumulating recently, implying that the market may be in the pre-bull run phase.

If the historical pattern indeed holds for the current cycle as well, then the HODLer supply could be one to watch, as a significant downtrend in it could turn out to be a signal that the bull run has begun once more.

BTC Price

Bitcoin had plunged towards the $41,700 mark yesterday, but the asset has already seen some sharp recovery as its price is now trading around the $43,000 level.

Bitcoin Price Chart

Bitcoin Accumulation: HODLers Are Buying 15,000 BTC Per Month

On-chain data shows the Bitcoin HODLers are currently displaying net accumulation behavior, as they grow their holdings by 15,000 BTC per month.

Bitcoin Long-Term Holders Have Been Accumulating Recently

According to data from the on-chain analytics firm Glassnode, these investors were previously aggressively distributing during the bear market lows. The HODLers, or more formally, the “long-term holders” (LTHs), make up a Bitcoin cohort that includes all investors that have been holding onto their coins since at least 155 days ago.

The LTHs make up one of the two main holder groups in the market; the other cohort is called the “short-term holder” (STH) group and naturally includes only investors that bought their BTC less than 155 days ago.

Statistically speaking, the longer a holder owns a coin, the less likely they become to sell it at any point. This means that the LTHs are the more resolute bunch of the two groups, which is why they are called the “HODLers” or the diamond hands of the market.

As these investors are an important part of the sector, their movements can be worth tracking. An indicator called the “HODLer net position change” measures the monthly rate at which these investors are buying or selling a net amount of Bitcoin right now.

The chart below shows the trend in this metric over the last few years:

Bitcoin HODLer Net Position Change

When the HODLer net position change has a positive value, it means these investors are receiving inflows into their holdings currently. On the other hand, negative values suggest a net number of coins are exiting the supply of the LTHs.

As displayed in the graph, the Bitcoin HODLer net position change had a deep red value during the bear market lows that followed the November 2022 FTX crash. This means that the LTHs had been selling during this period.

This sharp negative spike has been an exception to the long-term trend, however, as the HODLers have actually been showing an overall strong accumulation behavior over the past couple of years. The last time these investors participated in consistent distribution was during the bull rally in the first half of 2021.

From the chart, it’s visible that after the aforementioned brief period of distribution at the bear market lows, the LTHs switched back to accumulation just before the current rally began.

These diamond hands have continued to add to their holdings throughout the rally so far, showing that they haven’t been allured by the profit-taking opportunity. This can be a bullish sign for the long-term sustainability of the rally.

Though, very recently, the monthly amount that they have been adding to their holdings has been trending down. Nonetheless, the indicator’s value still remains positive, as the Bitcoin LTHs are accumulating at a rate of 15,000 BTC per month currently.

BTC Price

At the time of writing, Bitcoin is trading around $29,100, up 1% in the last week.

Bitcoin Price Chart

Number Of Bitcoin Addresses Sending BTC To Exchanges Continues To Drop

With the decline in the price of bitcoin, there has been a lot of selling from investors. This sell-off trend has contributed to the further decline of the digital asset’s prices in recent times. However, as the bear run continues, there has been a marked reduction in the amount of BTC being sold off by the holders. The decline in the number of addresses that are sending their coins to centralized exchanges speaks volumes about this.

Sellers Beginning To Cool Off

Over the last year, the number of bitcoin addresses that had been sending BTC to centralized exchanges, presumably to sell their holdings, had grown incredibly. But had started to decline in recent weeks as the sell-offs had begun to subside.

According to Glassnode, the number of addresses that were sending bitcoin to exchanges had fallen to a new 22-month low on Thursday. The number had sat around 4,445.369. But on Friday, another consecutive decline was recorded. This time around, the number of addresses that were sending BTC to exchanges was 4,443.202.

Bitcoin falls to mid-$18,000s | Source: BTCUSD on TradingView.com

It is a far cry from the more than 6,000 wallets that were sending BTC to centralized exchanges in the middle of 2022. While the increase in wallets sending BTC to exchanges had correlated with the price decline back in Q2 2022, the opposite is now the case, with the decline coinciding with the drop in the price of bitcoin.

What This Means For Bitcoin

Naturally, data like this points to the fact that there is a growing accumulation trend among investors but not every metric point to this. An example is the HODLer net position change that was recorded by Glassnode on Friday.

Instead of being on the rise as would be expected in an accumulation trend, the HODLer net position change continues to decline. It has now reached a new one-month low of 51,997.708. This shows that even if there might be a sell-off fatigue, it is still enough to put pressure on the price of the digital asset.

The amount of active bitcoin supply is always on the rise. It has now touched a new one-month high of 718,437.728 BTC. It is up slightly from the previous September 11th high of 717,097.427 BTC, still giving credence to the fact that sell-offs continue. 

Bitcoin’s price is also succumbing under the sell pressure. The digital asset is currently trading under $19,000 and doesn’t show any indicators of a significant recovery. 

Featured image from CNBC, charts from TradingView.com

Follow Best Owie on Twitter for market insights, updates, and the occasional funny tweet…