Bitcoin Sets New All-Time High Above $69,000 As Institutionals Show FOMO

Bitcoin has set a new all-time high (ATH) above the $69,000 level as institutional investors have aggressively bought on Coinbase.

Bitcoin Has Set A New ATH Above $69,000

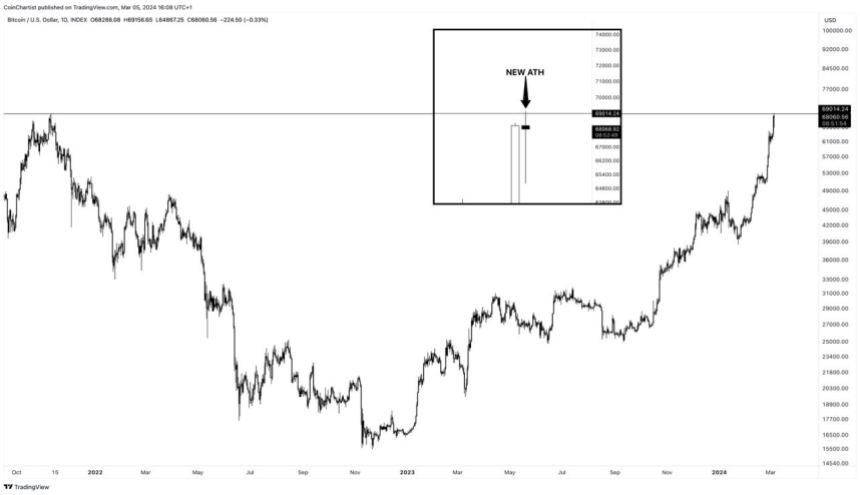
The moment that every Bitcoin investor had been looking forward to has finally arrived today. The cryptocurrency just smashed past the record set in November 2021 to create a brand new ATH beyond the $69,000 level.

Bitcoin All-Time High

This historical moment has come for the asset as institutional investors have been showing some strong buying pressure recently.

Bitcoin Coinbase Premium Index Spikes To Highest Levels For 2024

As an analyst in a CryptoQuant Quicktake post explained, US institutional investors appear to be scrambling to buy Bitcoin as they are starting to feel FOMO with the sharp bullish momentum the cryptocurrency has enjoyed.

The metric of interest here is the “Coinbase Premium Index,” which keeps track of the percentage difference between the Bitcoin prices listed on cryptocurrency exchanges Coinbase (USD pair) and Binance (USDT pair).

The former exchange is the preferred platform for institutional traders based in the US, while the latter serves more global traffic. As such, the Coinbase Premium Index can provide hints about the differences in the buying and selling behaviors of the two groups.

When the indicator has a positive value, the price listed on Coinbase is higher than on Binance. Such a trend implies that the buying pressure is higher (or selling pressure is lower) from the US-based investors compared to Binance users.

On the other hand, the negative metric suggests that American institutional traders may be applying relatively high selling pressure on the market.

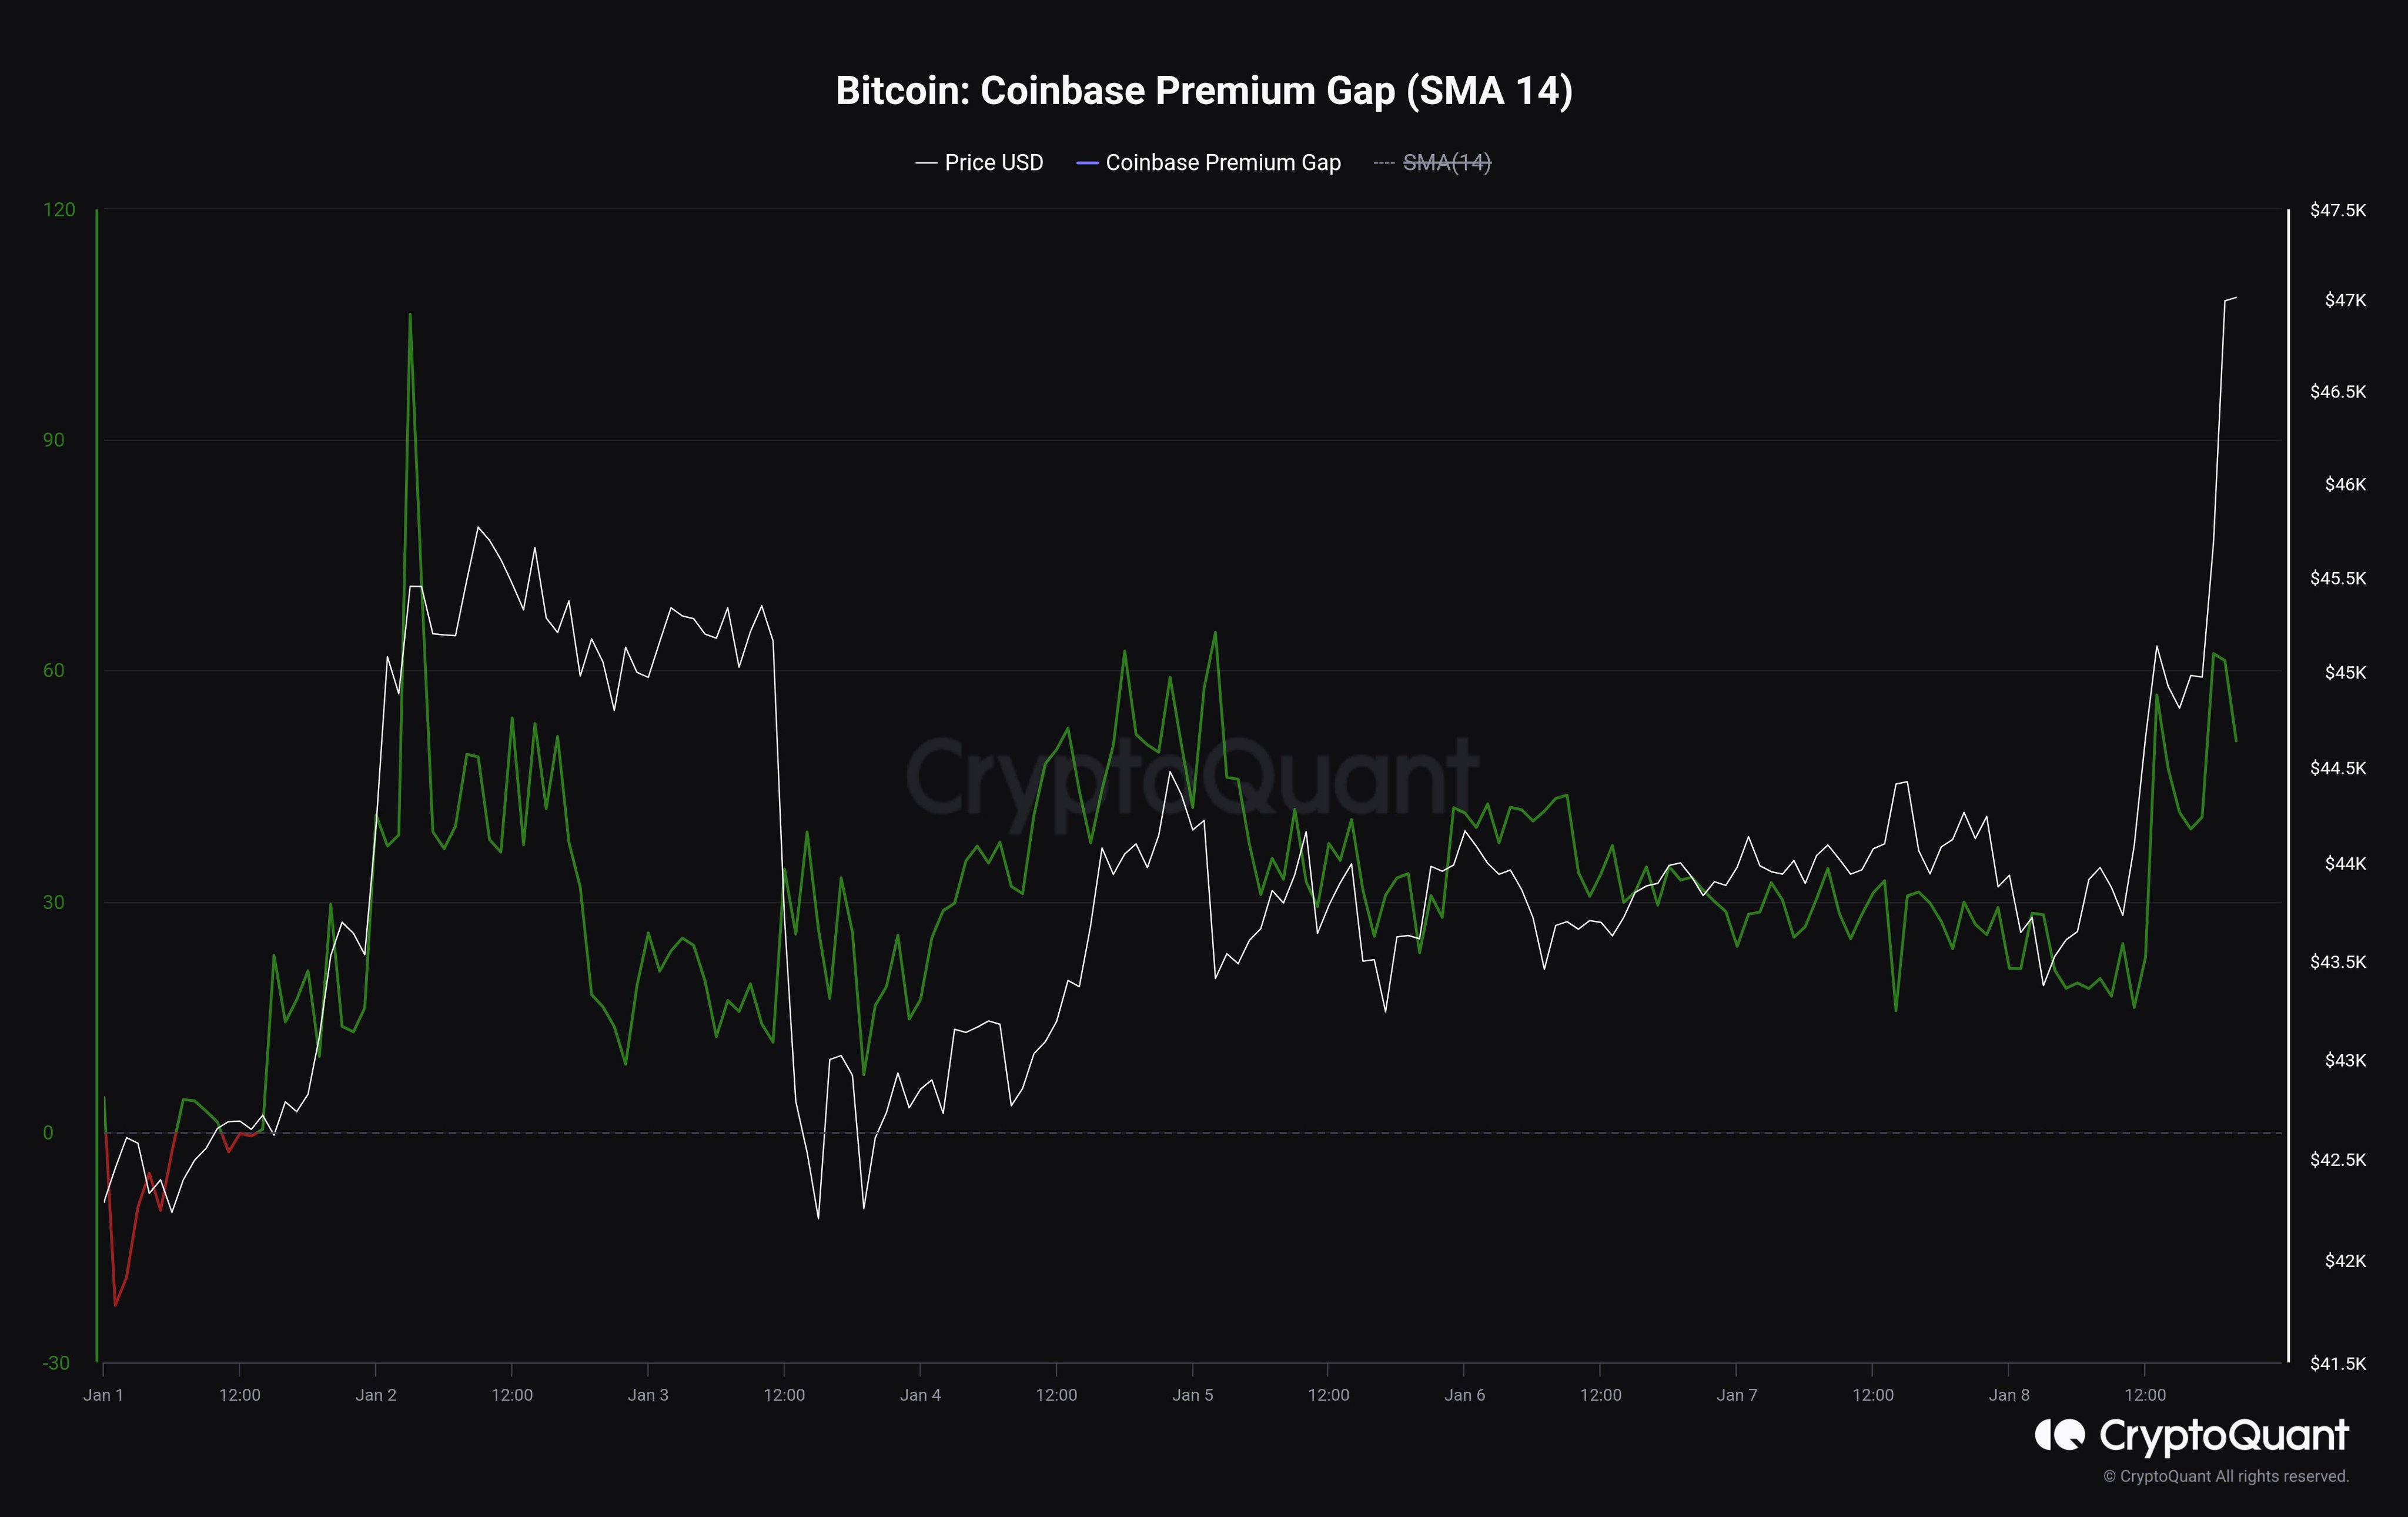
Now, here is a chart that shows the trend in the Bitcoin Coinbase Premium Index over the past few months:

Bitcoin Coinbase Premium Index

As displayed in the graph, the Bitcoin Coinbase Premium Index has registered a large positive spike recently, implying the difference between the prices on Coinbase and Binance has widened.

The indicator had been floating inside the green territory for a while before this spike, and in this period of high buying pressure on Coinbase, the coin observed a sharp rally.

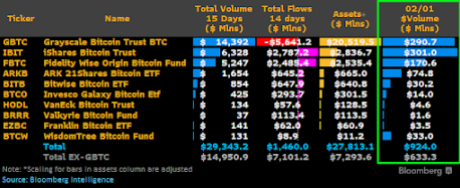
This recent buying pressure would probably include sources like the spot exchange-traded funds (ETFs) approved this year. From the chart, it’s visible that the buying pressure has been even higher in the last couple of weeks, culminating in the latest spike.

Interest around the asset among these institutional entities had only been growing recently, but the latest spike suggests FOMO has gone up a level for these investors.

Given that institutional buying has been one of the main forces behind the latest rally in the cryptocurrency, it’s no wonder that its price has hit a fresh high off the back of the latest spike.

Here Are The Largest Institutional Buyers Of Bitcoin This Week

The Spot Bitcoin ETFs have lived up to the hype, as these funds have ramped up institutional adoption of the flagship cryptocurrency, Bitcoin. This is further evident in a recent analysis that captured how much Bitcoin BlackRock and other issuers amassed in this week alone. 

Spot Bitcoin ETF Issuers Purchased Over 19,908 BTC This Week

Data from the on-chain analytics platform Lookonchain shows that the Spot Bitcoin ETF issuers combined to purchase over 19,908 BTC ($860 million) this week. Meanwhile, it is worth mentioning that Lookonchain’s data didn’t capture WisdomTree’s BTC purchases in its analysis, suggesting that the figure could be way higher when the asset manager’s purchases are also factored in. 

Further data obtained from Arkham Intelligence provided insights into how much Bitcoin Wisdom Tree obtained for its Bitcoin fund this week. 74 BTC is shown to have gone into the asset manager’s wallet address for its Spot Bitcoin ETF. The addition of these crypto tokens means that all Spot Bitcoin ETF issuers combined to purchase almost 20,000 BTC this week alone. 

Interestingly, Bitcoin ETFs were recently reported to hold 3.3% of Bitcoin’s circulating supply, underscoring their success since launching. Data from Lookonchain shows that these ETFs currently hold over 657,000 BTC (excluding WisdomTree). 

Matt Hougan, Bitwise’s Chief Investment Officer (CIO), also revealed how these funds have seen flows of $1.7 billion after their first 14 trading days. This is more impressive as he made a comparison to Gold ETFs, which saw $1.3 billion in a similar time frame. In another X post, he mentioned how these Spot Bitcoin ETFs have taken $700 million in net inflows this week alone.

Bitcoin price chart from Tradingview.com (Institutional investors)

BlackRock Finally Trumps Grayscale

Bloomberg analyst James Seyffart mentioned in an X post that BlackRock’s IBIT looks to have become the first ETF to trade more than Grayscale’s GBTC in a single day. Before now, Grayscale had continued to record the most daily trading volume, although IBIT had come close on a couple of occasions. 

From the data that Seyffart shared, IBIT looks to have recorded $301 million in trading volume on February 1, while GBTC saw $290 in trading volume. However, he further stated that the total trading on the day “was kind of a dud,” with all Spot Bitcoin ETFs combined recording $924 million in trading volume.

Institutional Bitcoin buyers

Interestingly, that happened to be the first day that the daily volume for Spot Bitcoin ETFs was under $1 billion. The Bloomberg analyst didn’t, however, give any opinion as to what could have caused this relatively sub-par performance. 

Bitcoin Blasts Off As Institutionals Continue Buying On Coinbase

Bitcoin has observed a sharp rally beyond the $47,000 level as data shows buying pressure on Coinbase has displayed no signs of letting off.

Bitcoin Has Surged More Than 4% In Last 24 Hours As ETF Deadline Nears

After the asset’s indecisiveness over the last few days, the cryptocurrency has appeared to have picked its direction in the last 24 hours, as its price has increased sharply.

At the peak of this surge, the coin had crossed beyond the $47,300 mark, but since then, the coin has registered some pullback as it’s now down to $46,500. The below chart shows how Bitcoin has performed during the last few days.

Bitcoin Price Chart

With this surge, the coin is up over 4% in the last 24 hours. The only cryptocurrencies in the top 20 market cap list that have attained better returns during this period are Solana (SOL) and Bitcoin Cash (BCH).

This latest rally to levels not visited since March 2022 has come for the cryptocurrency as the US SEC deadline for a decision on BTC spot ETFs is approaching fast.

With the expectation in the market widely being that the ETFs would get approved, it’s not surprising that buyers may be jumping in, expecting the asset to rally further after the ETFs start trading.

Data of an indicator could also point towards large entities being involved in accumulation in this leadup to the day of decision.

BTC Coinbase Premium Gap Has Been Positive For More Than A Week Now

As CryptoQuant Netherlands community manager Maartunn pointed out in a post on X, the Bitcoin Coinbase Premium Gap has been positive for several consecutive days.

The “Coinbase Premium Gap” refers to a metric that keeps track of the difference between the Bitcoin prices listed on cryptocurrency exchanges Coinbase (USD pair) and Binance (USDT pair).

This indicator’s value tells us about the difference in the buying (or selling) behaviors on the two largest platforms in the sector. Below is a chart showing the recent trend in this metric’s 14-day simple moving average (SMA).

Image

As displayed in the above graph, the Bitcoin Coinbase Premium Gap has been positive for almost 2024, with only one dip in the metric coming on the first day of the year.

This suggests that the buying pressure on Coinbase has been greater than on Binance for over a week now. US-based institutional investors widely use the former, while the latter hosts more global traffic.

Thus, this indicates that large institutional traders have possibly been going shopping recently. Another indicator that suggests accumulation from the whales is the “large holders netflow” metric from IntoTheBlock, which has displayed positive spikes recently.

Bitcoin Large Holders Netflow

“Large holders bought the dip! Bitcoin holders holding >1% of the supply accumulated more than 14k BTC over the past week as prices dipped below $43k,” explains IntoTheBlock.

Institutional Investors Increase Bitcoin Appetite Ahead Of Spot ETF, Report Shows

A report by K33 research analysts has provided insight into how much institutional investors’ appetite for Bitcoin has increased ahead of a potential approval of a Spot BTC ETF. The research firm emphasized a particular indicator to drive home their point and provided further insight into what the future holds if these ETFs get approved.

The Derivatives Market: An Indicator Of Institutional Interest  In Bitcoin

In the report written by K33’s Senior Analyst Vetle Lunde and Head of Research Anders Helseth, they noted that the derivatives market was important as it can be used to gauge institutional traders’ interest in Bitcoin. In line with this, they touched on how there has been a significant increase in open interest in the Chicago Mercantile Exchange (CME) derivatives market.

The K33 report specifically noted that the CME’s open interest has grown by over 3,4000 BTC over the past week. Meanwhile, CME’s open interest remains near all-time highs of 110,000 BTC. The increased activity on the CME has resulted from these traders’ desire to gain exposure to Bitcoin ahead of the “imminent ETF verdict.”

With a potential approval on the horizon, it is believed that many traders are looking to make as much profit as they can from this bullish event. Meanwhile, others have genuinely become bullish on the flagship cryptocurrency and want to gain exposure to it in any way they can. The CME is arguably the most accessible means to gain exposure to Bitcoin for this class of investors. 

Notably, the K33 analysts highlighted how the open interest in the CME exchange had picked up the pace back in October. Coincidentally or not, this happened to be when Bitcoin and the broader crypto market picked up steam, as many believed that the Spot Bitcoin ETF rumors were the reason for the rally. 

Bitcoin price chart from Tradingview.com

CME To Lose Market Share Once ETFs Get Approved

NewsBTC had in November reported how CME had overtaken Binance in Bitcoin futures. Data from Coinglass also shows that the CME is still well ahead in terms of Bitcoin futures open interest. However, that could change soon enough as the K33 report touched on the possibility of open interest in CME collapsing once these Spot Bitcoin ETFs get approved. 

An approval can cause selling pressure on CME as these institutional investors might look to take profit while others will be looking to transfer their capital to the Spot ETFs. K33 elaborated on the latter. The report noted that futures-based ETFs currently account for 46% of the CME’s open interest

Considering that futures and Spot ETFs will be in direct competition, they expect the latter to become the more favorable option. As such, these K33 analysts foresee a decline in the open interest, which these futures ETFs account for. They project that many institutional investors will look to rotate a substantial portion of their capital to the Spot ETFs.

At the time of writing, Bitcoin is trading at around $42,800, down in the last 24 hours, according to data from CoinMarketCap. 

CryptoQuant Discusses How Bitcoin Has Changed In Past 1 Year

The on-chain analytics firm CryptoQuant has discussed how the Bitcoin market has changed during the past year.

Bitcoin Has Been Going Through Some Changes Recently

In a new post on X, CryptoQuant has broken down the changes that the cryptocurrency’s landscape has observed recently. The first would be that the US-based exchanges have been registering withdrawals, while the global platforms have seen growing holdings.

The relevant on-chain indicator here is the “exchange reserve,” which keeps track of the total amount of Bitcoin stored inside the wallets of a centralized exchange or a group of exchanges.

First, here is a chart that shows the trend in this metric for the foreign platforms:

Bitcoin Exchange Reserve

The above graph shows that the Bitcoin exchange reserves for Binance, Bitfinex, and OKX have increased during the past year. In total, the indicator’s value for these non-US platforms has increased by 10% in this period.

This increase would naturally suggest that these exchanges have seen net deposits in the last year. However, the exchange reserve for the US-based platforms paints a different picture.

Bitcoin US exchanges

While the foreign exchanges have seen deposits, the platforms based in the US, such as Coinbase, Gemini, and Kraken, have observed declining reserves during the past year.

In general, the reserves of these platforms have dropped by at least 30%, which is a very significant value. The opposite trends being followed by the two groups of exchanges could imply a migration of coins between them, with investors increasingly preferring the non-US platforms.

The second change in the BTC market is that institutional investors have started displaying an accumulation behavior. “Considering the amount withdrawn and the deposit and withdrawal records of the wallets, institutions are continuously buying Bitcoin,” explains the analytics firm.

CryptoQuant notes that in August alone, Gemini has seen a huge withdrawal of more than 20,000 BTC, which can be a sign that institutional investors are buying.

Bitcoin Gemini

Finally, there is a change in how market participants have been looking at the futures sector recently, as they have increased their exposure to derivative products.

The ratio of the trading volume of the asset between spot and derivative platforms has dropped to pretty low values recently, a sign that activity on the derivative exchanges is overwhelmingly more than on the spot ones.

Bitcoin Trading Volume Ratio

The open interest, a measure of the number of positions open on the derivative market, also showcases this change, as the metric’s value hit very high just recently.

Image

The chart shows that while the open interest was at highs just a while ago, it has since observed a plummet. The reason behind this plunge was the latest Bitcoin crash, which resulted in a cascade of liquidations in the market.

BTC Price

Bitcoin is trading around the $25,900 level, unchanged from one week ago, showing how stagnant the cryptocurrency has been recently.

Bitcoin Price Chart

Rise In Bitcoin Outflows Suggests Institutional Investors May Be Losing Faith In The Asset

This year has been marked by significant volatility across the crypto market, including for Bitcoin, which has seen both gains and losses over the course of the year. Just a month ago in the middle of July, Bitcoin crossed over $30,000 and many investors saw this as the start of another bull run. 

However, things seem to have taken a turn, as the price of Bitcoin has plateaued since then. The asset is currently struggling to find a push in price, and it would seem this sentiment has flowed into digital asset funds. According to the weekly report published by digital asset manager CoinShares, Bitcoin outflows from institutional accounts have resumed in the past week.

Outflows From Digital Asset Investment Products

Outflows from digital asset investment products have spiked in recent weeks to register a three-week run of outflows. This would indicate that institutional investors might be avoiding volatile cryptos. This comes two weeks after a brief period of inflows, where Ripple’s partial victory in court and recent US inflation data led to inflows in digital asset products. 

However, data shows that outflows resumed last week, and it appears that the euphoria that followed Ripple’s partial triumph against the SEC has dissipated. Digital asset investment products saw $55 million in outflows last week, with Bitcoin leading the charge with outflows of $42 million.

Other cryptocurrencies like Ethereum registered $9 million outflows, while Polygon, Litecoin, and Polkadot saw outflows of $0.9 million, $0.6 million, and $0.5 million, respectively. On the other hand, XRP and Cardano saw an increase in their respective inflows of $1.2 million and $0.1 million. 

In terms of region, Canada had the most outflows of $35.9. million, and Germany followed with $11 million.

Bitcoin price chart from Tradingview.com (Institutional investors)

Rise In Bitcoin Outflows

Bitcoin outflows from exchanges suggest big investors may be losing faith in the popular cryptocurrency. One factor that fueled this outflow is speculations going around that the SEC might not actually approve applications for spot Bitcoin ETFs in the US. As a result, total assets under management (AuM) declined by 10% to close the week at $32.3 billion. 

The speculations come as the SEC has delayed making a decision on Spot Bitcoin ETF applications multiple times. Each postponement casts more doubt on whether they will ever approve one and an outright rejection from the SEC will most likely lead to the price of Bitcoin falling to $20,000 and digital asset investment products registering more outflows.

At the time of writing, Bitcoin is trading at $26,053 and is down by 11.09% in a 7-day timeframe.