Will Bitcoin Volatility Continue? These Metrics Say Yes

Bitcoin has observed some sharp price action today, and if data of these metrics is to go by, the asset may not be done being volatile just yet.

Bitcoin’s Open Interest And Leverage Ratio Have Remained High

As explained by an analyst in a CryptoQuant post, some metrics are forming a pattern that can lead to more volatility in the cryptocurrency’s price. These indicators are the open interest and the estimated leverage ratio.

The “open interest” refers to the total amount of Bitcoin futures contracts that are open on all derivative exchanges. An increase in this metric suggests that the investors are opening more positions on the futures market right now, while a decrease implies some of them are closing their positions, or are getting liquidated.

The other metric of interest here, the “estimated leverage ratio,” keeps track of the ratio between the open interest and the derivative exchange reserve (that is, the total amount of Bitcoin sitting in the wallets of these derivative platforms).

What this metric tells us is the amount of leverage that futures users are opting for on average. High leverage can significantly increase the risk of a large number of contracts being liquidated, so whenever this metric has a high value, the market can become more probable to show high volatility due to violent liquidation events.

Now, here is a chart that shows the trend in these two Bitcoin indicators over the past few days:

Bitcoin Open Interest & Leverage Ratio

As displayed in the above graph, the Bitcoin open interest and estimated leverage ratio had both been at relatively high values right before the plunge that the asset saw in the past 24 hours.

In this sharp price plummet, the futures market naturally observed a high amount of liquidations, leading to the open interest registering some decrease. The metric, however, didn’t actually see that much of a cool down despite these liquidations, and it has now already reached back to the same levels it was at before the volatility.

This would suggest that the futures market users have opened new positions since the mass liquidation event. While the open interest had gone down in this event, albeit briefly, the leverage ratio actually hadn’t budged even that much.

Rather, the indicator has only been going up, implying that the users opening up the new futures contracts are only opting for higher and higher amounts of leverage.

Because of the open interest rebounding and the leverage ratio only trending higher, it would appear like a reasonable possibility that the Bitcoin price would observe more volatility in the near future.

Such volatility can take the coin in either direction, but generally, the side of the market with the less amount of contracts is the more probable one.

In the chart, the data for the “funding rates” is attached, which basically tells us whether the longs or the shorts are dominant in the futures market currently.

The funding rates had been positive in the latest futures market overheat, as well as in the one seen earlier in the month, but following today’s long liquidations, the metric has turned negative. This may suggest that a liquidation event involving the shorts is more likely to happen next.

BTC Price

At the time of writing, Bitcoin is trading around $28,500, down 3% in the last week.
Bitcoin Price Chart

Bitcoin Futures Market Remains Heated As Leverage Stays High

On-chain data shows the Bitcoin futures market has remained heated recently as leverage taken on by investors has been quite high.

Bitcoin Estimated Leverage Ratio Declines A Bit, But Still Remains Very High

Following the rise in derivative activities, the leverage in the market hit a new all-tine high recently, as noted by an analyst in a CryptoQuant post.

The “all exchanges estimated leverage ratio” is an indicator that’s defined as the ratio between the open interest and the derivative exchange reserve.

When the value of this metric is high, it means the average investor is currently using a large amount of leverage on exchanges. Such a trend suggests holders are willing to take high risk currently.

On the other hand, low values of the indicator imply holders are going for a low-risk approach at the moment as they aren’t using much leverage.

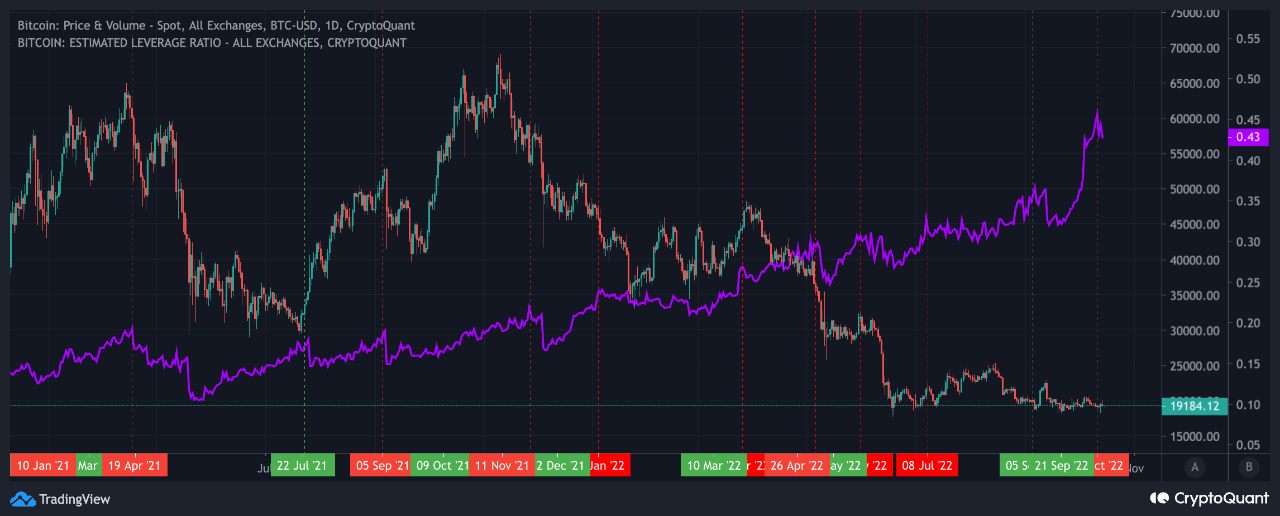
Now, here is a chart that shows the trend in the Bitcoin all exchanges estimated leverage ratio over the last couple of years:

The value of the metric seems to have rapidly risen during the last few weeks | Source: CryptoQuant

As you can see in the above graph, the Bitcoin estimated leverage ratio had been rising in recent weeks and hit a new all-time just a while ago.

However, since then the indicator’s value has come down a bit. This decrease was instigated by the recent temporary rush of volatility in the market due to the CPI release, which flushed out a large amount of leverage.

Nonetheless, the indicator’s value has remained pretty high despite the decline, meaning there is still plenty of leverage to go around in the market.

Historically, overleveraged markets have usually ended in very sharp price moves as liquidations tend to occur quite easily in such environments.

Such liquidations amplify the price move that caused them, leading to even more liquidations. This event where liquidations cascade together is called a squeeze.

Since leverage is so high in the Bitcoin futures market right now, a squeeze could likely take place and break BTC’s price out of the range.

As for which direction the squeeze might go in, the quant comments: “With retail traders overly bullish compared to institutional traders, the risk-reward does not look good for the bulls.”

BTC Price

At the time of writing, Bitcoin’s price floats around $19.1k, down 2% in the last seven days.

Looks like the value of the crypto has once again gone stagnant after the CPI volatility | Source: BTCUSD on TradingView
Featured image from Kanchanara on Unsplash.com, charts from TradingView.com, CryptoQuant.com

Bitcoin Whale Ratio Surges Up As Leverage Remains High

On-chain data shows the Bitcoin whale ratio has surged up recently, as leverage in the market has remained around an all-time high value.

Both Bitcoin Whale And Leverage Ratios Are Around ATHs Right Now

As pointed out by an analyst in a CryptoQuant post, BTC investors are involved in some high-risk trading in the futures market currently.

The “exchange whale ratio” is an indicator that measures the ratio between the sum of the top ten inflows to exchanges, and the total exchange inflows.

Since the ten largest transfers to exchanges are assumed to be from the whales, this metric tells us about whether whales are active on the market right now or not.

When the value of the ratio is high, it means whales are making a big contribution to the exchange inflows at the moment.

Now, here is a chart that shows the trend in the Bitcoin whale ratio over the last few years:

Looks like the value of the metric has been elevated in recent days | Source: CryptoQuant

As you can see in the above graph, the quant from the post has marked the relevant periods of trend for the Bitcoin exchange whale ratio.

It seems like usually whenever the indicator has hit a high and then subsequently started declining, the price has also taken a large hit.

From the chart, it’s apparent that the metric has risen up during recent months, and is now floating around all-time high values.

The data for the “estimated leverage ratio” is also displayed. This indicator tells us the amount of leverage being used by the average trader on the futures market.

The Bitcoin leverage ratio has very sharply surged up recently and is also at a new ATH now, suggesting that investors are taking a lot of risk at the moment.

High leverage in the market has historically resulted in a more volatile BTC price. Under these conditions, if the whale ratio also starts turning down and the same trend as in the past follows now as well, then things could get bearish very fast for the crypto.

BTC Price

At the time of writing, Bitcoin’s price floats around $19.5k, up 2% in the last seven days. Over the past month, the crypto has gained 1% in value.

The below chart shows the trend in the price of the coin over the last five days.

The value of the crypto seems to have been trending sideways since the plunge a few days back | Source: BTCUSD on TradingView
Featured image from Peg Lemkuil on Unsplash.com, charts from TradingView.com, CryptoQuant.com

Bitcoin Bearish Signal: Leverage Ratio Is Still Very High

On-chain data shows the Bitcoin leverage ratio still has a very high value, a sign that has usually proven to be bearish for the crypto in recent months.

Bitcoin Exchange Leverage Ratio Has Been Going Up In Recent Weeks

As pointed out by an analyst in a CryptoQuant post, the BTC all exchanges leverage ratio is still quite high, suggesting that the crypto could still see further downtrend.

The “leverage ratio” is an indicator that is defined as the ratio between the open interest and the all derivatives exchange reserve.

Here, the “open interest” is a measure of the total amount of Bitcoin futures positions currently open in the derivatives market.

And the “derivatives exchange reserve” is just the total number of coins currently stored in wallets of all derivatives exchanges.

What the leverage ratio tells us is how much leverage users are taking on average in the BTC futures market right now.

When the value of this indicator is high, it means users are taking a large amount of risk in the form of leverage at the moment. An excess of leverage usually leads to higher volatility in the market.

Related Reading | Bitcoin On-Chain Data: Miners Deposit Big To Derivatives Exchanges

On the other hand, lower values of the ratio can result in lesser relative volatility in the crypto’s price since users aren’t taking much risk.

Now, here is a chart that shows the trend in the Bitcoin all exchanges leverage ratio over the last year:

The value of the metric seems to have been quite high in recent days | Source: CryptoQuant

As you can see in the above graph, whenever the Bitcoin leverage ratio has hit a steep value during the last several months, both the indicator and the coin’s price has subsequently plunged down.

Mass leverage flushes like these are called “liquidation squeezes.” During such events, liquidations cascade together and amplify the price move that triggered the squeeze.

Related Reading | Why Bitcoin Is Undervalued According To This Expert’s “Conservative” Model

Since the price moved in the same direction as the squeeze in these instances, they were all examples of a “long squeeze.”

It looks like the ratio’s value is once again high right now. If a similar trend as in the last few months follows this time as well, then a long squeeze may be coming  soon and taking Bitcoin in for another plummet.

BTC Price

At the time of writing, Bitcoin’s price floats around $20.5k, up 4% in the last week. Over the past month, the crypto has lost 30% in value.

Looks like the value of the crypto has been going down over the last few days | Source: BTCUSD on TradingView
Featured image from mana5280 on Unsplash.com, charts from TradingView.com, CryptoQuant.com

Data Shows Bitcoin Investors Afraid To Take Risk As Leverage Remains Low

On-chain data shows Bitcoin investors have been afraid to take risk recently as the leverage ratio has remained low in the last few days.

Bitcoin Leverage Ratio Remains Low In Past Few Days

As pointed out by an analyst in a CryptoQuant post, investors haven’t taken much risk since the surge in the crypto’s price a few days back as leverage in the market is low at the moment.

A relevant indicator here is the “open interest,” which shows the total amount of Bitcoin futures contracts currently open on all derivatives exchanges.

The “estimated leverage ratio” is a metric that’s defined as the ratio between this open interest and the total amount of coins present on all derivatives exchanges (exchange reserve).

What this ratio tells us is the average amount of leverage that each Bitcoin futures investor is currently making use of.

When the value of the indicator is high, it means users are taking on a lot of risk right now. Such values can result in higher price volatility.

Related Reading | Glassnode’s RHODL Ratio May Suggest Bitcoin Market Is Near Capitulation

On the other hand, low values of the ratio indicate investors aren’t using much leverage currently as they look to avoid risk.

Now, here is a chart that shows the trend in the Bitcoin leverage ratio over the past few days:

Looks like the value of the metric is low at the moment | Source: CryptoQuant

As you can see in the above graph, the Bitcoin leverage ratio had a high value a few days back, but the sharp uptrend in the crypto’s price brought it back down as it liquidated shorts.

Since then, the indicator’s value has remained at these low levels. The open interest, on the other hand, is still at a high value, implying investors have still been opening new positions in the market.

Related Reading | Time To Be Fearful? Bitcoin Index Reaches Greediest Point Since Peak

These new positions, however, have low average leverage attached to them as the ratio suggests. This shows that investors have been unsure about the crypto recently, opting to take less risk.

The chart also shows the curve for the funding rates, an indicator that tells us about the ratio of longs and shorts in the market. Currently, the metric seems to be positive, which means there are more long positions in the market.

BTC Price

At the time of writing, Bitcoin’s price floats around $47k, up 10% in the past week. The below chart shows the trend in the price of the coin over the last five days.

BTC’s price seems to have moved sideways in the last few days | Source: BTCUSD on TradingView
Featured image from Unsplash.com, charts from TradingView.com, CryptoQuant.com

Bitcoin Leverage Ratio Remains High Despite Recent Drop

On-chain data shows the Bitcoin leverage ratio has continued to stay at high values despite the recent decline in the crypto’s price.

Bitcoin Leverage Ratio Hasn’t Budged Much In Response To Price Plunge

As pointed out by an analyst in a CryptoQuant post, the BTC leverage ratio has remained at high values recently, despite the price declining to $41k.

The “estimated leverage ratio” is an indicator that’s calculated by dividing the open interest with the exchange reserve. In simpler terms, what this metric tells us about is how much leverage Bitcoin futures investors are using at the moment.

Here, “open interest” is the measure of the total amount of futures contracts open on derivatives exchanges. And the “exchange reserve” is the total amount of coins currently present in wallets of all derivative exchanges.

When the value of the Bitcoin leverage ratio goes up, it means investors have started to add more leverage to their positions.

On the other hand, a decline shows futures holders are closing up their positions. This may be due to mass liquidations or because of investors opting to take less risk right now.

A mass liquidation event (often called a long or short squeeze) occurs when the price of Bitcoin makes a sharp swing, leading to a cascade of liquidations in the market.

Now, here is a chart that shows the trend in the indicator over the past week:

Looks like the ratio has been at high values recently | Source: CryptoQuant

As you can see in the above graph, while the price of the coin has gone down, the leverage ratio has remained at high values.

Related Reading | Bitcoin Prices Dragged Down By Geopolitical Tensions, Ukraine Nuke Plant Fire

The open interest has also declined slightly, which means there are fewer positions open currently. This implies that the average leverage per position has actually gone up.

The quant in the post believes that this trend may show that Bitcoin investors are now getting bolder and taking more risks.

Since the funding rate is about neutral right now (another indicator that can help us estimate the ratio between longs and shorts), it implies there are about as many long positions as short positions.

Related Reading | Bitcoin Bearish Signal: Exchanges Observe Huge Inflow From Long-Term Holders

The price action in the near future may be of interest as a sharp move in either direction can cause a squeeze and push the value of Bitcoin further in that direction.

BTC Price

At the time of writing, Bitcoin’s price floats around $41.4k, up 5% in the last week.

BTC’s price seems to have plunged down over the past day | Source: BTCUSD on TradingView
Featured image from Unsplash.com, charts from TradingView.com, CryptoQuant.com

Bitcoin Leverage Ratio Sinks As Market De-Risks Amid Uncertainties

On-chain data shows the Bitcoin leverage ratio has gone down recently as market de-risks amid macro uncertainties.

Bitcoin Leverage Ratio Sharply Falls Down Over The Past Week

According to the latest weekly report from Glassnode, the BTC futures open interest leverage ratio has decreased in the last week as investors de-risk their holdings.

The “futures open interest leverage ratio” is an indicator that’s defined as the ratio between the market open contract value and the total market cap of Bitcoin.

In simpler terms, what this metric tells us is the degree of leverage that an average user is currently making use of in the BTC market.

When the value of the ratio increases, it means users are increasing their leverage as they take on more risk. High values of the indicator may imply that the Bitcoin market is overleveraged at the moment. And thus, it may be more prone to a liquidation squeeze event.

On the other hand, low values of the metric mean investors are keeping their positions at low risk right now. The market is generally more stable during these periods as probability of deleveraging events decreases.

Related Reading | JPMorgan Puts Bitcoin At $150,000 In The Long-Term, But What About Its ‘Fair Value’?

Now, here is a chart that shows the trend in the Bitcoin futures open interest leverage ratio over the past year:

Looks like the value of the indicator has declined recently | Source: The Glassnode Week Onchain – Week 7, 2022

As you can see in the above graph, the Bitcoin leverage ratio seems to have sharply fallen off over the last seven days.

However, unlike many other deleveraging events over the course of 2021, this recent decrease wasn’t marked by a liquidation squeeze.

Related Reading | Bitcoin Active Addresses Surpass 1.02M Three Days In A Row, What Happened Last Time

The main push behind this trend looks to have been investors opting to de-risk their holdings by closing out their futures positions.

The report notes that futures users may be showing this behavior in response to the many macro uncertainties currently looming over the Bitcoin market.

As the current values of the indicator are very close to a range that has usually meant a more stable market, the price of the crypto may not show much volatility in the coming days.

BTC Price

At the time of writing, Bitcoin’s price floats around $44.2k, up 2% in the last seven days. Over the past month, the crypto has gained 3% in value.

The below chart shows the trend in the price of BTC over the last five days.

BTC’s price seems to have shown some sharp upwards momentum over the last twenty-four hours | Source: BTCUSD on TradingView
Featured image from Unsplash.com, charts from TradingView.com, Glassnode.com

Bitcoin Leverage Ratio Suggests More Decline May Be Coming

A quant explains why the current high Bitcoin leverage ratio values may mean that more price drop could be coming soon.

Current Bitcoin Leverage Ratio Is At High Values

As explained by an analyst in a CryptoQuant post, the current BTC leverage ratio has high values, and if past pattern is anything to go by, a correction may be coming to the price soon.

The “estimated leverage ratio” is an indictor that’s defined as the value of the Bitcoin open interest divided by the reserve of all exchanges.

In simpler terms, what this metric tells us is the amount of leverage that an average user is making use of at the moment.

When the value of this indicator rises, it means investors are taking on more risk as they are increasing the leverage on their positions.

During such a trend, the volatility in the price of BTC may also go up. At sufficiently high values of the ratio, the market may be considered overleveraged, and a liquidation squeeze could follow to wipe out the excess leverage.

Related Reading | Market Re-Enters Extreme Fear Territory As Bitcoin Declines To $36k

In a liquidation squeeze, a big swing in the price causes a cascade of futures liquidations that amplify the price move further.

Now, here is a chart that shows the trend in the Bitcoin leverage ratio over the past year:

Looks like the value of the indicator has been high recently | Source: CryptoQuant

In the above graph, the quant has highlighted the different regions where the Bitcoin leverage ratio sharply dropped. Along with that, the direction of the price following these liquidation squeezes is also marked.

Yellow indicates a long squeeze. During such an event, the price of the crypto declines along with the indicator. Similarly, green marks a short squeeze where the price moves oppositely to the ratio.

Related Reading | Bitcoin On-Chain Demands Suggests That The Market Has Reached Its Bottom

In the period of the chart, most of the liquidation incidents have involved longs. As you can see in the above graph, the ratio has now once again risen to quite high values.

The quant thus believes that we may see another similar yellow region soon as the probability of it has been higher during such bearish market conditions as now.

However, the pattern of another indicator, the Bitcoin volatility index, rather suggests that a short squeeze may be coming next. In such an outcome, the price of the coin will be bullish.

BTC Price

At the time of writing, Bitcoin’s price floats around $37.9k, up 4% in the last seven days. The below chart shows the trend in the price of the crypto over the past five days.

BTC’s price has once again surged to around $38k | Source: BTCUSD on TradingView
Featured image from Unsplash.com, charts from TradingView.com, CryptoQuant.com

Bitcoin Leverage Ratio Hits New ATH, Is More Price Decline Coming?

On-chain data shows Bitcoin leverage ratio has hit a new all-time high (ATH). This may mean that a price correction could soon follow.

Bitcoin Leverage Ratio Reaches New Highs, Correction Incoming?

As pointed out by an analyst in a CryptoQuant post, the BTC leverage ratio has made a new ATH recently. This increases the possibility of a correction happening soon to flush out all the excess leverage.

The “all exchanges estimated leverage ratio” is an indicator that estimates how much leverage is used by Bitcoin investors on derivatives exchanges, on average.

There are two related metrics here. The first is the “open interest,” which measures the total amount of futures contracts currently open in the market. And the other is the “exchange reserve” that tells us how much BTC is stored in derivatives exchange wallets.

The value of the leverage ratio is calculated as the open interest divided by the exchange reserve. With the help of this metric, it becomes possible to tell whether investors are currently taking low risk or high risk.

When the value of the indicator rises, it means investors are taking on more leverage. High values of the metric may mean the market is currently over-leveraged, which could lead to higher volatility in Bitcoin.

Related Reading | Quant Explains How Large Bitcoin Leverage Ratio Can Help Turnaround Price

On the other hand, low values of the indicator imply there isn’t much leverage in the market right now. Here is a chart that shows the trend in the BTC leverage ratio over the past few months:

Looks like the indicator has recently hit a new ATH | Source: CryptoQuant

As you can see in the above graph, the Bitcoin leverage ratio has been on the rise lately. Just recently the metric also achieved a new all-time high.

Related Reading | Growth Of Bitcoin ETFs & Other Instruments Doesn’t Support Supply Shock Narrative

The quant believes that such high values of the ratio may mean that a correction in the price of the coin could soon come, wiping away all the excess leverage with it.

BTC Price

At the time of writing, Bitcoin’s price floats around $50.9k, up 11% in the last seven days. Over the past thirty days, the crypto has stacked 6% in losses.

The below chart shows the trend in the price of BTC over the last five days.

BTC’s price surged up a few days ago, but has since moved sideways | Source: BTCUSD on TradingView

Bitcoin has established a footing above the $50k price level in the past few days, but it’s unclear at the moment when the coin might retest higher levels. If the leverage ratio is anything to go by, another correction might soon wipe away this recovery instead.

Featured image from Unsplash.com, charts from TradingView.com, CryptoQuant.com

Quant Explains How Large Bitcoin Leverage Ratio Can Help Turnaround Price

A quant has explained how the current large Bitcoin leverage ratio values can help bring a turnabout to the crypto’s price.

Bitcoin Leverage Ratio Rises To Values Greater Than During The ATH

As explained by an analyst in a CryptoQuant post, the massive leverage ratio right now might help BTC’s price reverse its trend.

The “Bitcoin leverage ratio” is an on-chain indicator that is defined as the open interest divided by the (derivative) exchange reserve.

Here, the “open interest” is a measure of the amount of futures contracts currently open in the derivatives market. While the exchange reserve tells us how much BTC is stored in exchange wallets right now.

The leverage ratio basically shows the amount of leverage used by users on average. The metric’s value helps us know whether Bitcoin investors are taking a high risk or a low risk.

When the value of this ratio moves up, it means investors are picking up more leverage as they are confident in their positions.

On the other hand, a decreasing trend of the indicator would mean investors are reducing risk, and closing off their positions.

Related Reading | Growth Of Bitcoin ETFs & Other Instruments Doesn’t Support Supply Shock Narrative

Now, here is a chart that shows the trend in the Bitcoin leverage ratio over the last few months:

The indicator seems to be rising in value | Source: CryptoQuant

As you can see in the above graph, the Bitcoin leverage ratio has been riding on an uptrend for a while, and now has values greater than those during the last price ATH.

The quant has marked peaks of the indicator on the chart and compared them with the BTC price. Apparently, whenever the metric has reached a top, the price of the crypto has reversed its trend.

Related Reading | Market Gets Cozy With Bitcoin Trapped? Why BTC Is Gearing Up For A Short Squeeze

The chart also shows another indicator, the RSI, which highlights whether BTC is currently overpriced or underpriced.

It seems like whichever way this metric has turned, the price has also reversed in the same direction. Looking at the chart, currently the leverage ratio seems to be hitting a peak and the RSI looks to be turning up. If there is indeed a pattern here, then the price of Bitcoin might change its direction towards the sky next.

BTC Price

At the time of writing, Bitcoin’s price floats around $48.7k, down 2% in the last seven days. The below chart shows the trend in the value of the crypto over the past five days.

BTC’s price surged up a few days ago, but it has since started moving sideways again | Source: BTCUSD on TradingView
Featured image from Unsplash.com, charts from TradingView.com, CryptoQuant.com