Bitcoin Futures Market Remains Heated As Leverage Stays High

On-chain data shows the Bitcoin futures market has remained heated recently as leverage taken on by investors has been quite high.

Bitcoin Estimated Leverage Ratio Declines A Bit, But Still Remains Very High

Following the rise in derivative activities, the leverage in the market hit a new all-tine high recently, as noted by an analyst in a CryptoQuant post.

The “all exchanges estimated leverage ratio” is an indicator that’s defined as the ratio between the open interest and the derivative exchange reserve.

When the value of this metric is high, it means the average investor is currently using a large amount of leverage on exchanges. Such a trend suggests holders are willing to take high risk currently.

On the other hand, low values of the indicator imply holders are going for a low-risk approach at the moment as they aren’t using much leverage.

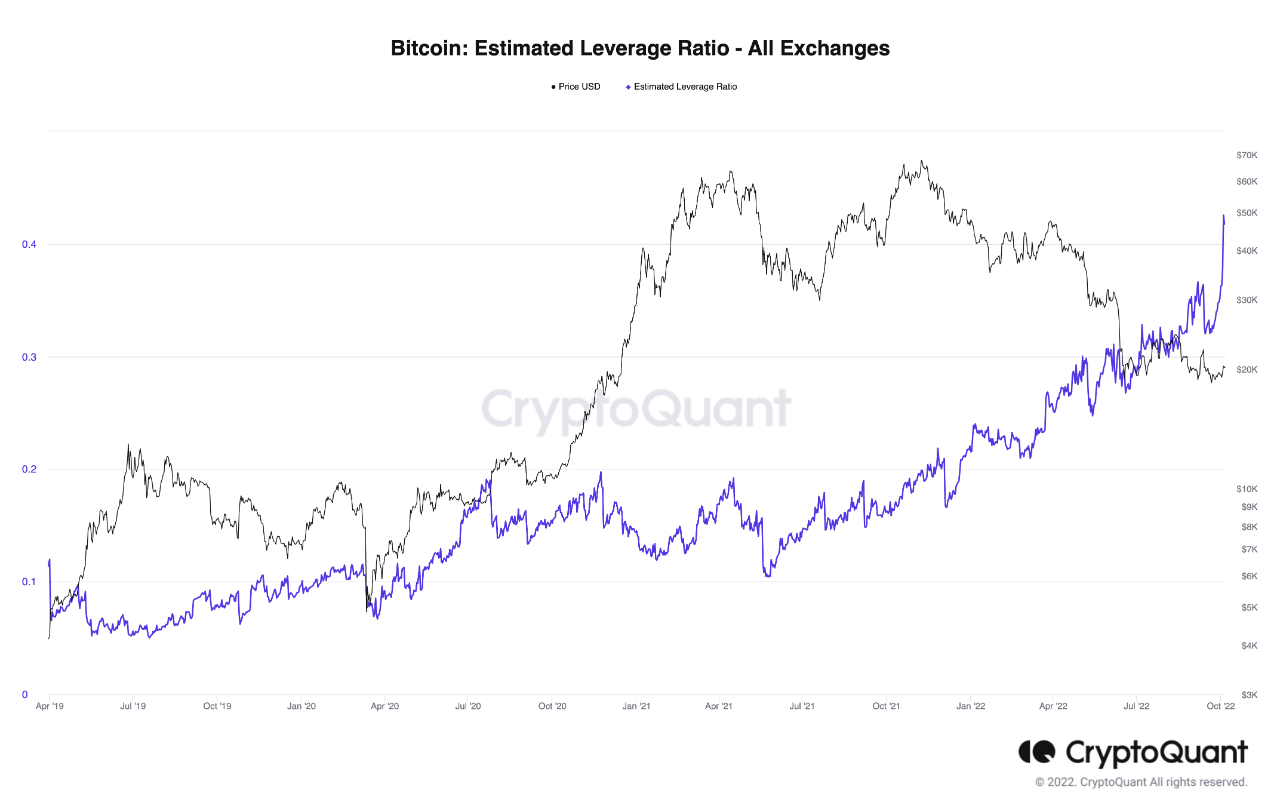
Now, here is a chart that shows the trend in the Bitcoin all exchanges estimated leverage ratio over the last couple of years:

The value of the metric seems to have rapidly risen during the last few weeks | Source: CryptoQuant

As you can see in the above graph, the Bitcoin estimated leverage ratio had been rising in recent weeks and hit a new all-time just a while ago.

However, since then the indicator’s value has come down a bit. This decrease was instigated by the recent temporary rush of volatility in the market due to the CPI release, which flushed out a large amount of leverage.

Nonetheless, the indicator’s value has remained pretty high despite the decline, meaning there is still plenty of leverage to go around in the market.

Historically, overleveraged markets have usually ended in very sharp price moves as liquidations tend to occur quite easily in such environments.

Such liquidations amplify the price move that caused them, leading to even more liquidations. This event where liquidations cascade together is called a squeeze.

Since leverage is so high in the Bitcoin futures market right now, a squeeze could likely take place and break BTC’s price out of the range.

As for which direction the squeeze might go in, the quant comments: “With retail traders overly bullish compared to institutional traders, the risk-reward does not look good for the bulls.”

BTC Price

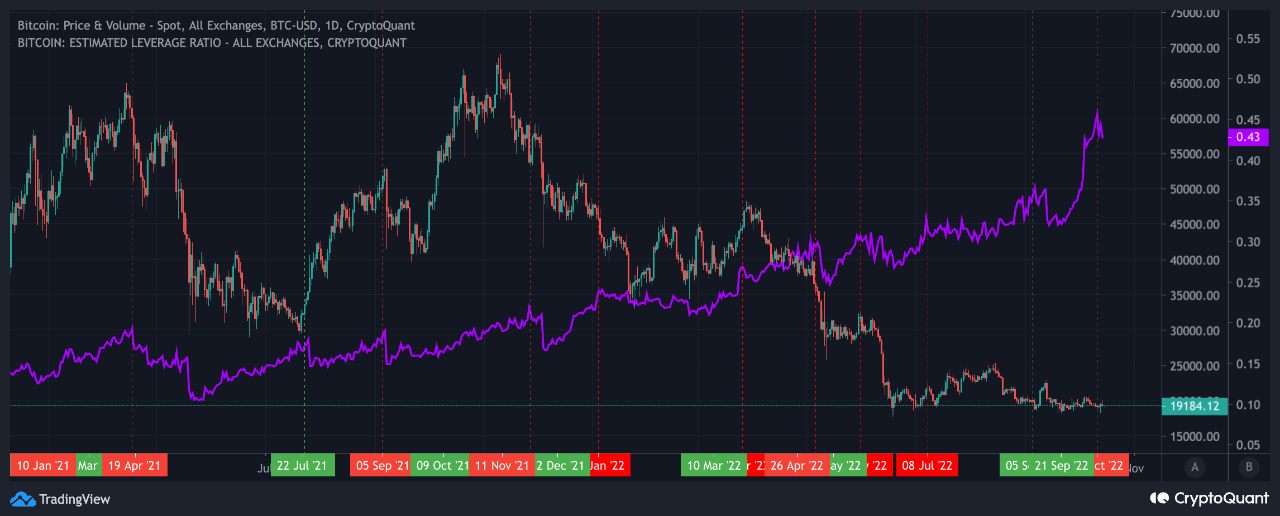
At the time of writing, Bitcoin’s price floats around $19.1k, down 2% in the last seven days.

Looks like the value of the crypto has once again gone stagnant after the CPI volatility | Source: BTCUSD on TradingView
Featured image from Kanchanara on Unsplash.com, charts from TradingView.com, CryptoQuant.com

Bitcoin Whale Ratio Surges Up As Leverage Remains High

On-chain data shows the Bitcoin whale ratio has surged up recently, as leverage in the market has remained around an all-time high value.

Both Bitcoin Whale And Leverage Ratios Are Around ATHs Right Now

As pointed out by an analyst in a CryptoQuant post, BTC investors are involved in some high-risk trading in the futures market currently.

The “exchange whale ratio” is an indicator that measures the ratio between the sum of the top ten inflows to exchanges, and the total exchange inflows.

Since the ten largest transfers to exchanges are assumed to be from the whales, this metric tells us about whether whales are active on the market right now or not.

When the value of the ratio is high, it means whales are making a big contribution to the exchange inflows at the moment.

Now, here is a chart that shows the trend in the Bitcoin whale ratio over the last few years:

Looks like the value of the metric has been elevated in recent days | Source: CryptoQuant

As you can see in the above graph, the quant from the post has marked the relevant periods of trend for the Bitcoin exchange whale ratio.

It seems like usually whenever the indicator has hit a high and then subsequently started declining, the price has also taken a large hit.

From the chart, it’s apparent that the metric has risen up during recent months, and is now floating around all-time high values.

The data for the “estimated leverage ratio” is also displayed. This indicator tells us the amount of leverage being used by the average trader on the futures market.

The Bitcoin leverage ratio has very sharply surged up recently and is also at a new ATH now, suggesting that investors are taking a lot of risk at the moment.

High leverage in the market has historically resulted in a more volatile BTC price. Under these conditions, if the whale ratio also starts turning down and the same trend as in the past follows now as well, then things could get bearish very fast for the crypto.

BTC Price

At the time of writing, Bitcoin’s price floats around $19.5k, up 2% in the last seven days. Over the past month, the crypto has gained 1% in value.

The below chart shows the trend in the price of the coin over the last five days.

The value of the crypto seems to have been trending sideways since the plunge a few days back | Source: BTCUSD on TradingView
Featured image from Peg Lemkuil on Unsplash.com, charts from TradingView.com, CryptoQuant.com

Bitcoin Leverage Ratio Hits New ATH, Market In For A Rough Ride?

On-chain data shows the Bitcoin leverage ratio has surged up to a new all-time high, suggesting the market could be heading towards high volatility.

Bitcoin All Exchanges Estimated Leverage Ratio Sets New ATH

As pointed out by a CryptoQuant post, the funding rate has remained neutral while the leverage has increased in the market.

The “all exchanges estimated leverage ratio” is an indicator that measures the ratio between the Bitcoin open interest and the derivative exchange reserve.

What this metric tells us is the average amount of leverage currently being used by investors in the BTC futures market.

When the value of this indicator is high, it means users are taking a lot of leverage right now. Historically, such values have led to higher volatility in the price of the crypto.

On the other hand, the value of the metric being low suggests investors aren’t taking high risk at the moment, as they haven’t used much leverage.

Now, here is a chart that shows the trend in the Bitcoin leverage ratio over the last few years:

Looks like the value of the metric has been rising up during the last few months | Source: CryptoQuant

As you can see in the above graph, the Bitcoin estimated leverage ratio has shot up recently and has attained a new ATH. This means that investors are taking a high amount of leverage on average.

The reason overleveraged markets have usually turned highly volatile in the past lies in the fact that such conditions lead to mass liquidations becoming more probable.

Any sudden swings in the price during periods of high leverage can lead to a lot of contracts getting liquidated at once. But it doesn’t end there; these liquidations further amplify the price move that created them, and hence cause even more liquidations.

Liquidations cascading together in such a way is called a “squeeze.” Such events can involve either longs or shorts.

The Bitcoin funding rates (the periodic fee exchanged between long and short traders) can give us an idea about which direction a possible squeeze may go in.

CryptoQuant notes that this metric has a neutral value currently, implying the market is equally divided between shorts and longs. As such, it’s hard to say anything about the direction a possible squeeze in the near future might lean towards.

The Bitcoin volatility has in fact been very low in recent weeks, but with such high accumulation of leverage, it may be a matter of time before a volatile price takes over.

BTC Price

At the time of writing, Bitcoin’s price floats around $19.6k, up 2% in the past week.

The BTC value continues to trend sideways | Source: BTCUSD on TradingView
Featured image from Kanchanara on Unsplash.com, charts from TradingView.com, CryptoQuant.com

Calm Before The Storm? Bitcoin Volatility At Historically Low Levels

Data shows the Bitcoin 7-day volatility has plunged down recently to pretty low values. Here’s what has historically happened following instances of such a trend.

Bitcoin 7-Day Volatility Has Declined To Just 1.6% In The Past Week

According to the latest weekly report from Arcane Research, the recent sideways trend in the BTC price has lead to the volatility dropping down to very low values.

The “volatility” is an indicator that measures how the daily returns of Bitcoin have deviated from the average during a specific period.

Here is a chart that shows the trend in the 7-day and 30-day versions of the metric for BTC over the last year:

The 7-day value of the indicator seems to have gone down in recent days | Source: Arcane Research’s The Weekly Update – Week 39, 2022

As you can see in the above graph, the 7-day Bitcoin volatility has plummeted down over the past week or so.

The metric’s value is now only 1.6%, a very low level that has only been seen a few times during the last twelve months. The 30-day volatility, though, has still stayed up recently at about 3.4%.

The reason behind such low weekly values of the indicator is the sideways consolidation between the $19k and $20k levels that the crypto’s price has been stuck in lately.

Such low 7-day volatility values have usually been succeeded by significant surges in the metric, as noted by the report.

This happens because leverage easily builds up during these periods. High leverage markets are highly volatile since any sudden price moves can liquidate large amounts, which further amplifies the price change.

Since low volatility periods obviously don’t have any significant price spikes, leverage can go unflushed and thus pile up.

As the Bitcoin 7-day volatility has been very low recently, this kind of buildup is again expected to take place in the market. And indeed, the BTC-denominated perpetual futures open interest has shot up and is sitting at an all-time high right now, supporting the idea of the market being overleveraged:

Looks like the value of the metric has been climbing up recently | Source: Arcane Research’s The Weekly Update – Week 39, 2022
BTC Price

At the time of writing, Bitcoin’s price floats around $20.1k, up 3% in the last week. Over the past month, the crypto has gained 1% in value.

The below chart shows the trend in the price of the coin over the last five days.

The value of the crypto has been moving sideways since the surge a couple of days back | Source: BTCUSD on TradingView
Featured image from Kanchanara on Unsplash.com, charts from TradingView.com, Arcane Research

Bullish AF: Bitcoin At $42K, Comparing Today’s Leverage With That Of February

Bitcoin reached $42K before, but not with these characteristics. The market seems healthy and practically unleveraged. Greed is just showing its face after months of Fear. How did we get here? Calmly and consistently stacking sats, that’s how. What does this mean for the future of BTC’s price? Is the rocket about to take off?

Related Reading | Volatility Inbound: Bitcoin Traders are Upping Their Leverage as Election Nears

Before going into that, let’s look at the chart from Bitcoin Magazine’s Dylan LeClair. It gives the US Central Bank balance sheet a run for its money as the most bullish Bitcoin chart.

Leverage the first time we hit 42k $BTC in February compared to now.

This is all spot driven. pic.twitter.com/QjtJ0zWSgj

— 🟠Dylan LeClair🟠 (@BTCization) August 6, 2021

The difference is astonishing. In February, Bitcoin got here by borrowing money from exchanges. The futures market was on fire and growing. The bloodbath was a month away.  Nowadays, leverage is just raising its head after a few months in the red. The casino is almost empty. Real money drove the climb back from hell. Gradually, step by step.

Does this mean we’re up for a sudden blast into space?

BTC price chart for 08/07/2021 on Bitstamp | Source: BTC/USD on TradingView.com
If Not From Leverage, Where Is The Money Coming From?

Some institutions are probably buying. Chances are we’ll see Bitcoin holdings declared next quarter. However, according to on-chain analyst Will Clemente, there’s evidence that real, everyday people, are constantly joining the network. And those new Bitcoiners are joining an army of believers that never stop buying.

Bitcoin’s Gini coefficient is getting healthier and healthier. According to William Clemente, when you filter out ETFs and Grayscale, on-chain analytics show that “over time whales are just distributing their coins.” According to him, entities with less than 10 BTC never stop buying. “Since May 19th, retail has been accumulating more heavily than the whales have.” Each day that passes, Bitcoin’s “healthy distribution of the network” gets better and better.

The Dollar-Cost Averaging investment strategy is gaining traction among a sector of the population. And it seems to be spreading. Investopedia defines DCA as:

An investment strategy in which an investor divides up the total amount to be invested across periodic purchases of a target asset in an effort to reduce the impact of volatility on the overall purchase. The purchases occur regardless of the asset’s price and at regular intervals. In effect, this strategy removes much of the detailed work of attempting to time the market in order to make purchases of equities at the best prices. 

Related Reading | The One Line In Bitcoin Everyone In Crypto Is Watching

What Will Happen When Leverage Comes Back Into The Picture?

If greed is returning and leverage is available, people will use it. What will happen then? Go back to LeClair’s chart and check out October 2020, the last time that the leverage was in the red. Could we be entering a run the size of what followed that? The chart that this pseudonymous analyst presents suggest that.

#Bitcoin weekly candles are sized similar to the run from 11k to 19.5k.

19.5k is where we had serious resistance for few weeks (as now with 42k). Then it was off to the races and the price tripled.

Tripling from here is 120k. pic.twitter.com/1gBFbM00MX

— Kevin ₿ebee (@kevinbebee) August 6, 2021

We might be at the cusp of a historical moment. The indicators and characteristics seem healthy and ready for blast-off. The community’s morale is high despite the regulatory threats of late. If all of these analysts are right… we’ll see you on the moon, bulls!

Featured Image by Comfreak from Pixabay – Charts by TradingView