Bitcoin Dips Below $21k As Long-Term Holders Harvest Profits

Bitcoin has declined below $21k during the past day as on-chain data shows signs of long-term holders harvesting profits.

Bitcoin Long-Term Holder SOPR Has Spiked Up In Recent Days

As pointed out by an analyst in a CryptoQuant post, profit-taking from long-term holders has previously been followed by local tops in the price of the crypto.

The relevant indicator here is the “Spent Output Profit Ratio,” which tells us whether the average Bitcoin investor is selling at a profit or at a loss right now.

When the value of this metric is greater than 1, it means the holders as a whole are realizing some amount of profits right now.

On the other hand, SOPR values below the threshold suggest the overall market is selling at a loss at the moment.

Naturally, values of the indicator exactly equal to one imply BTC investors are just breaking even on their selling.

Now, there is a Bitcoin cohort called the “long-term holders” (LTHs), which include all investors who have been holding onto their coins since at least 155 days ago, without having moved or sold them.

Here is a chart that shows the trend in the SOPR specifically for this BTC holder group over the last couple of weeks:

Bitcoin Long-Term Holder SOPR

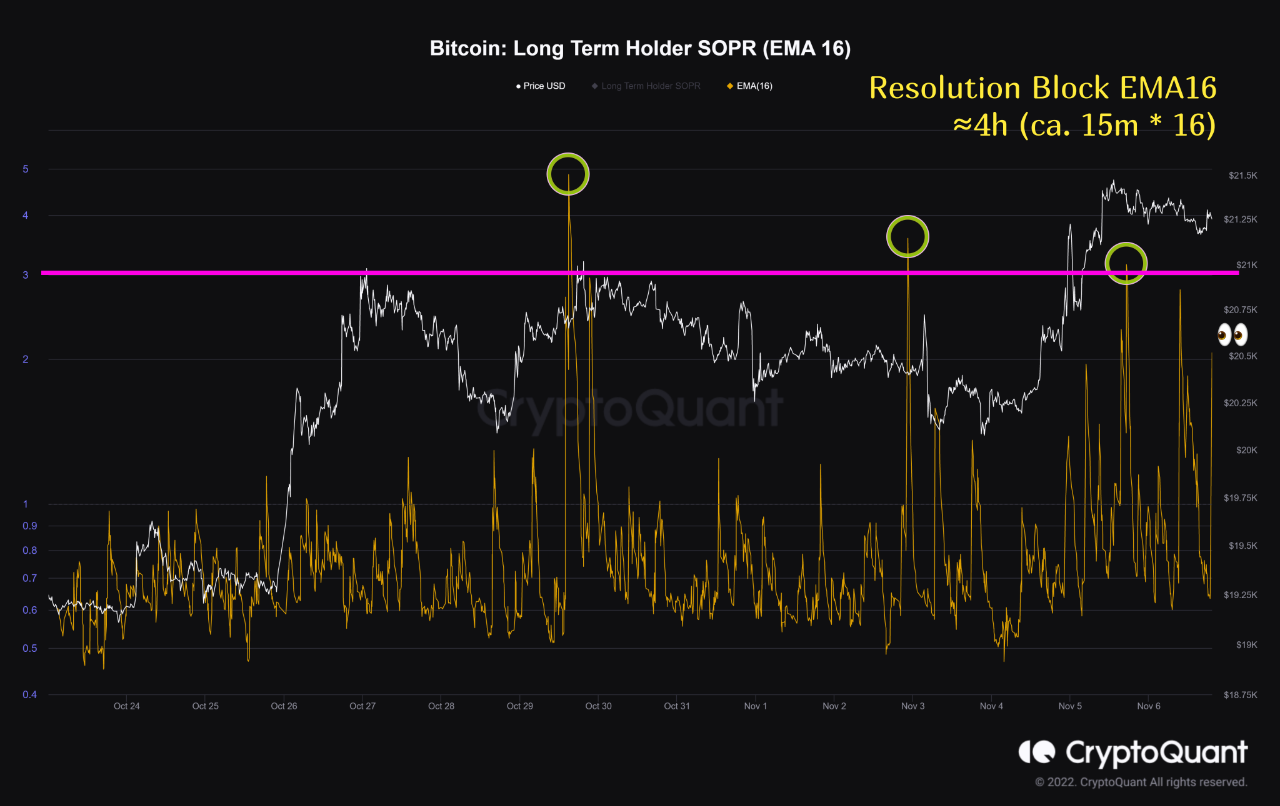
Looks like the EMA 16 value of the metric has been quite high recently | Source: CryptoQuant

As you can see in the above graph, the LTH SOPR has sharply spiked up above 1 over the last couple of days, suggesting that these holders have been taking some profits.

The chart also highlights previous instances of high values of the indicator during the last two weeks. It seems like whenever the indicator has spiked up to very high levels in this period, the price of the crypto has observed a local top either at the same time, or shortly after.

Since the LTH SOPR values have again risen recently, a local top formation could take place for BTC, if the same trend as before follows now as well.

And the decline may have already started, as Bitcoin has today slipped below the $21k level after maintaining above it during the weekend.

BTC Price

At the time of writing, Bitcoin’s price floats around $20.7k, up 1% in the last week. Over the past month, the crypto has gained 3% in value.

The below chart shows the trend in the price of the coin over the last five days.

Bitcoin Price Chart

The value of the crypto seems to have come down a bit over the last 24 hours | Source: BTCUSD on TradingView
Featured image from Andy Holmes on Unsplash.com, charts from TradingView.com, CryptoQuant.com

Bitcoin 30-Day Long-Term Holder SOPR Is Yet To Hit Bottom Values

On-chain data shows the Bitcoin 30-day long-term holder SOPR hasn’t yet reached the historical bottom level during the current cycle.

Bitcoin 30-Day Long-Term Holder SOPR Has Declined Recently

As pointed out by an analyst in a CryptoQuant post, the long-term holders haven’t attained their maximum pressure point yet.

The “Spent Output Profit Ratio” (or SOPR in short) is an indicator tells us whether the average Bitcoin investor is selling at a profit or at a loss right now.

When the value of this metric is less than 1, it means the overall market is realizing some amount of profit currently.

On the other hand, the indicator having values than the threshold suggests that investors as a whole are moving coins at a loss at the moment.

Long-term holders” (LTHs) are a cohort of Bitcoin investors who hold their coins for at least 155 days before selling or moving them.

Here is a chart that shows the trend in the 30-day moving average BTC SOPR over the last several years specifically for these LTHs:

The 30-day MA value of the metric seems to have been going down in recent days | Source: CryptoQuant

As you can see in the above graph, the 30-day MA Bitcoin LTH SOPR seems to have hit a specific level around the price bottom in each of the previous two cycles.

These touches of the level in the loss region didn’t exactly coincide with the cycle lows, but they were still quite close, making them good buying opportunities for the crypto.

In recent months, as the bear has taken over, the indicator’s value has declined below the 1 mark, implying the LTHs have been selling at a loss recently.

While the metric has declined deep into the red zone by this point, it’s still not at the level where the historical cycles observed their bottoms.

Though, as the chart shows in the bottom, the DPO (an indicator that’s popularly used for finding cycle tops and bottoms of any quantity) of the LTH SOPR has started turning back up recently.

In the past bear markets, the LTH SOPR reached the bottom level not too long after the DPO reversed trend like this. If a similar pattern follows now as well, it may not be too long until long-term holder loss selling reaches its maximum point.

BTC Price

At the time of writing, Bitcoin’s price floats around $19.2k, up 1% in the past week.

Looks like BTC has been moving sideways again during the last few days | Source: BTCUSD on TradingView
Featured image from Kanchanara on Unsplash.com, charts from TradingView.com, CryptoQuant.com

This On-Chain Indicator Suggests Bitcoin Still Only 1/3rd Into Bear Market

The Bitcoin long-term holder SOPR may suggest that the crypto has still only gone one-third of the way through the latest bear market.

Bitcoin 20-day SMA Long-Term Holder SOPR Has Only Been 86 Days Into Bottoming Zone

As pointed out by an analyst in a CryptoQuant post, the crypto is still only 1/3rd of the way into the 260 days average historical bottoming period.

The relevant indicator here is the “Spent Output Profit Ratio” (or SOPR in brief), which tells us about whether the average Bitcoin investor is selling at a profit or at a loss right now.

The metric works by looking at the history of each coin being sold on the chain to see what price it was last moved at. If this previous selling price was less than the latest BTC value, then the coin has just been sold at a profit. While if the last value was more than the current one, then that particular coin realized some loss.

When the value of the SOPR is greater than one, it means the market as a whole is selling at a profit right now.

On the other hand, the indicator being less than one implies the average holder is moving coins at a loss at the moment.

The “long-term holders” (LTHs) is the Bitcoin cohort that includes all investors who have held onto their coins for at least 155 days without selling or moving them.

Now, here is a chart that shows the trend in the BTC SOPR (20-day MA) specifically for these LTHs over the the last several years:

Looks like the value of the metric has been pretty low recently | Source: CryptoQuant

As you can see in the above graph, the Bitcoin LTH SOPR (20-day SMA) dipped below the “one” mark a while back.

Also, in the chart the quant has marked all the relevant zones of trend for the indicator in relation to the bear market.

It seems like historical bottoming periods have lasted whenever the metric has been stuck below the breakeven point.

On average, past bear markets have lasted around 260 days based on the LTH SOPR. In the current cycle, the coin has so far been 86 days into the bottoming zone.

This would suggest that if Bitcoin ends this bear market in about the same time as the average, then the crypto is still only one-third of the way through.

BTC Price

At the time of writing, Bitcoin’s price floats around $23k, down 2% in the last week. Over the past month, the coin has gained 13% in value.

The value of the crypto seems to have been moving sideways during the last few days | Source: BTCUSD on TradingView
Featured image from mana5280 on Unsplash.com, charts from TradingView.com, CryptoQuant.com

Why Pain May Not Be Over For Bitcoin Holders Just Yet

Past trend of the Bitcoin long-term holder SOPR (EMA 30) may suggest that BTC holders may face more pain in the coming months.

Bitcoin Long-Term Holder SOPR Has Dropped Below “One” Recently

As explained by an analyst in a CryptoQuant post, BTC investors may be in for a frustrating few months if history is anything to go by.

The “spent output profit ratio” (or SOPR in short) is an indicator that tells us whether Bitcoin investors are selling at a profit or at a loss right now.

The metric works by going through the transaction history of each coin being sold on the chain, to see what price it was last moved at.

If the previous selling price of any coin was less than the current value of BTC, then the coin has just been sold for a profit.

On the other hand, the past value being more than the latest price of the crypto would imply the coin has moved at a loss.

When the value of the SOPR is greater than one, it means the overall Bitcoin market is selling at a profit right now.

Related Reading | Bitcoin Coinbase Premium Gap Approaches Zero, Selloff Ending?

On the other hand, values of the indicator less than one imply investors as a whole are realizing some loss at the moment.

Now, the “long-term holder” (LTH) group includes any Bitcoin investor who has been holding their coins since at least 155 days ago without moving or selling.

The below chart shows the trend in the SOPR over the history of the crypto specifically for these LTHs.

Looks like the 30-day exponential-MA value of the indicator has gone down recently | Source: CryptoQuant

In the above graph, the quant has highlighted all the regions of relevant trend for the Bitcoin long-term holder SOPR.

It seems like during past bottoms, the indicator’s EMA-30 value has gone below one and trended sideways there for a while (except for the COVID-19 crash, where the metric didn’t stay in the zone for too long).

Related Reading | Bitcoin Whale Presence On Derivatives Still High, More Volatility Ahead?

Recently, the LTH SOPR’s value has once again gone below one, suggesting long-term holders are realizing losses right now.

The analyst notes that while such capitulation events have historically lead to bottom formations, it may still be a while, even months, before a low is actually found.

BTC Price

At the time of writing, Bitcoin’s price floats around $21.4k, up 11% in the past week. Here is a chart that shows the trend in the value of the coin over the last five days:

The price of the coin seems to have surged up over the last few days | Source: BTCUSD on TradingView
Featured image from Kanchanara on Unsplash.com, charts from TradingView.com, CryptoQuant.com

Bitcoin Long-Term Holders Realize March 2020-Like Losses As BTC Crashes

On-chain data shows the Bitcoin long-term holder SOPR has dropped to March 2020 levels as the price of the crypto crashes below $24k.

Bitcoin Long-Term Holder SOPR Plunges Deeper Below One

As pointed out by an analyst in a CryptoQuant post, BTC long-term holders are now realizing a similar level of loss as during March 2020.

The “spent output profit ratio” (or SOPR in brief) is an indicator that tells us whether Bitcoin investors are selling at a profit or at a loss right now.

The metric works by looking at the on-chain history of each coin being sold to see what price it was previously moved at.

If this last price was less than the current value of the crypto, then that particular coin has now been sold at a profit.

Related Reading | Bitcoin Slides As CPI Report Hints At Soaring Inflation – More Bearish Pressure Ahead?

On the other hand, the previous selling value being more than the latest price would imply the coin realized a loss.

When the value of SOPR is greater than one, it means the overall BTC market is selling at a profit at the moment. Values less than one, on the contrary, imply that investors as a whole are realizing losses right now.

“Long-term holders” (LTHs) are those Bitcoin investors who hold their coins for at least 155 days without selling them.

Here is a chart that shows the trend in the BTC SOPR specifically for these LTHs:

The value of the 20-day MA LTH SOPR looks to have plunged down recently | Source: CryptoQuant

As you can see in the above graph, the Bitcoin long-term holder SOPR dropped below one in value just a while ago, showing that LTHs have been selling at a loss recently.

The degree of LTH loss realization right now is the same as it was back in March 2020, following the crash due to COVID-19. The crypto also hit a bottom around then.

Related Reading | Head To Head: Bitcoin, Ethereum Profitability For Investors

The long-term holders now suffering from similar pain as back then may suggest that the market may soon see a bottom this time as well.

BTC Price

At the time of writing, Bitcoin’s price floats around $23.5k, down 24% in the last seven days. Over the past month, the crypto has lost 19% in value.

The below chart shows the trend in the price of the coin over the last five days.

Looks like the value of the crypto has crashed down over the last couple of days | Source: BTCUSD on TradingView

Today, Bitcoin plummeted below the $24k mark for the first time since December 2020, over 18 months ago. Currently, it’s unclear whether the crash has passed or if the coin will decline further still.

Featured image from Unsplash.com, charts from TradingView.com, CryptoQaunt.com

Bitcoin Selling Pressure Continues As Long-Term Holder SOPR Spikes Up

On-chain data shows the Bitcoin long-term holder SOPR has recently observed spikes, suggesting that this cohort is still continuing to sell.

Bitcoin Long-Term Holder SOPR Spiked Up When Price Crossed $30k

As pointed out by a CryptoQuant post, selling pressure in the market still looks to be high as long-term holders are also looking to sell.

The “spent output profit ratio” is an indicator that tells us whether the overall market is selling Bitcoin at a profit or loss right now.

The metric works by checking the on-chain history of each coin being sold to see what price it last moved at. It then divides the current price (that is, the selling price) with the last price.

When the value of this ratio is greater than one, it means investors are, on an average, selling at a profit at the moment.

On the other hand, values of the indicator less than one imply that the Bitcoin market as a whole is realizing loss currently.

A cohort of BTC investors is the “long-term holder” (LTH) group, who hold their coins for at least 155 days before selling.

Related Reading | Bitcoin Bearish Signal: Whales Ramp Up Dumping

The “LTH SOPR” tells us about profit or loss realization from specifically this group. Here is a chart that shows the trend in this indicator (EMA 144) over the past month:

It seems like the value of the metric has observed some spikes recently | Source: CryptoQuant

As you can see in the above graph, the Bitcoin long-term holder SOPR (EMA 144) had a couple of spikes in the last few days.

One took place on 13th May, while the other occurred on the 18th. During both these instances, the price had crossed $30k shortly before.

Related Reading | Funding Rates Fall To Yearly Lows Following Bitcoin’s Fall Below $29,000

This means that LTHs have been feeling pressure in the current market to realize their profits as soon as the price reaches above $30k.

Usually, Bitcoin long-term holders are the least likely cohort to sell. So, selling pressure from this group can prove to be bearish for the crypto’s price.

BTC Price

At the time of writing, Bitcoin’s price floats around $29.4k, up 3% in the last seven days. Over the past month, the crypto has lost 28% in value.

The below chart shows the trend in the price of the coin over the last five days.

Looks like the price of the crypto has seen some decline over the past two days | Source: BTCUSD on TradingView

Over the past week, Bitcoin has mostly consolidated around the $30k mark, failing to gain any ground above the mark. As long as selling at the level continues, the crypto won’t be able to make any real recovery.

Featured image from Unsplash.com, charts from TradingView.com, CryptoQuant.com