Bitcoin MPI Forms Death Cross, End of The Rally?

On-chain data shows the Bitcoin Miners’ Position Index (MPI) has formed a death cross recently, a sign that the asset’s rally may end.

Bitcoin MPI Has Formed A Bearish Crossover Recently

As pointed out by an analyst in a CryptoQuant Quicktake post, the 365-day moving average (MA) of the BTC MPI has crossed above the 90-day recently. The “MPI” here refers to an indicator that measures the ratio between the miner outflows and the yearly MA.

The “miner outflows” are the amounts these chain validators transfer out of their combined wallets. Generally, the miners take out their coins for selling purposes, so the miners outflows can measure how much dumping they are currently partaking in.

Miner outflows are usually not that unusual, though, as this cohort has to constantly sell what they mine to pay off their running costs like electricity bills. What can be notable, however, is whether their selling deviates from the norm.

The MPI provides us with information about precisely this since it compares the outflows against their 365-day MA. When the metric is greater than 0, the miners are selling more than the average for the past year, while negative values imply the opposite.

Now, here is a chart that shows the trend in the 90-day and 365-day MAs of the Bitcoin MPI over the last few years:

Bitcoin MPI

The above graph shows that the 90-day MA Bitcoin MPI (colored in orange) has declined during the last few weeks. Recently, the metric crossed below the 365-day MA, consolidating sideways.

Historically, the crosses of the two MAs of the BTC MPI have appeared to be significant for the cryptocurrency’s price. In the chart, the quant has highlighted the major crossovers that occurred during the last few years.

Whenever the indicator’s 90-day MA has observed a cross above the 365-day MA, BTC has gone off to witness some bullish momentum. Such a cross preceded the April 2019 rally, the 2021 bull run, and the rally that started this January.

On the other hand, the opposite type of cross has proven to be bearish for the asset’s value, as steep declines have followed it. Since this death cross has once again formed for Bitcoin recently, it may signal that this year’s rally has reached its conclusion.

However, the crossover is still in the process of forming, meaning that the coming weeks may be important. If the 90-day MA can turn itself around quickly, then the death cross may not form, but if the metrics continue in their current trajectory, the bearish signal would be solidified.

BTC Price

Regardless of the death cross, Bitcoin has observed some sharp bullish momentum during the past 24 hours, as the asset has surged to the $28,300 level.

Bitcoin Price Chart

Bitcoin Miners Show Signs Of Dumping, Bad For Rally?

On-chain data shows Bitcoin miners could be dumping right now, a sign that could provide an impedance to the rally.

Bitcoin Miners’ Position Index Has Shot Up Recently

As pointed out by an analyst in a CryptoQuant post, miners may be putting selling pressure on the market currently. The relevant indicator here is the “Miners’ Position Index” (MPI), which measures the ratio between the miner outflows and the 365-day moving average of the same.

The “miner outflows” refer to the total amount of Bitcoin that all these chain validators are transferring out of their wallets at the moment. Usually, miners withdraw coins from their reserves with the main purpose of selling them. Thus, a high value of the outflows can suggest that this cohort is dumping large amounts right now.

As the MPI compares these outflows with their yearly average, the metric’s value can tell us how the current miner selling is compared with the mean for the last 365 days.

When this indicator has a high value, it means miners are selling at a higher degree than usual currently, while the metric having a low value could suggest there is lesser selling pressure coming from these chain validators than the average for the past year.

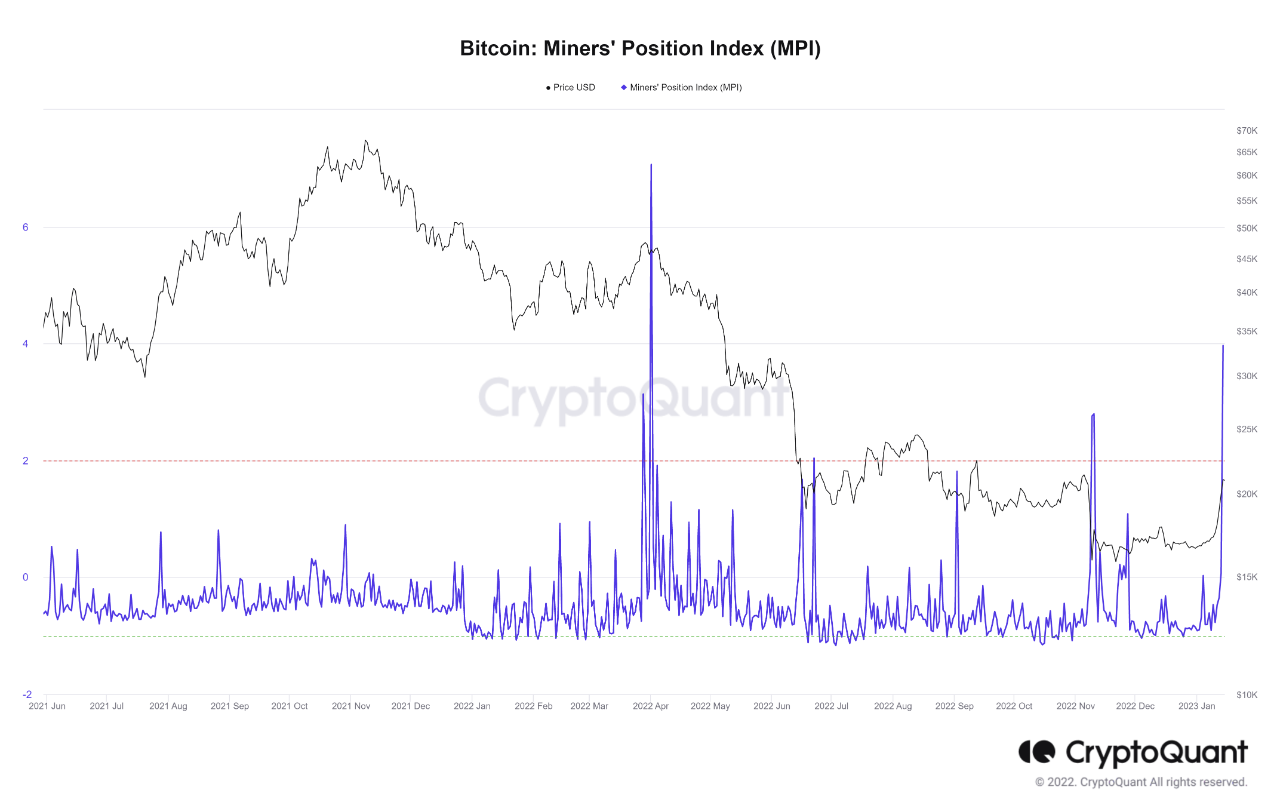
Now, here is a chart that shows the trend in the Bitcoin MPI over the past year and a half:

Bitcoin MPI

As shown in the above graph, the Bitcoin MPI has spiked up recently and has hit a value of about 4, the highest level that the indicator has observed since April of last year. The metric having such a large value would suggest miners are taking out way more coins than usual, and are therefore potentially putting extraordinary selling pressure on the market currently.

From the chart, it’s apparent that spikes in the metric have usually been followed by declines in the price of the crypto. The most extreme example was back in April 2022, when the price saw a very sharp drawdown not too long after the metric recorded even higher values than now.

The last time the indicator observed high values were back during the collapse of the crypto exchange FTX when the price once again saw a rapid downward move.

Bitcoin has been busy rallying during the past week or so, touching as high as $21,000 so far, so these increased withdrawals right now would suggest miners want to take advantage of this profit-taking opportunity while they still can, and dump their coins.

If this cohort indeed intends to sell with these transfers, then the crypto’s rally could possibly find some impedance and temporarily halt here, if not outright reverse its direction.

BTC Price

At the time of writing, Bitcoin is trading around $20,800, up 20% in the last week.

Bitcoin Price Chart

Bitcoin Bearish Signal: MPI Records Highest Value Since April 2022

On-chain data shows the Bitcoin MPI has surged to its highest value since the April of this year, a sign that may prove to be bearish for the crypto’s price.

Bitcoin Miners’ Position Index Has Spiked Up During Past Day

As pointed out by an analyst in a CryptoQuant post, this instance is the fifth time that the metric has sent a warning signal.

The “Miners’ Position Index” (or the MPI in short) is an indicator that measures the ratio between the miner outflows in USD, and the 365-day moving average of the same.

Generally, miners transfer coins out of their wallets (that is, make outflow transactions) for selling purposes. Thus, the MPI can tell us whether miners are selling more or less right now compared to their past year average.

When the value of this metric is high, it means miners are dumping more than usual currently. On the other hand, low values suggest these chain validators aren’t doing any heavy selling at the moment.

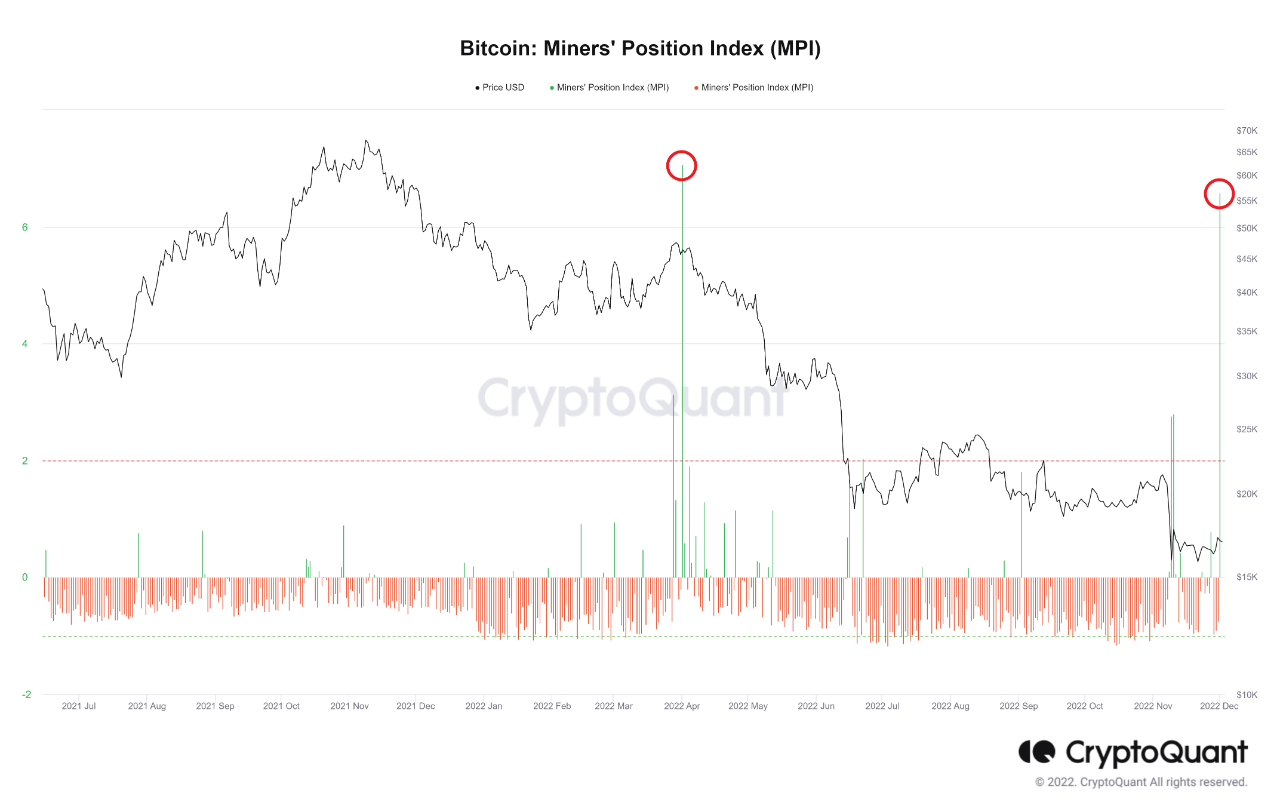
Now, here is a chart that shows the trend in the Bitcoin MPI over the past year and a half:

Bitcoin MPI

The value of the metric seems to have been pretty high recently | Source: CryptoQuant

As you can see in the above graph, whenever the Bitcoin Miners’ Position Index has crossed above a value of 2 during the past year, the price of the crypto has seen a decline shortly after.

There have been five such spikes in 2022 so far, the latest of which has only just been recorded in the last 24 hours.

This current surge has now taken the indicator’s value to the highest level since the spike back in April of this year.

When this previous spike was seen, Bitcoin was above $45k, but only a week later the crypto had crashed below $40k.

If the latest rise in miner selling also follows the same trend as back in April, then BTC may observe some downtrend in the coming days.

BTC Price

At the time of writing, Bitcoin’s price floats around $16.9k, up 3% in the last week. Over the past month, the crypto has lost 17% in value.

Below is a chart that shows the trend in the price of the coin over the last five days.

Bitcoin Price Chart

Looks like the price of the crypto has retreaded below the $17k level again | Source: BTCUSD on TradingView

Bitcoin has surged up in the last few days, but it’s unclear whether this rise will last, given the recent increased selling pressure from the miners.

Featured image from Hans-Jurgen Mager on Unsplash.com, charts from TradingView.com, CryptoQuant.com

Bitcoin MPI Rises To Highest Value Since March 2021, Bull Rally Soon?

On-chain data suggests the Bitcoin MPI indicator has observed a rise recently, now reaching the same values as March 2021. Past pattern may hint that a bull rally could follow here.

Bitcoin MPI Seems To Be Catching Some Uptrend After Months Of Inactivity

As explained by an analyst in a CryptoQuant post, the BTC MPI metric’s current trend may suggest that a bull rally could occur soon, if historical pattern is anything to go by.

The “Miners’ Position Index” (or the MPI in short) is an indicator that’s defined as the ratio of the number of all Bitcoin miners’ outflows divided by the 365-day moving average of the same.

In simpler terms, what this metric tells us is how the miner selling behavior is right now compared to the average over the past year.

When the value of this indicator rises, it means miners are selling more BTC recently. On the other hand, the index’s value going down implies miners are turning less active as they are moving around a lower amount of coins.

Related Reading | Buying Bitcoin Might Be Good Call For The Young, Legendary Trader Peter Brandt Says

Now, here is a chart that shows the trend in the BTC MPI over the past few years:

Looks like the value of the indicator has been on the rise recently | Source: CryptoQuant

As you can see in the above graph, the quant has marked three important regions of trend for the Bitcoin MPI since 2018.

It looks like, in each of these regions the index made a U-shaped curve where the metric’s value fell as the bull period ended and rose as a new rally approached.

Related Reading | Bitcoin On Course To Hit $100K Nine Months From Now, Bitbull CEO Predicts

For many months now, the BTC MPI has been in the middle (bear) region of such a curve. But now, it looks like the indicator’s value is catching an uptrend again, and has now reached the same values as observed back in March of last year.

If the historical pattern will hold true this time as well, then the current trend formation may be leading towards the start of a new bull rally.

BTC Price

At the time of writing, Bitcoin’s price floats around $38.8k, up 0.5% in the last seven days. Over the past month, the crypto has lost 8% in value.

The below chart shows the trend in the price of the coin over the last five days.

BTC’s price seems to have been trending sideways over the last few days | Source: BTCUSD on TradingView

Since the sharp move up and down almost a week ago, there hasn’t been any significant volatility in the price of Bitcoin.

Featured image from Unsplash.com, charts from TradingView.com, CryptoQuant.com