Bitcoin Top In Yet? What The Legendary MVRV Ratio Says

Here’s what the latest trend in the Bitcoin Market Value to Realized Value (MVRV) ratio suggests about where the market is currently in terms of a top.

Bitcoin MVRV Ratio Has Seen A Decline To The 2.34 Level

According to data from the market intelligence platform IntoTheBlock, the BTC MVRV ratio surged high earlier this year as the cryptocurrency rally took place.

The “MVRV ratio” is a popular indicator that tracks the ratio between the Bitcoin market cap and the realized cap. The former is simply the total valuation of the asset’s supply at the current spot price, while the latter is an on-chain capitalization model.

The realized cap measures the total sum of the value of the cryptocurrency’s supply, assuming that each coin in circulation has its true value at the price at which it was last transferred on the blockchain rather than the current spot value.

One way to interpret the realized cap is that since it takes into account the buying price of every token in circulation (assuming that the last transaction of every token was indeed the point at which it last changed hands), it essentially sums up the total capital the investors have invested in the asset.

As such, the MVRV ratio tells us how the total value that Bitcoin investors are carrying right now (that is, the market cap) compares against the value they put in (the realized cap).

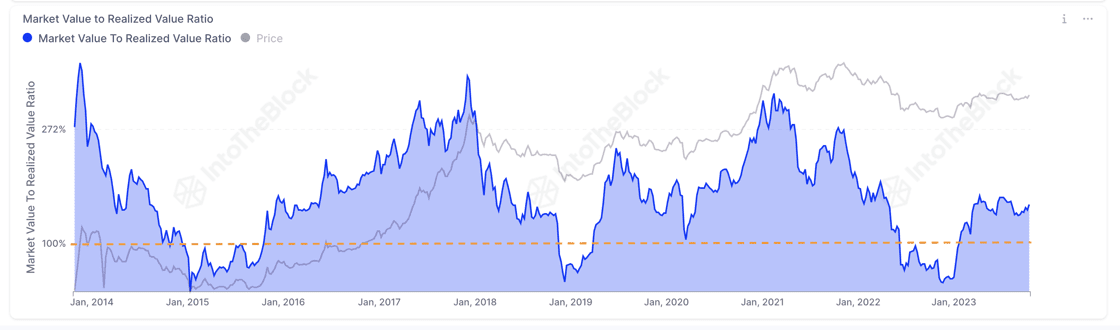
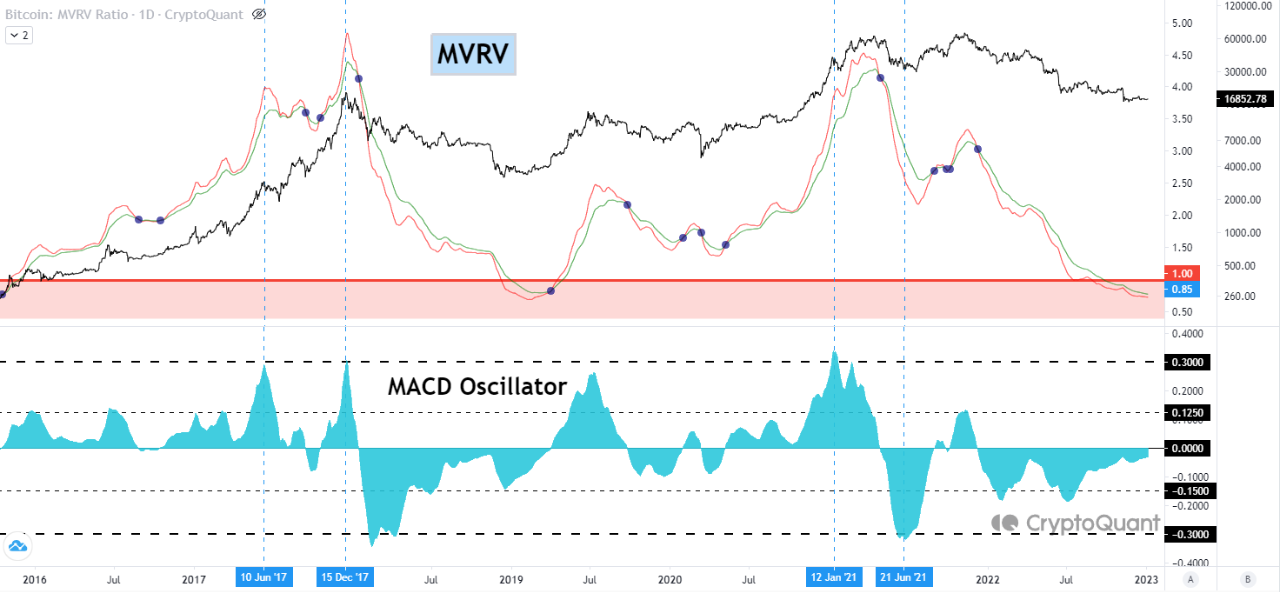
Now, here is a chart that shows the trend in the Bitcoin MVRV ratio over the past few years:

Bitcoin MVRV ratio

As is visible in the graph, the Bitcoin MVRV ratio has had a value greater than 1 for a while now. When the indicator has such values, the market cap is greater than the realized cap, and hence, the investors carry net profits.

With the latest rally in the asset, this indicator has surged to relatively high levels, a natural consequence of the holders’ profits ballooning up with the price surge.

After the recent drawdown in the price, though, the MVRV ratio has also turned itself around, as it’s now heading down. At present, the ratio has a value of around 2.34.

“Traditionally, an MVRV ratio above 3 has been a reliable marker for predicting price peaks,” notes IntoTheBlock. So far, in the current rally, the metric hasn’t crossed this mark. It did come close recently, but the latest decline has meant it has gained a bit more distance to the level.

Why have tops historically occurred at high values of the Bitcoin MVRV ratio? The answer is that investors in profits are more likely to participate in selling, and this temptation to take profits only increases as their gains grow larger.

Because of this, selloffs are most probable when the market is holding extreme levels of profits, which is exactly what high MVRV ratio values reflect.

BTC Price

At the time of writing, Bitcoin is trading at around $67,200, up 3% over the past 24 hours.

Bitcoin Price Chart

This Bitcoin Indicator Has Hit Levels That Often Lead To Corrections

On-chain data shows a Bitcoin metric has recently hit levels that have historically led to corrections in the cryptocurrency’s price.

Bitcoin Is Currently 40% Above The Cost Basis Of Short-Term Holders

CryptoQuant Netherlands community manager Maartunn explained in a post on X that the BTC price is currently 40% above the cost basis of the short-term holders.

The indicator of interest here is the “Market Value to Realized Value (MVRV) ratio,” which is an indicator that keeps track of the ratio between the Bitcoin market cap and the realized cap.

The “realized cap” refers to a capitalization model for the asset that assumes that the real value of any coin in circulation isn’t equal to the current spot price but rather the price when it was last transacted on the blockchain.

The previous transfer of any coin was likely the last point at which it changed hands, so the price at that time would act as its current cost basis. As such, the realized cap is essentially the sum of the cost basis of the entire supply.

Therefore, the metric’s value can measure the total capital the holders have put into the asset. And since the market cap is the value they are currently carrying, its comparison against the realized cap in the MVRV ratio can tell us about the amount of profits or losses the investors hold.

In the current discussion, the MVRV ratio of the entire market isn’t of interest but rather of a particular segment of it: the “short-term holders” (STHs). The STH cohort includes all investors who bought their coins within the past 155 days.

The below chart shows the trend in the Bitcoin MVRV ratio specifically for these investors over the history of the cryptocurrency:

Bitcoin STH MVRV

As displayed in the above graph, the Bitcoin STH MVRV has been greater than 1 for a while now as the STHs have been carrying net profits, but with the latest rally in the asset, the indicator has shot up to especially high levels.

The BTC spot price has recently been 40% over this cohort’s average cost basis. The chart shows that this same level has led to asset corrections a few times in the past.

Naturally, this doesn’t mean that the coin would necessarily see a correction here, but given the historical pattern, there is a chance one would occur.

The likely reason behind this pattern is that Bitcoin investors are more likely to give in to the allure of profit-taking the larger their profits grow.

BTC Price

Bitcoin has gone through some significant volatility since setting its brand new all-time high above the $69,000 level, with its price now trading around $67,700.

Bitcoin Price Chart

Bitcoin MVRV Hits Levels That Lead To Parabolic Bull Run In 2020

On-chain data shows the Bitcoin MVRV ratio is currently at the same high levels as those that led to the parabolic bull run back in 2020.

Bitcoin MVRV Ratio Has Shot Up As Latest Rally Has Occurred

As pointed out by CryptoQuant founder and CEO Ki Young Ju in a post on X, the MVRV ratio has just hit a value of 2.5. The “Market Value to Realized Value (MVRV) ratio” is a popular on-chain indicator that keeps track of the ratio between the Bitcoin market cap and the realized cap.

The “realized cap” here refers to a capitalization model for BTC that assumes that the real value of any token in circulation is not its current spot price (as the market cap takes it to be), but rather the value at which the coin was last transferred on the network.

The previous transaction for any coin may be considered the last time it changed hands, which implies that the price at the time would be its current cost basis. As such, the realized cap adds up the cost basis of every token in circulation.

This means that the realized cap essentially keeps track of the total amount of capital that the investors have used to purchase their Bitcoin. Since the MVRV ratio compares the market cap (that is, the value the investors are holding right now) against this initial investment, its value can tell us about the amount of profit or loss the investors as a whole are currently carrying.

Now, here is a chart that shows the trend in the Bitcoin MVRV ratio over the history of the cryptocurrency:

Bitcoin MVRV ratio

As is visible in the graph, the Bitcoin MVRV ratio has rapidly climbed up as the asset’s price has gone through its latest rally. In this surge, the metric has managed to exceed the 2.5 level.

When the ratio is greater than 1, it means that the market cap is higher than the realized cap right now, and thus, the overall market is holding its coins at some profit. A value of 2.5 implies the average wallet is currently carrying gains of 150%.

“In Nov 2020, MVRV was 2.5 at $18K, preceding the all-time high and parabolic bull run,” explains Ju. Back in that bull run, the peak of the first half of 2021 wasn’t hit until the MVRV ratio crossed the 3.7 mark, just like the two bull runs preceding it.

The top in November 2021, however, didn’t follow this pattern, as it formed close to the 3.0 level. It now remains to be seen which path Bitcoin would take in its current rally, if it is at all similar to either of these.

BTC Price

Following Bitcoin’s impressive 22% rally over the past week, the asset’s price is now trading around the $62,800 level, not very far from setting a new all-time high now.

Bitcoin Price Chart

Is Bitcoin Overvalued Yet? What Historical Data Suggests

Here’s what the data of this historical on-chain indicator suggests regarding whether Bitcoin has become overvalued after its latest uptrend.

Bitcoin MVRV Z-Score Hasn’t Climbed Too High Yet

As the Reflexivity Research co-founder pointed out in a post on X, the BTC MVRV Z-Score readings have heated up little compared to the values observed in past bull runs.

The “Market Value to Realized Value (MVRV) ratio” is an indicator that measures the ratio between the Bitcoin market cap and the realized cap. The “realized cap” refers to a capitalization model for the cryptocurrency that assumes the “true” value of any coin in circulation is the price at which it was last transacted on the blockchain.

Since the last transaction price of any coin was likely the price at which it changed hands, one way to interpret the realized cap is that it represents the total capital the holders have invested into the asset.

Since the MVRV ratio compares the market cap (the spot price) against this model, it can tell us whether the investors are holding more value than they put in right now.

If the investors are holding more than what they bought the coin for (that is, they are in net profits), they might be tempted to sell, and thus, BTC might be likely to see a correction. Similarly, the market being in losses can suggest the cryptocurrency’s price is currently undervalued and might be due to a rebound.

Now, here is a chart that shows the trend in the Z-Score of the Bitcoin MVRV ratio over the history of the coin:

Bitcoin MVRV Z-Score

The “Z-Score” is a statistical tool used to measure how far a data point is from the mean. In the graph, the analyst has marked two zones for the Bitcoin MVRV Z-Score where BTC has attained an overbought/underbought condition.

It would appear that historical bottoms in the asset’s price have formed when the metric has dipped inside the green zone. The tops haven’t been so simple, though, as they fluctuate a bit.

One common thing between all tops is that they have occurred at decently high values of the indicator. At such values, the investors make very high profits, so tops naturally become significantly probable.

The chart shows that the Bitcoin MVRV Z-Score has been climbing recently as the asset has rallied, but it’s yet to arrive at levels similar to past tops. “There will be corrections along the way, but zooming out Bitcoin is far from overvalued based on historical readings,” notes the analyst.

BTC Price

At the time of writing, Bitcoin is trading at around $43,800, up 15% in the last week.

Bitcoin Price Chart

Is Bitcoin Top Here? This Metric Would Say Otherwise

The Bitcoin MVRV ratio, an on-chain indicator, could suggest the asset may not have hit its top for the current rally just yet.

Bitcoin MVRV Ratio Says Market Isn’t Overheated Right Now

According to data from the market intelligence platform IntoTheBlock, past bull markets hit their peaks when the MVRV ratio crossed the 300% mark. The “Market Value to Realized Value (MVRV) ratio” refers to an indicator that keeps track of the ratio between the Bitcoin market cap and realized cap.

The “realized cap” here is a capitalization model for BTC that calculates the total value of the cryptocurrency by assuming that each coin in circulation is worth the same as the price at which it was last moved, rather than the current spot price.

As the price at which a coin was last moved on the blockchain was likely the price at which it changed hands, the realized cap can be interpreted as the total amount of capital that the investors as a whole have put into the asset.

The MVRV ratio compares the price of the coin (the market cap) with the realized cap, so it can tell us whether the investors are holding more or less than they put in.

Now, here is a chart that shows the trend in the Bitcoin MVRV ratio over the last few years:

Bitcoin MVRV Ratio

In the above graph, the Bitcoin MVRV ratio is shown as a percentage. At the 100% mark, the two capitalization models approach a equal value, suggesting that the market as a whole is just breaking-even.

Above this threshold, the investors are holding a net amount of profit, while below they are carrying loss. From the chart, it’s visible that the BTC MVRV ratio has remained above the break-even in recent months as the asset’s price has observed a rally.

At present, the metric is floating about the 150% level, suggesting that the market cap is 50% more than the realized cap. Historically, the larger the investors’ profits have gotten, the more likely they have become to take part in a selloff.

Because of this reason, tops have generally formed when the MVRV ratio has hit high levels. IntoTheBlock notes, however, that the bull markets in the past have usually only hit their peaks when the indicator has crossed the 300% mark.

Clearly, the indicator is still a significant distance away from this mark at the moment. This could be a potential sign that the Bitcoin rally hasn’t reached a state of overheat yet and thus, there might be more to come for the cryptocurrency’s price in terms of bullish momentum.

BTC Price

The Bitcoin rally has hit the pause button in the past week as the asset’s price has taken to sideways movement. Currently, the coin is trading around the $34,500 mark.

Bitcoin Price Chart

Bitcoin Surge Above $27,000 May Not Last, Here’s Why

Bitcoin has broken back above the $27,000 level during the past day, but if on-chain data is to go by, this surge may not last for long.

Bitcoin Investors Are Taking Profits At Highest Rate In 3 Months

According to data from the on-chain analytics firm Santiment, there is a chance that a short-term correction could happen for the cryptocurrency. The relevant metric here is the “ratio of daily on-chain transaction volume in profit to loss,” which, as its name suggests, tells us about how the profit-taking volume compares against the loss-taking volume on the Bitcoin network right now.

This indicator works by going through the transaction history of each coin being sold/transferred on the blockchain to see what price it was moved at before. If this previous selling price for any coin was less than the current spot price, then that coin is being sold at a profit right now.

The sale of all such tokens would contribute toward the Bitcoin profit-taking volume, while coins of the opposite type would add towards the loss-taking volume.

Now, here is a chart that shows the trend in this BTC metric over the past few months:

Bitcoin Profit-Taking Volume

As displayed in the above graph, this Bitcoin indicator has observed a large spike as the cryptocurrency’s price itself has seen a surge beyond the $27,000 mark and has reached a value of 2.51.

When the metric has a value greater than zero, it means that the profit-taking volume is more than the loss-taking volume. On the other hand, values under this threshold suggest the dominance of loss-taking.

At the current value of 2.51, the profit-taking volume outweighs the loss-taking one by 3.51 to 1. This disparity between these two volumes is the highest it has been since around three months ago.

Historically, intense profit-taking has usually resulted in at least a short-term top for Bitcoin, so it’s possible that the current values of the metric would also result in a correction for the price.

In the chart, Santiment has also attached the data for the “Market Value to Realized Value (MVRV) ratio,” which keeps track of the difference between the Bitcoin market cap and realized cap.

The latter of these is basically a measure of the total amount of capital that the investors as a whole have put into the cryptocurrency, so this metric tells us how the value that the holders are carrying currently compares with their total investment.

From the graph, it’s visible that the 7-day Bitcoin MVRV ratio has turned notably positive with this rise, which implies that the investors are carrying profits at the moment.

The analytics firm notes that this metric going back below zero would be ideal for the next leg up, as the holders being in loss would lead to an exhaustion of the profit-sellers.

BTC Price

So far, despite the aggressive profit-taking happening in the market, Bitcoin has managed to hold above the $27,000 mark.

Bitcoin Price Chart

Bitcoin MVRV At Critical Support Line, Will Retest Be Successful?

On-chain data shows the Bitcoin Market Value to Realized Value (MVRV) ratio is nearing a retest that could be crucial for the asset.

Bitcoin MVRV Ratio Is Nearing In On The 1.2 Level

As an analyst in a CryptoQuant Quicktake post explained, the 1.2 level of the MVRV ratio has historically been a support line for the cryptocurrency. The “MVRV ratio” is an indicator that measures the ratio between the Bitcoin market cap and the realized cap.

The “realized cap” here refers to a capitalization model for BTC that assumes the real value of each coin in circulation isn’t the current spot price but rather the price at which the coin was last bought/transacted on the blockchain.

As the realized cap considers the cost basis or acquisition price of each investor in the market, the model essentially represents the total capital that the holders have put into the asset.

Thus, comparing the market cap against the realized cap in the MVRV ratio can provide hints about whether the investors are holding more or less value than they put in.

When the ratio’s value is greater than 1, it means that the market as a whole is sitting on some profits right now. Generally, the higher the MVRV goes above this mark, the more probable corrections become for the asset as investors look to harvest their gains.

On the contrary, the indicator below this mark can signal that BTC may be underpriced right now, as the average holder in the sector carries coins at a loss.

Now, here is a chart that shows the trend in the Bitcoin MVRV ratio over the last few years:

Bitcoin MVRV Ratio

As is visible in the above graph, the Bitcoin MVRV ratio has been above the 1 mark during the past few months. The metric broke above this line in January when the rally started. Besides a retest in March, the indicator has remained above this level since then, implying that the holders have enjoyed profits.

The 1 level has been important historically for the asset. Still, the quant notes that another value is notable: 1.2. This line has supported the asset a few times in the past, as the analyst has highlighted in the chart (the yellow boxes).

Most recently, Bitcoin found support at this level in June, where the cryptocurrency could propel itself back up with a sharp rally. The metric is heading down and again approaching a retest of this line, as its current value is 1.27.

Naturally, a successful retest could be positive news for Bitcoin, but a failure might lead to an extended drawdown for the asset’s price.

BTC Price

As the chart below shows, Bitcoin has continued to consolidate recently, with the asset’s price still trading around the $25,700 level.

Bitcoin Price Chart

$24,400 May Be Next Major Level Of Support For Bitcoin, Here’s Why

Historical data of an on-chain indicator may suggest that the $24,400 level could be a major level of support for Bitcoin right now.

Bitcoin STH MVRV Would Hit 1.0 If Price Declines To $24,400

According to this week’s edition of the Glassnode report, the 1.0 level of the Bitcoin STH MVRV has been a point of support for the market during uptrends in the past. The “STH” here refers to the  “short-term holder group,” which is a Bitcoin cohort that includes all investors who have been holding onto their coins since less than 155 days ago.

The “market value to realized value” (MVRV) is an indicator that measures the ratio between the Bitcoin market cap and its realized cap. The “realized cap” here is a BTC capitalization model that aims to find the “real” value of the asset by assuming that the value of each coin in circulation is not the current price, but the price at which it was last moved on the blockchain.

Since the realized cap accounts for the price at which the investors bought (which is the price at which their coins last moved), its comparison with the market cap (that is, the current price) can tell us about the degree of profitability or loss among the overall market.

When the MVRV is greater than 1, it means the average investor is holding an unrealized profit with their BTC right now. On the other hand, values below this threshold imply the market as a whole is holding some amount of unrealized loss currently.

Now, the “STH MVRV,” the actual indicator of interest in the current discussion, naturally measures the value of the ratio specifically for the coins owned by the Bitcoin short-term holders.

The below chart shows the trend in the 7-day average value of this metric over the last few years:

Bitcoin Short-Term Holder MVRV

In the graph, Glassnode has marked the lines of the 7-day average Bitcoin STH MVRV that have been relevant to the price of the cryptocurrency during the last few years.

It looks like short-term corrections for the asset have generally become more probable when this indicator has crossed a value of 1.2. At this level, the STHs hold unrealized profits of 20%.

The recent drawdown in the cryptocurrency’s price from the $30,000 mark also took place when the metric was above this level. To be more specific, the indicator had a value of 1.33 when the asset was rejected, implying that the STHs had 33% profits.

The reason that high MVRV values of this cohort have usually made a decline more probable for the price is that the higher the amount of profits that the STHs hold, the more likely they become to sell and harvest their gains.

From the chart, it’s visible that the on-chain analytics firm has also marked the relevance of the 1.0 level (that is, the threshold line between profit and loss) to the cryptocurrency. Interestingly, this level has generally provided support to the price during periods of uptrend.

The likely explanation behind this trend is that the 1.0 level serves as the cost basis of the majority of the STHs in the market, so when the price hits this mark, these investors look at this point as a profitable zone to accumulate more of the asset. Obviously, this behavior is only seen during rallies, as holders would only find it worthful to buy more if they think the price has the potential to grow.

As the market is right now, the price would need to decline to $24,400 in order to hit this 1.0 level. This implies that if Bitcoin observes a deep decline in the near future, $24,400 could be the level that can provide support to it, considering the pattern that has held during the last few years.

BTC Price

At the time of writing, Bitcoin is trading around $28,500, down 1% in the last week.

Bitcoin Price Chart

Quant Explains How Bitcoin MVRV MACD Can Signal Price Trends

A quant has broken down how the Bitcoin MVRV MACD oscillator could be used to check for signals in the price.

Bitcoin MVRV MACD Oscillator As Price indicator

As explained by an analyst in a CryptoQuant post, this metric can help detect both the lows and the highs in the price, as well as the greater trends. The “Bitcoin MVRV” is an indicator that measures the ratio between the market cap and the realized cap.

Here, the “realized cap” is a capitalization model for BTC that values each coin in circulation at the price at which it was last moved, rather than taking the same current BTC price as the value of all the coins, as the normal market cap does.

Since the realized cap is sort of a “true” value model for the coin, its comparison with the market cap (in the MVRV) can tell us whether the coin is undervalued or overvalued at the moment. When the MVRV is greater than 1, it means BTC is overpriced right now, while having values below the threshold suggests it’s underpriced.

Now, to use MVRV as a trading tool, the quant has taken the MACD oscillator of the indicator. A MACD oscillator is just the difference between the short-term and long-term exponential moving averages (EMA) of the metric in question. Here, these EMAs are the 50-day and the 100-day versions.

The below chart shows how the Bitcoin MVRV MACD can be used for finding tops and bottoms in the price:

Bitcoin MVRV MACD

According to the quant, whenever the MVRV MACD has been higher than 0.3, it has been a signal that BTC is overbought currently. On the other hand, values less than -0.3 have signaled underbought conditions.

From the chart, it’s apparent that while these signals haven’t coincided with the cycle tops and bottoms, they have still correctly indicated some local tops and bottoms.

Now, here is another graph where the analyst has highlighted how divergences between the price and the MVRV MACD can signal future trends:

Bitcoin MVRV Trends

“A divergence occurs when the direction of a technical indicator and the direction of the price trend are moving in opposite directions,” explains the analyst. In the graph, it’s visible that whenever the MVRV MACD has moved up inside the negative region while the price consolidates sideways or declines, a bullish divergence has formed for Bitcoin.

Similarly, a bearish divergence has taken shape when the value of the crypto has been rising, but the indicator has been going down in the zone above zero. At present, none of these signals have formed in the current bear market so far.

BTC Price

At the time of writing, Bitcoin is trading around $16,800, up 1% in the last week.

Bitcoin Price Chart

Bitcoin MVRV Shows Top Isn’t In Yet, BTC Still Has Room To Grow

The MVRV indicator shows that Bitcoin currently hasn’t reached the top yet, and the crypto may still have room to grow.

Bitcoin MVRV Ratio May Show The Top Hasn’t Been Reached Yet

As pointed out by a CryptoQuant post, on-chain data suggests MVRV ratio values are still low right now, implying that the coin hasn’t yet made the top.

The Market Value to Realized Value (or MVRV in short) ratio is a Bitcoin indicator that’s defined as the market cap divided by the realized cap.

MVRV Ratio = Market Cap ÷ Realized Cap

The metric’s value tells us whether BTC’s current price is fair or not. If the ratio gets too high, it may mean that the coin is overvalued right now. This may imply there is selling pressure at this point.

On the other hand, the price of the coin may be considered undervalued during periods where the MVRV ratio is low. A buying pressure could be present while such values sustain.

Now, here is a chart that shows the trend in the value of this Bitcoin indicator over the past few years:

Looks like MVRV values are still not very high | Source: CryptoQuant

As the above graph shows, during all the previous bull runs, the indicator’s value has shown sharp spikes near the top.

Related Reading | Inflation fears sparks Bitcoin rally before Taproot – Crypto Roundup, Nov 15, 2021

As very high values suggest Bitcoin is overvalued and that a correction could come soon, the MVRV ratio may be used to spot tops. Similarly, low values may be considered good buying opportunities.

Looking at the chart, the indicator’s value now seems be lower than what was seen during the early 2021 rally (and also during the 2017 bull run). So this may imply that despite BTC declining in the past few days, the top may not be in yet. And the crypto could still have more room to grow.

BTC Price

At the time of writing, Bitcoin’s price floats around $59k, up 9% in the last seven days. Over the past thirty days, the coin has gained 5% in value.

The below chart shows the trend in the price of BTC over the last five days.

BTC’s price has dropped off in the last few days | Source: BTCUSD on TradingView

Since Bitcoin made its new all-time high around $69k, the coin has been trending downwards. In the past few days, the crypto has mostly shown sideways movement.

Related Reading | Preview Of The Peak: November Rains Red For Bitcoin Holders

There hasn’t been any sign of recovery yet, but if the MVRV ratio is anything to go by, BTC’s price may still have a while to go during this run.

Featured image from Unsplash.com, charts from TradingView.com, CryptoQuant.com