Bitcoin Relative Open Interest Lowest Since Feb, Analyst Says “Hard To Be Bearish”

Data shows the Bitcoin Open Interest as a percentage of its market cap has been at lows recently, a sign the derivatives side has been healthy.

Bitcoin Open Interest Is Now Less Than 2% Of The Market Cap

As explained by analyst James Van Straten in a new post on X, the derivatives side of the market has looked “extremely healthy” while BTC’s latest recovery has occurred.

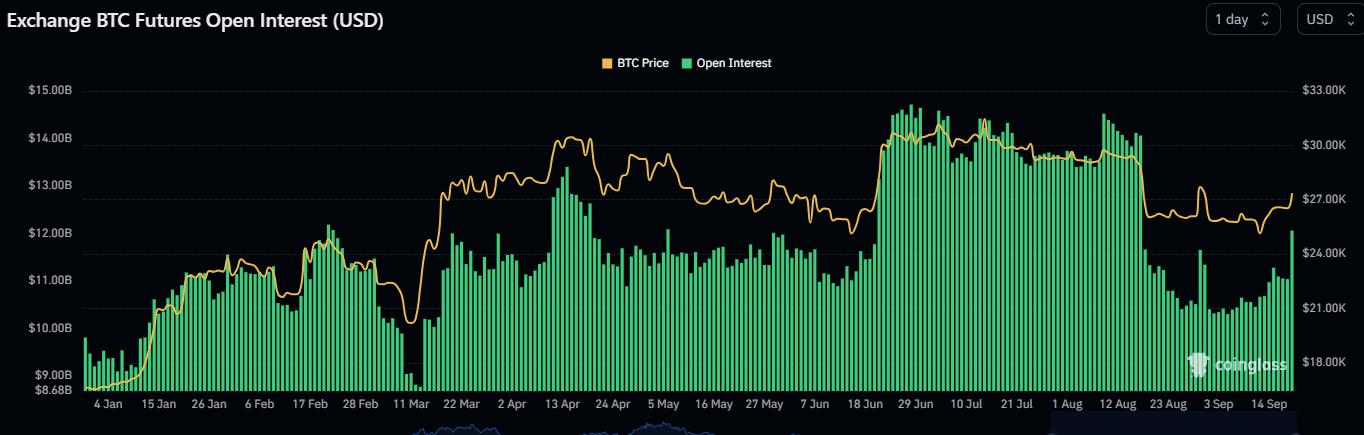
The metric of interest here is the “Open Interest,” which keeps track of the total amount of derivatives-based Bitcoin positions that are currently open on all centralized exchanges.

When the value of this indicator goes up, it means that the investors are opening up more positions on the market right now. Generally, the total leverage in the market rises when such a trend takes place, so the price of the asset could end up turning more volatile following it.

On the other hand, a decline in the metric suggests users are either closing up their positions of their own volition or getting forcibly liquidated by their platform. The cryptocurrency may behave in a more stable manner following such a decrease.

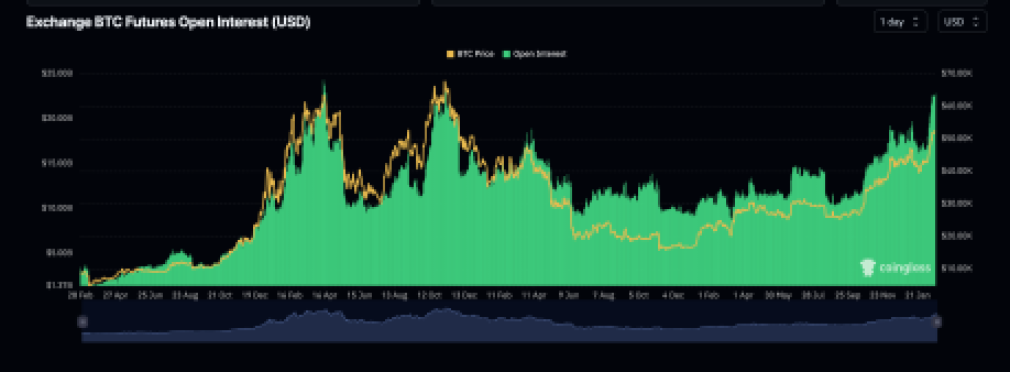
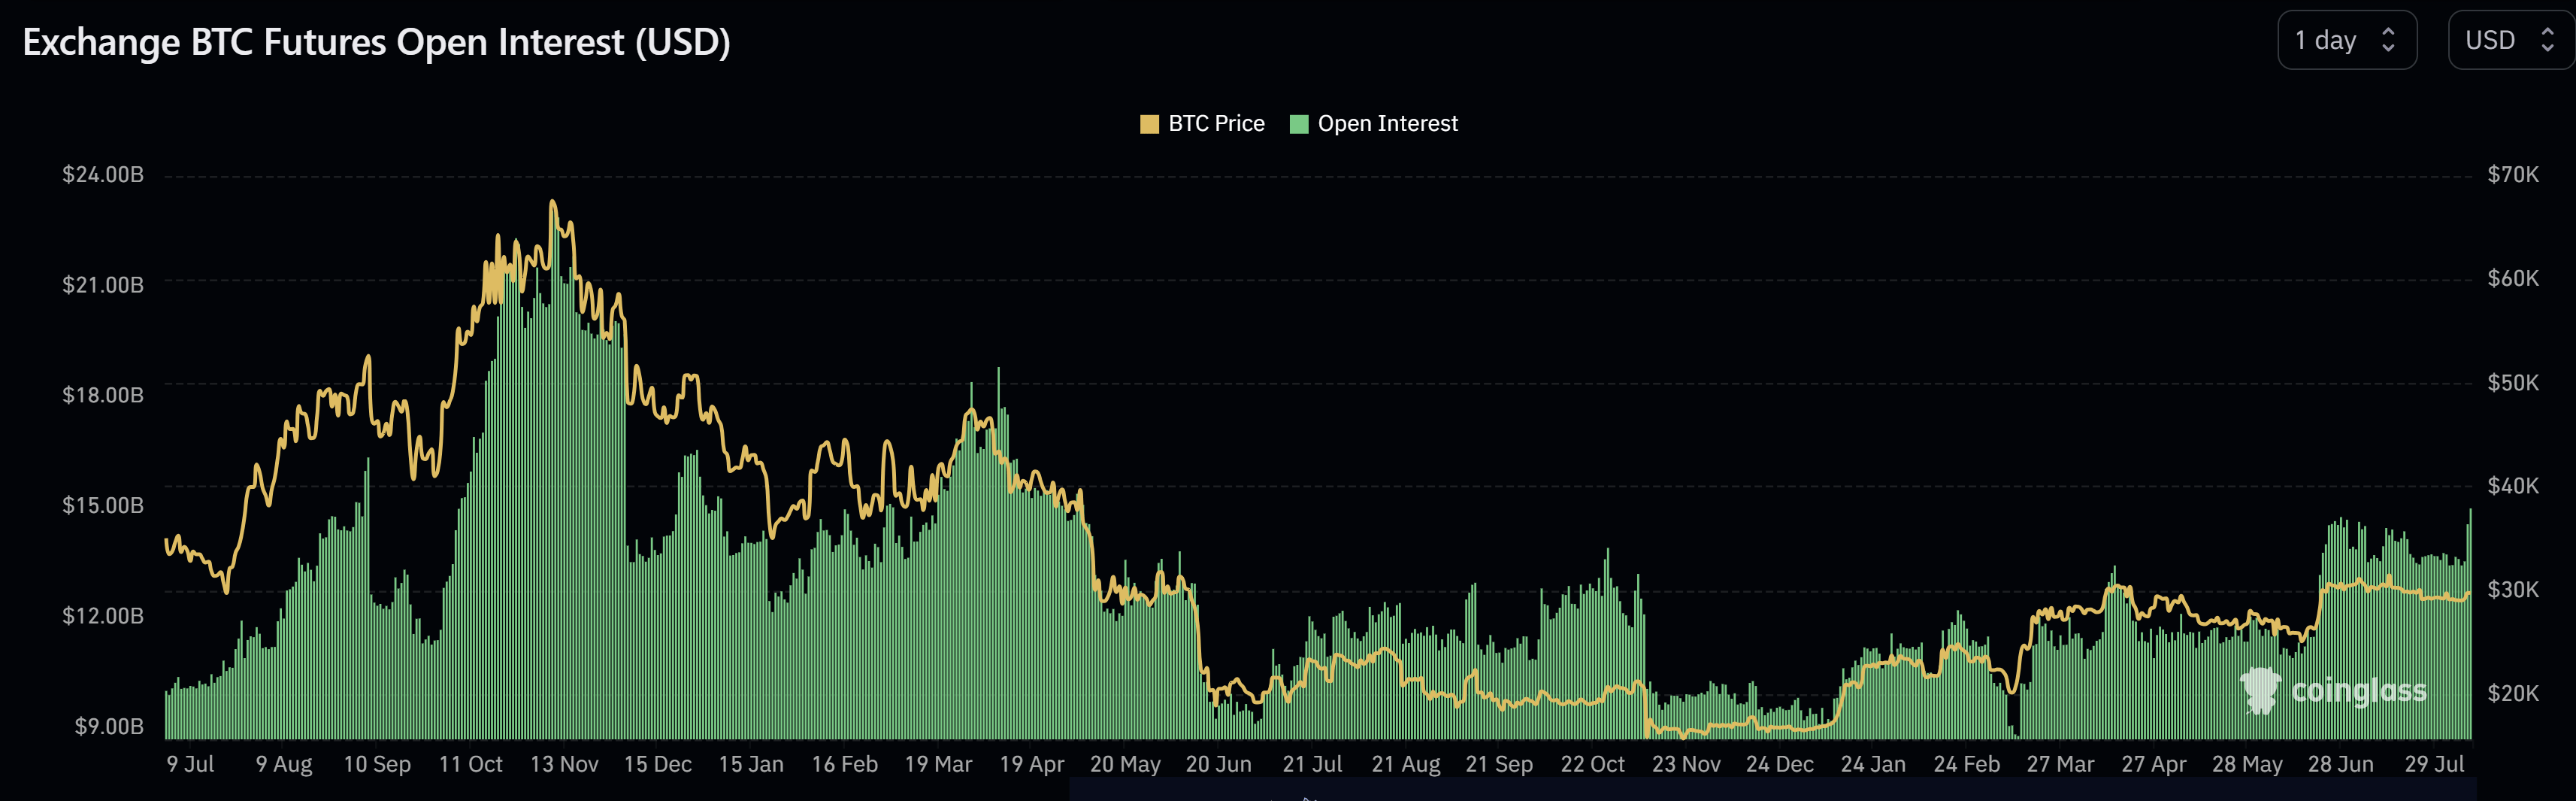
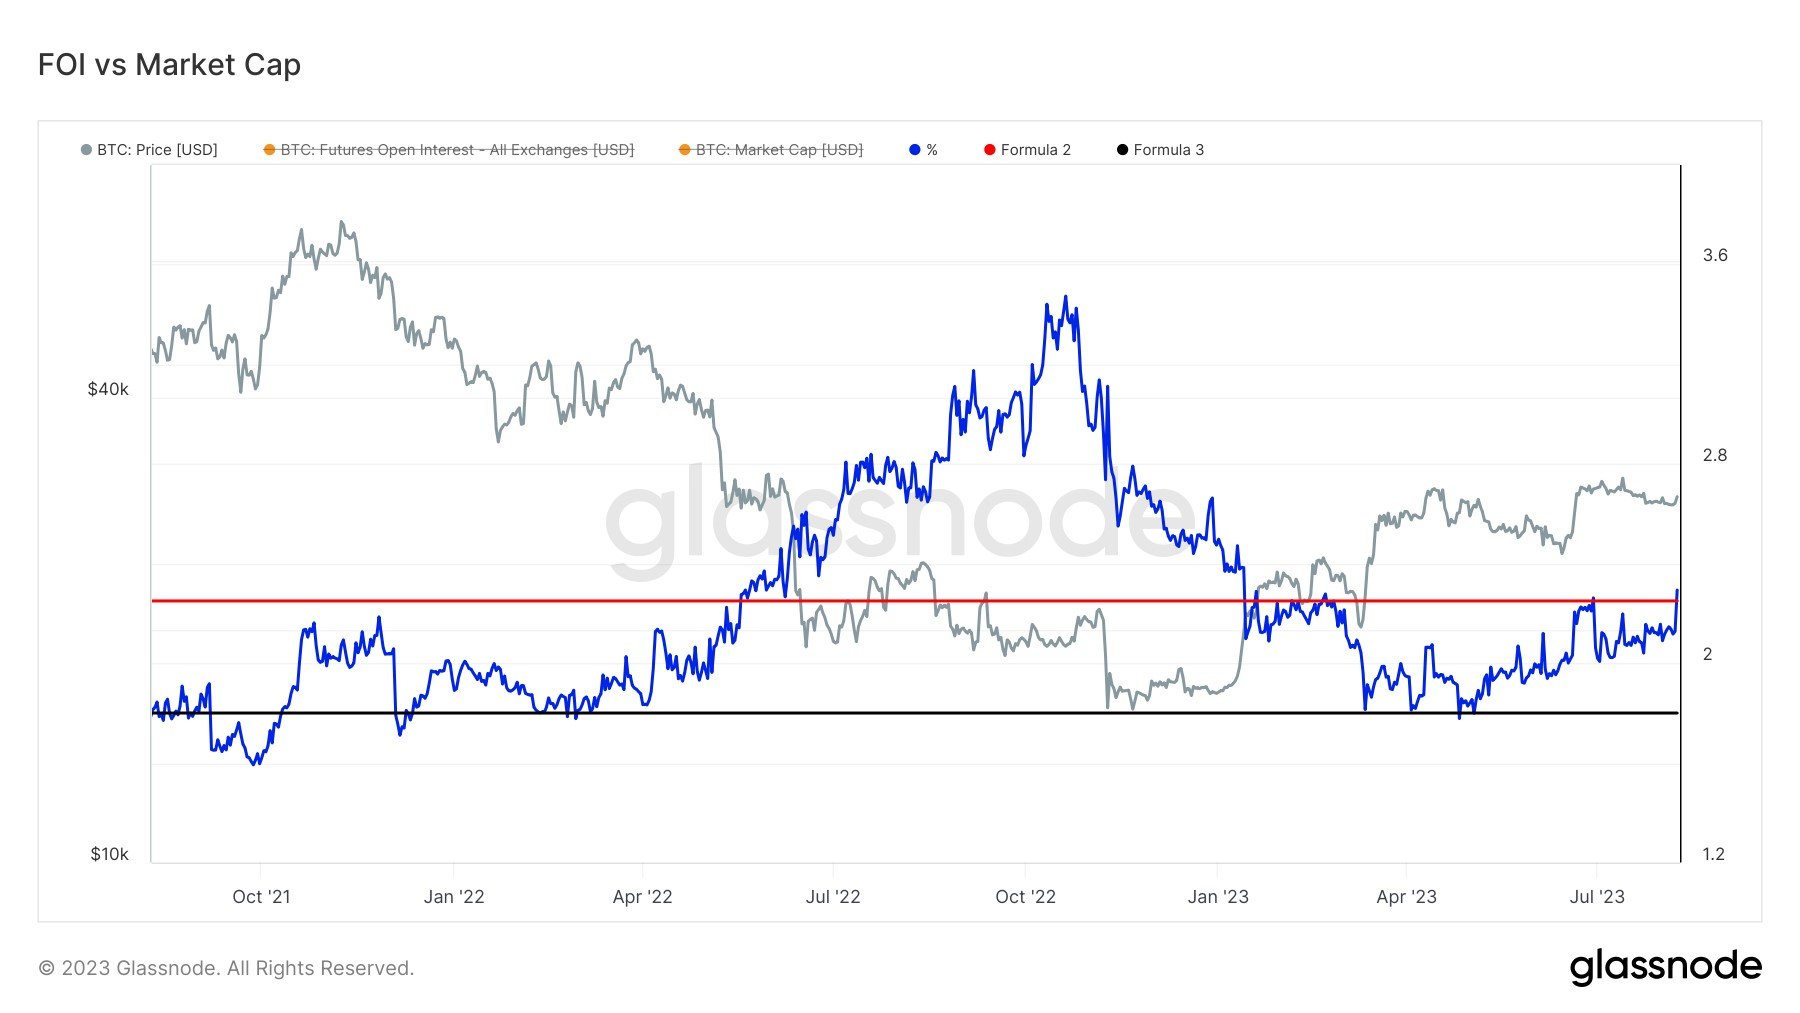
Now, here here is a chart that shows the trend in the Bitcoin Open Interest over the past few years:

Image

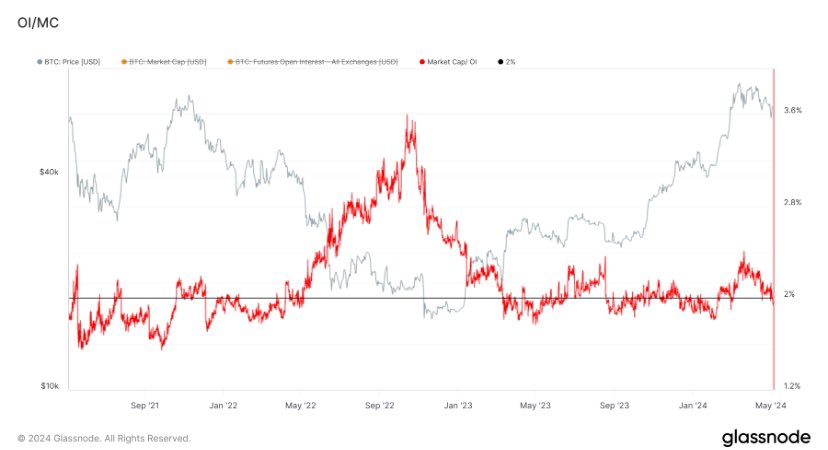
In the graph, the Open Interest is displayed as a percentage of the asset’s market cap (that is, the total valuation of the entire BTC circulating supply at the current spot price).

It would appear that the indicator has registered a drawdown recently and has slipped under the 2% mark. This would suggest that the positions on the derivatives market now make up for less than 2% of the market cap.

From the chart, it’s visible that the metric had earlier spiked to a high as the coin’s rally towards a new all-time high had taken place. Interestingly, the market cap was rapidly going up in this rally, but this ratio was still trending up, implying that speculation had been growing at a rate faster than the price.

This may have been a sign that the derivatives side was starting to become overheated. In the drawdown that had followed the price top, the investors had started getting liquidated, leading to the ratio registering a decline.

The most recent price drop had helped reset the market further, bringing the ratio down to levels not seen since February. Bitcoin has been mounting a recovery effort in the past few days, but so far, the derivatives market has remained cool. “Hard to be bearish here,” says the analyst.

It now remains to be seen if the health of the market would continue to look optimistic in the coming days, thus potentially allowing for the recovery to go a step further.

BTC Price

Bitcoin had returned back above $65,500 earlier, but the asset has since seen a small pullback as it’s now down to $64,100.

Bitcoin Price Chart

Bitcoin Open Interest Reaches $69,000 ATH Levels, What This Means For Price

The Bitcoin open interest has been on the rise over the last few weeks as the price has climbed continuously. This sustained rise in the open interest is a reflection of the heightened interest in the cryptocurrency since the United States Securities and Exchange Commission (SEC) approved Spot Bitcoin ETFs for trading. The BTC open interest has now climbed to historical levels, reaching 2021 all-time high levels.

Bitcoin Open Interest At 2021 Levels

According to data from Coinglass, the Bitcoin open interest has risen to more than $24 billion. This growth represents around a 50% jump in the open interest since the year 2024 began. But more importantly, the open interest has risen to levels not seen since 2021.

Looking at the open interest chart, the last time that the Bitcoin OI was this high was back in November 2021, when the cryptocurrency reached its all-time high price of $69,000. This rise in the OI has been consistent across crypto exchanges, with CME, Binance, and ByBit leading the charge and commanding more than 50% of the open interest.

Bitcoin open interest

The continuous rise has also come with a rise in the greed levels among crypto investors. Currently, the Crypto Fear & Greed Index is sitting firmly in Greed, suggesting that crypto investors are in a place where they are willing to take more risks than usual.

Implications For The BTC Price

With the Bitcoin open interest this high, it could end up being negative for the BTC price. This is because past performances where the open interest has risen so rapidly have often ended in a market crash. The same was the case in 2021 when the Bitcoin OI had set its previous record.

In 2021, when the BTC price crossed $69,000 and the open interest crossed $22 billion, the euphoria was incredibly high as it is now. However, this would be short-lived, with a market crash happening shortly after. The BTC price would eventually go from $69,000 to $46,000 by December, dropping by almost 40% in the space of one month.

If this same trend were to repeat itself in the current trend, then there could be a massive crash in the cards for Bitcoin. A similar decline would see Bitcoin fall back toward $41,000, which would wipe out the gains of the last few weeks.

However, there are different factors at play in the current market, such as Spot Bitcoin ETF issuers seeing massive interest in their exchange-traded products. Just last week, inflows into Spot BTC ETFs reached a new record of $2.2 billion. So if these large institutions continue buying BTC to meet the demand of their customers, then the BTC price could continue to rally.

Bitcoin price chart from Tradingview.com

Bitcoin’s Bullish Surge Ahead: Deribit Predicts Major Price Leap In Early 2024

A recent analysis by Deribit, a leading derivatives exchange, suggests a bullish sentiment for Bitcoin as we approach early 2024. This optimism is rooted in the current Bitcoin put-call options ratio, a critical option market metric.

Deribit’s Insight: Bitcoin Calls Outpace Puts Signaling Market Confidence

Notably, options are financial instruments that give traders the right, but not the obligation, to buy (call options) or sell (put options) an underlying asset at a specified price within a set time frame. The put-call ratio is used in options trading to measure market sentiment.

A put option signifies a bet on the price of an asset falling, while a call option represents a wager on its rise. A lower put-call ratio indicates that more traders are betting on the asset’s price increasing rather than decreasing.

Deribit’s analysis shows an increasing trend in the number of call options outstripping put options in Bitcoin’s options market. Luuk Strijers, Chief Commercial Officer at Deribit, highlighted that the put-call ratio for Bitcoin has consistently hovered “between 0.4 and 0.5” throughout the year.

This trend is particularly noticeable for options expiring in March and June 2024, suggesting that investors are increasingly using call options to position for a potential appreciation in Bitcoin’s value during this period.

The put-call options ratio falling below one is a bullish market indicator, as it shows that call volume, or bets on the price increase, surpasses the put volume, which are bets on the price decrease. According to Deribt, Bitcoin’s put-call ratio currently stands at 0.42, as of today.

A Surge In Crypto Derivatives Activity

Meanwhile, November has seen significant activity in the crypto derivatives market, as noted by Strijers. The Deribit executive attributes this increased market activity to higher levels of “implied volatility (DVOL),” which have spurred “opportunities and overall market volumes.”

Bitcoin open interest by expiration.

The expiration dates of the upcoming options, especially the significant one on December 29, are expected to maintain the heightened interest and activity in the market. With $5.7 billion in Bitcoin options and $2.7 billion in Ethereum options set to expire at the end of December, the market is poised for notable movements.

Bitcoin open interest based on previous day.

Bitcoin maintains its upward momentum, advancing by 1.8% over the past 24 hours. With Bitcoin currently trading at $38,344, the asset has sustained the gains achieved at the close of the previous month.

Bitcoin’s trading volume significantly reflects heightened market activity, suggesting ongoing buying pressure. In just the last day, trading volumes have surged from around $11 billion earlier in the week to over $21 billion, a noteworthy indication of increasing investor engagement.

Bitcoin (BTC) price chart on TradingView
Featured image from Unsplash, Chart from TradingView

Bitcoin Open Interest Tops 19-Month High: Historical Data Shows What To Expect

The Bitcoin open interest can often be an indication of where the BTC price might be headed next depending on whether or not the metric is rising or falling. This time around, the Bitcoin open interest has risen drastically, hitting 19-month highs in the process. Using historical data, it is possible to extrapolate what this means for the crypto’s price, especially as investors remain very bullish.

Bitcoin Open Interest Surges To $17.04 Billion

In an interesting turn of events, the Bitcoin open interest has been rising quickly across various exchanges. In the last 24 hours alone, this metric rose by a cumulative 7.89% across all exchanges in the space, bringing the total open interest to 454,150 BTC worth a staggering $17.04 billion.

For now, most of the Bitcoin open interest is concentrated across the CME, Binance, and ByBit exchanges. But perhaps what is even more interesting is that these open interest levels represent a 19-month high.

Bitcoin open interest

According to the data presented on the CoinGlass website, the last time that the Bitcoin open interest moved in this fashion and to this high was back in March 2022, before the historical Terra LUNA crash that sent the market into a prolonged bear market stretch.

This means that the last time that the Bitcoin open interest rose this much was during a time when investors were still very much in the throes of bull run euphoria. As such, the historical performance of the BTC price back then in relation to the open interest could serve as a guide to what might happen to the digital asset’s price next.

BTC price chart from Tradingview.com (Bitcoin open interest)

Historical Data Says BTC Price Will Surge

Similar to the current trend, the Bitcoin open interest had surged from around 38,000 BTC to over 44,000 BTC in the space of a month, and the BTC price followed quickly. This trend saw the price rise in March 2022 from $38,700 to over $47,000 before the month was over.

Going by this historical performance and assuming Bitcoin sticks to this trend, the rally may be far from over. The BTC price is also sitting at a similar price point at $37,500 and a similar surge could bring its price toward $45,000 before the month is over.

However, there is also the possibility that the open interest could peak at this level and begin to decline. Once this happens, then in the same fashion as in April 2022, the BTC price could begin to decline as the open interest drops. A similar crash would send the price back down toward $27,000.

Bitcoin Open Interest Rises By $1.8 Billion As BTC Breaks $27,000

Data shows the Bitcoin Open Interest has shot up by $1.8 billion as the cryptocurrency’s price has broken the $27,000 level.

Bitcoin Open Interest Has Exploded During The Past Day

The “Open Interest” indicator keeps track of the total amount of Bitcoin futures contracts currently open on all derivative exchange platforms.

When the value of this metric rises, it means that the investors are opening up new positions on the market right now. Generally, the cryptocurrency becomes more likely to display volatility when this happens, as new contracts usually imply an increase in the total leverage in the sector (“leverage” naturally being the loan amount holders can opt to take against their positions).

On the other hand, the indicator going down implies that a net amount of contracts are either closing up or getting liquidated. The asset may become more calmer following such a trend.

Now, here is a chart from CoinGlass that shows the trend in the Bitcoin Open Interest over the year 2023 so far:

Bitcoin Open Interest

The above graph shows that the Bitcoin Open Interest has registered a rather sharp surge today. The main instigator behind this futures rush appears to be the surge in the cryptocurrency’s mark beyond the $27,000 level.

Before this rise, the indicator had a value of $11.04 billion, but now it has hit the $12.81 billion mark, suggesting an increase of a whopping $1.77 billion (about 16%).

This rapid growth in the Open Interest can naturally lead to the asset becoming more volatile, although it’s hard to say in what direction this volatility might appear.

If this rise has come from shorts jumping in to bet against the asset, a further rise would result in their liquidation, thus fueling the price increase even further. If, however, the contracts being opened are long, then it may not end very well for the rally.

The chart shows that the Open Interest had a similar spike back during the Grayscale rally last month, but the longs that had opened then had ended up finding liquidation, as the price had returned to lower levels.

The funding rate, which measures the periodic fee that futures traders pay each other, may provide hints about whether the new positions are shorts or longs.

Bitcoin Funding Rate

As is visible in the graph, the Bitcoin funding rate is positive currently, but it hasn’t changed much with the Open Interest rise, implying that long and short positions are spread more evenly in this increase.

It remains to be seen where the cryptocurrency goes in the coming few days and if the Open Interest surge will play any role.

BTC Price

Bitcoin had surged to $27,400 earlier in the day but has since retraced back to $27,200.

Bitcoin Price Chart

Bitcoin Futures Frenzy Fizzles Out As Price Plunges Below $26,000

The crypto market has lost its sparkle lately, with bitcoin futures trading volume drying up as the flagship cryptocurrency struggles to stay afloat. 

Bitcoin futures open interest, which measures the buzz around upcoming contracts, has dropped to a 5-month low of $11.3 billion, according to data from Glassnode. This suggests traders are closing out positions and reducing exposure to volatile crypto assets. 

Bitcoin’s Struggles Below $26K: Is The Crypto Craze Losing Steam?

The disinterest comes as bitcoin prices dropped below $26,000 for the first time since August, dampening spirits across the crypto sphere. 

“It seems the market is running out of steam,” said Lee Reiners, professor of cryptocurrency law at Duke University. “Investors are realizing these assets don’t just go up forever.”

Analysts said that the drop in open interest appears related to the expiration of monthly and quarterly futures contracts, which drained trading activity and liquidity.

But the decline also signals fading confidence in Bitcoin’s upside potential amid mounting regulatory scrutiny, environmental backlash, and competition from alternative cryptos like ether.  

“The promise of quick riches that lured many retail investors now seems a distant dream,” said Jamie Dimon, CEO at JP Morgan. “The crypto craze appears to be losing momentum fast.”

Bitcoin has struggled to regain traction since its record high of nearly $69,000 in November 2021. Though some crypto bulls remain hopeful, continued lackluster performance could stall wider adoption.

BTCUSD

Exploring The Factors Behind Bitcoin’s Declining Fortunes

One significant factor is the regulatory scrutiny that has intensified worldwide. Governments and financial authorities are increasingly concerned about the potential risks associated with cryptocurrencies, including money laundering and tax evasion. This regulatory uncertainty has made some investors wary and hesitant to enter or remain in the market.

Bitcoin has faced backlash due to its environmental impact. Critics argue that the energy-intensive process of mining Bitcoin is unsustainable and contributes to carbon emissions. As environmental concerns take center stage, some investors and institutions may reevaluate their support for Bitcoin in favor of more environmentally friendly cryptocurrencies.

While Bitcoin pioneered, newer cryptocurrencies like Ethereum have gained traction, offering innovative features such as smart contracts and decentralized applications. These alternatives have attracted both developers and investors, diverting attention away from Bitcoin.

Bitcoin’s Future: Crossroads For The Original Crypto

For diehard believers, bitcoin’s funk may present a buying opportunity if prices continue drifting lower. But others argue that “digital gold” has lost its luster for good.

“It’s yet to be seen whether Bitcoin can reclaim its role as the crypto market’s flagship,” said Chen Alicia, a student of blockchain studies at NYU.

With futures interest shrinking, bitcoin is at a crossroads. Does the original crypto still have a bright future, or will up-and-comers displace it?

Grayscale Victory Sends Bitcoin Open Interest Surging After Hitting One-Year Lows

Over the last couple of weeks, the Bitcoin open interest had been on a downtrend that sent it toward one-year lows. However, with the Grayscale victory against the SEC coming on Tuesday, August 29, and sending a positive wave across the entire region, open interest in the digital asset has begun to surge once more.

Bitcoin Open Interest Pulls A Quick Reversal

On-chain data tracking platform Kaiko reported on Tuesday, August 29, that the Bitcoin open interest had been on the decline for a while. In the chart shared by the tracker, it is obvious that this BTC metric had previously fallen significantly since 2022.

As August drew to a close, the open interest in the digital asset eventually declined to levels not seen since the Terra network collapse back in May 2022. This suggested that it could be a good chance to get into Bitcoin and it would be proven true not too long after.

On the same day, news broke that Grayscale had triumphed over the United States Securities and Exchange Commission (SEC) in court over its bid for its Spot Bitcoin ETF filing to be reconsidered. This triggered a rapid uptrend in the price of the digital asset and the open interest followed suit.

According to data from Coinglass, the Bitcoin open interest is seeing double-digit growth on some exchanges already. The open interest on the dYdX exchange is up over 35%, and the cumulative open interest across all exchanges is now in the green, rising 9.55% in the last 24 hours.

Bitcoin open interest recovers

Does This Mean BTC Will Continue The Uptrend?

For now, the price of Bitcoin is still purely driven by the hype from the Grayscale victory. This means that there is no telling how long the uptrend will last and when it will start correcting downward. However, as long as investors remain optimistic about the victory, BTC will continue to enjoy green days.

As for open interest, a recovery isn’t always a good thing as it opens up an avenue for shorters to enter the market. For example, a look at Keiko’s chart shows open interest was high leading up to the FTX collapse in 2022. Then in early 2023 when the price of Bitcoin was rallying, open interest fell before picking up steam once more.

For now, BTC is still enjoying the spike in attention. The price of the cryptocurrency is up 5.35% in the last 24 hours to trade at $27,349.

Bitcoin price chart from Tradingview.com (open interest)

Will Bitcoin Volatility Continue? These Metrics Say Yes

Bitcoin has observed some sharp price action today, and if data of these metrics is to go by, the asset may not be done being volatile just yet.

Bitcoin’s Open Interest And Leverage Ratio Have Remained High

As explained by an analyst in a CryptoQuant post, some metrics are forming a pattern that can lead to more volatility in the cryptocurrency’s price. These indicators are the open interest and the estimated leverage ratio.

The “open interest” refers to the total amount of Bitcoin futures contracts that are open on all derivative exchanges. An increase in this metric suggests that the investors are opening more positions on the futures market right now, while a decrease implies some of them are closing their positions, or are getting liquidated.

The other metric of interest here, the “estimated leverage ratio,” keeps track of the ratio between the open interest and the derivative exchange reserve (that is, the total amount of Bitcoin sitting in the wallets of these derivative platforms).

What this metric tells us is the amount of leverage that futures users are opting for on average. High leverage can significantly increase the risk of a large number of contracts being liquidated, so whenever this metric has a high value, the market can become more probable to show high volatility due to violent liquidation events.

Now, here is a chart that shows the trend in these two Bitcoin indicators over the past few days:

Bitcoin Open Interest & Leverage Ratio

As displayed in the above graph, the Bitcoin open interest and estimated leverage ratio had both been at relatively high values right before the plunge that the asset saw in the past 24 hours.

In this sharp price plummet, the futures market naturally observed a high amount of liquidations, leading to the open interest registering some decrease. The metric, however, didn’t actually see that much of a cool down despite these liquidations, and it has now already reached back to the same levels it was at before the volatility.

This would suggest that the futures market users have opened new positions since the mass liquidation event. While the open interest had gone down in this event, albeit briefly, the leverage ratio actually hadn’t budged even that much.

Rather, the indicator has only been going up, implying that the users opening up the new futures contracts are only opting for higher and higher amounts of leverage.

Because of the open interest rebounding and the leverage ratio only trending higher, it would appear like a reasonable possibility that the Bitcoin price would observe more volatility in the near future.

Such volatility can take the coin in either direction, but generally, the side of the market with the less amount of contracts is the more probable one.

In the chart, the data for the “funding rates” is attached, which basically tells us whether the longs or the shorts are dominant in the futures market currently.

The funding rates had been positive in the latest futures market overheat, as well as in the one seen earlier in the month, but following today’s long liquidations, the metric has turned negative. This may suggest that a liquidation event involving the shorts is more likely to happen next.

BTC Price

At the time of writing, Bitcoin is trading around $28,500, down 3% in the last week.

Bitcoin Price Chart

Bitcoin Open Interest Hits Peak Since FTX Crash: What It Means

In a market that has been relatively quiet for weeks, Bitcoin (BTC) has suddenly sprung to life, with its Futures Open Interest (OI) reaching levels not seen since the FTX crash. Open Interest, a metric that measures the total number of outstanding futures that have not been settled, provides a glimpse into the trading activity and potential future price movements of an asset. A surge in OI can indicate heightened trading activity and interest in the market.

Starting early Tuesday, Bitcoin’s price action surged by more than 3.5%, breaking the $30,300 mark for the second time this month. This movement began around 5 am EST, pushing the price to a 16-day-high. The catalyst behind this surge seemed to be the rumor that insiders at BlackRock and Invesco have confirmed that a Bitcoin spot ETF is not a question of “if” but “when”, suggesting an approval within the next four to six months.

“Bitcoin whales opened giga long positions at $29k,” remarked CryptoQuant CEO Ki Young Ju. The Head of Research at CryptoQuant further added, “A lot of talk lately about increasing probability of Bitcoin spot ETF approval in the US. Now Coinbase premium sharply up and moving towards positive territory (implies Bitcoin demand in the US is strengthening). GBTC price discount has continued to narrow.”

Bitcoin Futures Open Interest Skyrockets To Yearly High

Aggregate OI for Bitcoin futures saw a significant jump, increasing by over $1 billion from the previous day to a staggering $14.95 billion, according to Coinglass data.

Bitcoin futures open interest

This surge marks the most substantial increase in over a month. However, derivatives activity on the CME, often seen as a gauge of institutional trading, remained relatively unchanged in OI, suggesting that the recent move might be predominantly retail-driven.

Miles Deutscher commented on Twitter, “Bitcoin open interest is now at its highest level since the FTX collapse. This indicates increased BTC trading activity from market participants. Looks like a big move is brewing.” Similarly, James V. Straten observed, “Bitcoin open interest is now greater than 2.25% of the market cap, approaching YTD highs, and looks exceptionally overheated.”

FOI vs market cap

The Kingfisher, a renowned data provider for Bitcoin derivatives, noted, “Coinbase selling into every other major exchange buying. Looks like Bybit & Bitmex degens are betting on another $BTC leg up. While Bitfinex seems to be selling here.”

On the options front, the analysts added that dealers seem bullish, ready to capitalize on both upward and downward movements. Their buying activity is currently stabilizing the price, while any significant upward trajectory could see them intensifying their buying. Meanwhile, the BTC liquidation map of The Kingfisher indicates that while there are still “some late high-leverage shorts to liquidate to the upside, but most of the short-term liquidity is down.”

Renowned analyst @52kskew provided insights into the BTC whale vs. algo divergence, stating, “Whales require quite thick liquidity to exit or close positions & most often this is during a squeeze event. Some firms will use algos in order to get the best price when closing out sizeable position (this is where TWAP algos come into play).”

Exit liquidity for whales

CPI Release To Take Out The Heat?

Notably, the Consumer Price Index (CPI) in the US is scheduled for tomorrow, Thursday, 8:30 am EST. The release has the potential to cause a mass liquidation of the overheated BTC futures market in both directions. A major move by the BTC price seems imminent.

Forecasts suggest a rise in the headline CPI from 3% to 3.3% year-over-year (YoY) for July, marking a significant transition as the positive impacts from the prior year start to wane. Notably, the Cleveland Fed’s Inflation Nowcast model projects a 3.42% headline CPI, marginally surpassing general expectations. Core CPI is expected to slightly decline from 4.8% to 4.7% YoY.

At press time, the BTC price was just below key resistance at $30,000.

Bitcoin price

Bitcoin Bearish Signal: Spot And Derivative Reserves Shoot Up

On-chain data shows the Bitcoin spot and derivative exchange reserves have both shot up recently, a sign that could be bearish for the price.

Bitcoin Spot And Derivative Reserves Register Growth

As pointed out by an analyst in a CryptoQuant post, the open interest and the funding rates are also heating up in the BTC market. The “exchange reserve” is an indicator that measures the total amount of Bitcoin that investors are depositing into wallets of centralized exchanges right now.

This metric has two versions; one is for the spot exchanges, while the other is for the derivative platforms. Usually, investors deposit to spot exchanges for selling purposes, so an increase in the reserves of these platforms can suggest selling pressure is rising in the market.

And as holders use derivative exchanges for opening positions on the futures market, a rise in this reserve can lead to higher volatility (the effect on the price can be in either direction).

Now, here is a chart that shows the trend in these Bitcoin exchange reserves over the last month:

Bitcoin Exchange Reserves

As displayed in the above graph, both the spot and derivative exchange reserves have increased in value recently, suggesting that investors have been making deposits to these platforms. The increased spot reserves suggest an elevated selling pressure in the market, while the derivative reserves imply an overheated futures sector.

The chart also includes data for two other metrics, the open interest, and the funding rates. The “open interest” is an indicator that measures the total amount of futures positions currently open on derivative exchanges. This metric takes into account both short and long contracts.

The graph shows that this metric has also trended up recently, further suggesting that the futures market is currently overheated. The other indicator, the “funding rates,” tells us whether there are more shorts or longs in the market.

The Bitcoin funding rates are favorable now, implying that the longs are overwhelming the shorts. Generally, whichever way this metric swing tells us which of these contract holders is more at risk of a liquidation squeeze.

So far, there hasn’t been any long squeeze in the market, but rather a short squeeze as the price has been able to keep up the momentum. There have been some high liquidations during the past day that may have helped calm the overheated futures market for now, but since there is increased selling pressure on the spot exchanges, BTC is still at risk for a short-term pullback.

BTC Price

At the time of writing, BTC is trading around $19,100, up 14% in the last week.

Bitcoin Price Chart

Brace For Impact? Bitcoin Open Interest RSI Forms Bearish Divergence

On-chain data shows the Bitcoin open interest RSI is currently forming a pattern that can lead to a short-term correction in the asset’s value.

Bitcoin Open Interest 14-Day RSI Has Been Climbing Up Recently

As pointed out by an analyst in a CryptoQuant post, a short-term bearish correction might soon take place for BTC. The “open interest” is an indicator that measures the total amount of Bitcoin futures contracts currently open on derivative exchanges. The metric takes into account both long and short contracts.

When the value of this metric goes up, it means investors are opening more contracts on derivative exchanges right now. Such a trend could result in higher volatility for the crypto’s price as it implies leverage is increasing in the market.

On the other hand, decreasing values suggest holders are getting liquidated or are closing down their futures contracts currently. Naturally, this could lead to a more stable price of BTC due to the lesser leverage.

Now, the relevant metric in the context of the current discussion isn’t the open interest itself, but its 14-day RSI. The Relative Strength Index (RSI) is a momentum oscillator that keeps track of the speed and direction of changes in any metric’s value over a specified period. The below chart shows the trend in the 14-day RSI of the Bitcoin open interest over the past year:

Bitcoin Open Interest RSI

As you can see in the above graph, the quant has highlighted the relevant regions of the trend for the Bitcoin open interest RSI (14). It would appear that whenever the RSI has risen while the BTC price has been moving sideways or downwards, a bearish divergence has formed for the crypto, and its price has undergone a correction.

There have been other instances of a rising open interest RSI in the past year, but all those were accompanied by a rise in the price itself (and not consolidation or decline) so the same pattern never applied to them. Recently, however, the metric has been once again surging, and this time the price has been moving sideways at the same time, which means the bearish divergence as those earlier instances is now forming.

If the trend from the previous occurrences indeed repeats this time as well, then Bitcoin could soon see another short-term correction in its price.

BTC Price

At the time of writing, Bitcoin’s price floats around $16,800, up 1% in the last week.

Bitcoin Price Chart

Calm Before The Storm? Bitcoin Volatility At Historically Low Levels

Data shows the Bitcoin 7-day volatility has plunged down recently to pretty low values. Here’s what has historically happened following instances of such a trend.

Bitcoin 7-Day Volatility Has Declined To Just 1.6% In The Past Week

According to the latest weekly report from Arcane Research, the recent sideways trend in the BTC price has lead to the volatility dropping down to very low values.

The “volatility” is an indicator that measures how the daily returns of Bitcoin have deviated from the average during a specific period.

Here is a chart that shows the trend in the 7-day and 30-day versions of the metric for BTC over the last year:

The 7-day value of the indicator seems to have gone down in recent days | Source: Arcane Research’s The Weekly Update – Week 39, 2022

As you can see in the above graph, the 7-day Bitcoin volatility has plummeted down over the past week or so.

The metric’s value is now only 1.6%, a very low level that has only been seen a few times during the last twelve months. The 30-day volatility, though, has still stayed up recently at about 3.4%.

The reason behind such low weekly values of the indicator is the sideways consolidation between the $19k and $20k levels that the crypto’s price has been stuck in lately.

Such low 7-day volatility values have usually been succeeded by significant surges in the metric, as noted by the report.

This happens because leverage easily builds up during these periods. High leverage markets are highly volatile since any sudden price moves can liquidate large amounts, which further amplifies the price change.

Since low volatility periods obviously don’t have any significant price spikes, leverage can go unflushed and thus pile up.

As the Bitcoin 7-day volatility has been very low recently, this kind of buildup is again expected to take place in the market. And indeed, the BTC-denominated perpetual futures open interest has shot up and is sitting at an all-time high right now, supporting the idea of the market being overleveraged:

Looks like the value of the metric has been climbing up recently | Source: Arcane Research’s The Weekly Update – Week 39, 2022
BTC Price

At the time of writing, Bitcoin’s price floats around $20.1k, up 3% in the last week. Over the past month, the crypto has gained 1% in value.

The below chart shows the trend in the price of the coin over the last five days.

The value of the crypto has been moving sideways since the surge a couple of days back | Source: BTCUSD on TradingView
Featured image from Kanchanara on Unsplash.com, charts from TradingView.com, Arcane Research

Bitcoin Open Interest, Funding Rates Point To Growing Bullish Sentiment

Bitcoin has seen fluctuating sentiment lately. With numerous dips and recoveries, it is no surprise that investors have had a hard time deciding on which side of the fence to sit on. However, while retail investors seem to be uncertain about the market, there has been some growth in both the funding rates and the open interest over the last week, showing that positive sentiment may be stabilizing.

Funding Rates Recover

Over the last couple of weeks, bitcoin funding rates have been consistently below neutral. This coincided with the times when the market was struggling, ushering in a new bear trend. But with the last week’s events, there has been a remarkable recovery in the funding rates.

Toward the end of last week, the funding rates had returned to neutral levels for the first time in one month. It followed the recovery in bitcoin’s price last Friday before it slid back down. The bitcoin funding rates have since lost their footing at the neutral territory but continue to maintain higher levels before the BTC recovery on Friday.

Funding rates return to neutral | Source: Arcane Research

What this shows is that there is still demand for both bitcoin longs and shorts. This means that while it does look to be swinging in the favor of the bulls due to the elevated levels, it is still an uncertain market. Additionally, last week’s recovery to neutral levels did not really change much about the current trend, as funding rates have now spent nine consecutive months at or below neutral levels.

Bitcoin Open Interest Say ‘Short Squeeze’

Despite the decline in the bitcoin price, the open interest has not had a hard time of it like the rest of the market. Instead, BTC-denominated open interest has hit multiple new all-time highs this year, leading to various short squeezes in the market.

Open interest continued to see favorable market conditions as it hit a new all-time high of 421,000 BTC last Wednesday. Even the short squeeze that was recorded on Friday did not do much to bring down the open interest, which remained elevated at 418,000 BTC at the start of this week. 

The depressed market sentiment suggests that this elevated trend is unlikely to continue for very long. Bitcoin’s price decline also points to this, given that the elevated open interest coincided with a period of price recovery. It also means that bears have been in control of the market for the period where the open interest has been high. Bitcoin’s fall below $20,000 is a testament that short traders continue to control the market. 

Featured image from PYMNTS, charts from Arcane Research and TradingView.com

Follow Best Owie on Twitter for market insights, updates, and the occasional funny tweet…

Old Bitcoin Supply Moves Into Derivatives, Whales Setting Up Long Positions?

On-chain data shows Bitcoin supply older than two years has moved into derivative exchanges recently, suggesting whales may be positioning themselves on the futures market.

Derivative Exchange Inflow Of Bitcoin Supply Older Than 2 Years Has Spiked Up

As pointed out by an analyst in a CryptoQuant post, the recent short-dominant open interest has gone down while some old coins have just been shifted into exchanges.

The relevant indicator here is the “derivative exchange inflow,” which measures the total amount of Bitcoin moving into wallets of all derivative exchanges.

A modified version of this metric, the “inflow spent output age bands,” tells us what the individual contribution has been from the various holder age groups to the total inflows.

The investor cohorts of interest here are those who have been holding onto their coins since at least 2 years without having sold or moved them (before now).

Looks like the value of the metric has spiked up over the past day | Source: CryptoQuant

As you can see in the above graph, the Bitcoin derivative exchange inflow from the 2 years+ old investor group has spiked up recently.

This shows that these BTC hodlers are moving significant amounts to exchanges for setting up positions in the derivatives market.

It’s unclear whether this transfer is with the intent of opening long positions, or if it’s for hedging spot positions using shorts.

However, the trend in another indicator, the open interest, may hold hints about the destination of these inflows. This metric measures the total amount of positions currently open on derivative exchanges.

Recently, the funding rates were slightly negative, implying that the open interest was short-dominant. But as the below chart highlights, this indicator’s value has gone down during the past day.

The value of the indicator seems to have slumped down after rising during the last few days | Source: CryptoQuant

The value of the Bitcoin open interest declining can suggest some of the short positions have now been closed down.

It now remains to be seen whether the market shifts towards a long-dominant environment or not in the coming days as exchanges receive fresh large inflows like the most recent one.

BTC Price

At the time of writing, Bitcoin’s price floats around $19.7k, down 2% in the last seven days. Over the past month, the crypto has lost 12% in value.

Below is a chart that shows the trend in the price of the coin over the last five days.

The value of BTC hasn’t showed much movement during the last few days | Source: BTCUSD on TradingView
Featured image from André François McKenzie on Unsplash.com, charts from TradingView.com, CryptoQuant.com

Bitcoin Open Interest Climbs Up, Price To Break Sideways Trend Soon?

On-chain data shows the Bitcoin open interest has been slowly growing recently, something that could lead to more volatility in the price of the crypto.

Bitcoin Open Interest Goes Up While Funding Rates Approach A Neutral Value

As pointed out by an analyst in a CryptoQuant post, the BTC open interest has gained around $500 million over the last few days.

The “open interest” is an indicator that measures the total amount of BTCUSD positions currently open on all derivatives exchanges. The metric takes into account for both short and long positions.

When the value of this indicator goes up, it means investors are opening up more positions on exchanges right now. Since this usually leads to a higher amount of leverage in the market, this kind of trend can make the price of Bitcoin more volatile.

On the other hand, the decline in the metric implies positions are closing up or liquidating on exchanges at the moment. Lower leverage usually leads to a more stable value of the crypto, and so such a trend can result in lesser volatility for BTC.

Now, here is a chart that shows the trend in the Bitcoin open interest over the last few days:

The value of the metric seems to have climbed up in recent days | Source: CryptoQuant

As you can see in the above graph, the Bitcoin open interest has observed an uplift during the past couple of days.

This increase amounted to around $500 million and took the indicator’s value from $8.15 billion to $8.66 billion.

The chart also includes data for the “funding rates,” a metric that tells us about the distribution of BTC positions between longs and shorts.

This indicator has most recently had a slightly negative value, which means the market is slightly leaning towards a short-dominant environment right now.

In times of high open interest (and hence high leverage), the market becomes more prone to seeing largescale liquidation events. Such liquidations are the reason behind the increased volatility of the market during such periods.

BTC has been mostly moving sideways during the last few days, but since the open interest has jumped up now, it’s possible the crypto could see fresh movement soon.

The funding rates can hint at which direction this new price volatility may favor, but since the metric’s value is almost neutral currently, it’s hard to say anything.

At the time of writing, Bitcoin’s price floats around $19.7k, down 1% in the past week.

BTC has continued to consolidate sideways during the past week or so | Source: BTCUSD on TradingView
Featured image from Kanchanara on Unsplash.com, charts from TradingView.com, CryptoQuant.com

Bitcoin Marks 9th Consecutive Month Of Sluggish Funding Rates

Bitcoin funding rates for the past two months have entered one of their worst streaks yet. During this time, there have been no positive funding rates, and the best that the market has seen has been funding rates at a neutral level. However, even now, reaching neutral levels have proved incredibly hard for funding rates, taking a deeper dive with each passing week.

Funding Rates Remain Below Neutral

The last time bitcoin funding rates had been in the neutral territory had been at the beginning of August. Since then, funding rates have consistently returned below neutral, with some short-term lows being recorded along the way. Funding rates on crypto exchange Binance have actually dropped to 2-month lows at this point. Additionally, the crypto exchange has now hit nine months of funding rates at or below neutral levels.

This puts the perpetual swaps at a continuously lower rate compared to spot market prices. Bitcoin traders have since been reducing their risk exposure to the digital asset, and this has come as a culmination of such wariness.

Funding rates remain below neutral | Source: Arcane Research

It is the most bearish that the market has been since the bull market was triggered in 2020. This even comes despite the fact that bitcoin open interest has been seeing higher levels. On Tuesday, the bitcoin funding rates sat at around 0.00% and had touched a 2-month low earlier in the week.

Bitcoin Open Interest Grows

Bitcoin open interest has maintained a consistent growth rate despite the funding rates taking a nosedive at each possible point. Each week has seen open interest either hit a new all-time high or come close to reaching it. The former was the case last week.

BTC trading below $20,000 | Source: BTCUSD on TradingView.com

This time around, open interest had a brand new all-time high of 398,075 BTC on August 29th. This is more than 2% of the total BTC circulating supply. It is up significantly from its lowest point last year of 186,158 BTC, representing a more than 110% growth in this time.

With the open interest so high and funding rates so low, it leaves room for the possibility of a short squeeze. This unusual market has not been ignored by investors, leading them to take up more conservative positions.

Bitcoin’s price has also not been encouraging. After hitting a new local high of $25,000 about a week ago, the digital asset is now struggling to hold above $20,000.

Featured image from RushRadar, charts from Arcane Research and TradingView.com

Follow Best Owie on Twitter for market insights, updates, and the occasional funny tweet…

Ethereum Options Surpass Bitcoin Ahead Of Upcoming Merge

Ethereum has been outperforming bitcoin for a while now. The altcoin had managed to grow so rapidly that it is now about half the market cap of bitcoin despite being more than 5 years younger. This outperformance had continued through the bull market and now even into the bear market. Ethereum has taken one step further to overtake bitcoin in yet another metric, and that is the amount of open interest in the asset.

Open Interest Flips Bitcoin

New data from Glassnode has shown an interesting development when it comes to the open interest in both Bitcoin and Ethereum options. Bitcoin had naturally dominated this metric due to not only being the first cryptocurrency in the market but also the digital asset with the most interest from investors, both retail and institutional investors.

Ethereum had quickly surpassed bitcoin in this regard as its open interest had surged to $5.6 billion across all Put and Call options, accounting for more than a 47% increase in the last month. ETH’s popularity during this time and price recovery has obviously helped in its domination.

Bitcoin, on the other hand, continues to trend around normal levels with $4.3 billion in open interest. This puts Ethereum ahead more than 30. With also more than $2.6 billion in Call options and a Put/Call Ratio of 0.26, Ethereum investors are showing their hand and it is very bullish.

Ethereum Merge Drives Interest

The major culprit behind the recovery in the price of ETH had been the upcoming Merge. After a stretch of uncertainty regarding whether the upgrade would happen or would be postponed yet again, Ethereum developers had moved forward to provide an estimated date for the Merge.

ETH price falls below $1,600 | Source: ETHUSD on TradingView.com

With the September 19th date announced, investors had begun to ramp up their holdings ahead of the Merge. With the new month, the Merge draws closer, and positive sentiment around the digital asset has grown. Given that it is arguably one of the biggest updates in the history of crypto, the positive sentiment from investors is understandable.

The Merge is also behind the growth of Ethereum’s open interest. The bullish sentiment is in response to the upgrade finally happening next month. However, it is important to note that the Merge would see all staked ETH become free to withdraw. This will lead to an influx of ETH supply into the market, likely tanking the price. By that point, it’ll not be important how bullish the sentiment is but if there is enough demand to soak up this new supply.

This raises the question of whether this would be another “buy the rumor, sell the news” event. One thing is for sure, if it goes the way of Cardano with the Alonzo hard fork, ETH users should brace for a stretch of bear market prices. 

Featured image from Coingape, chart from TradingView.com

Follow Best Owie on Twitter for market insights, updates, and the occasional funny tweet…

Elevated Bitcoin Open Interest Levels Puts Market In Vulnerable Position

Bitcoin has recovered above $23,000 multiple times now, but the digital asset remains in a perilous position. This is because the recovery alone has not been able to assure that the bull trend would endure. Rather, it has been falling the brief buying and selling pressures that have been plaguing investors in recent times. The bitcoin open interest also mirrors this fact and shows just how easy it would be for bitcoin to lose its position.

Bitcoin Open Interest Stays Elevated

For the past week, the bitcoin open interest has been on the rise. After hitting above 300k the previous week, there was no stopping this part of the market. However, it also pointed to more peculiarities about the current bitcoin uptrend.

Related Reading | Why Cardano (ADA) May Breakout In A Bull Run To $1

For one, the elevated bitcoin-denominated open interest shows that there is very high leverage in the crypto market. As with any market, having such high leverage always puts the value of the digital asset in a perilous position. It could swing either way resulting in a short squeeze or a long squeeze. Whatever the case may end up being, the results are often the same; there are significant price swings that would go in either direction.

BTC recovers above $23,000 | Source: BTCUSD on TradingView.com

With the current movement of bitcoin, it is more likely that a long squeeze would be the end of it. This would likely see the price drop back down and touch $20,000. But if the off chance that it does end in a short squeeze, then bitcoin’s price could very well revisit $25,000.

Funding Rates Fall

Last week, the market had seen some much-needed bullish sentiment on the part of perpetual traders when the funding rates had recovered to neutral levels. Given that the funding rates had spent weeks swinging below neutral, this was a welcome change, however briefly.

It would seem the positive recovery would only last a single week as bitcoin funding rates have begun to swing back into the negative. It shows a straight decline down from neutral, indicating that traders were returning to more careful trades.

Funding rates fall below neutral | Source: Arcane Research

Interestingly, though, is the fact that despite the decline in the funding rates, they still continue to maintain higher lows. It shows better prospects compared to the month of June, which was characterized by funding rates remaining perpetually below neutral.

Related Reading | Bullish Sentiment Spills Over To Institutional Investors As Ethereum Inflows Balloons

What this shows is that although bitcoin traders are being more careful, they have not entirely written off the digital asset. This improvement in market sentiment has shone through in bitcoin’s recent recovery. However, for this to continue, funding rates would need a reversal from here.

Featured image from GoBankingRates, charts from Arcane Research and TradingView.com

Follow Best Owie on Twitter for market insights, updates, and the occasional funny tweet…

Bitcoin Funding Rate Turns Highly Positive, Long Squeeze In The Making?

Data shows the Bitcoin funding rate has increased to a relatively high positive value recently, something that could lead to a long squeeze in the market.

Bitcoin Funding Rate Becomes Positive As Open Interest Rises Up

As pointed out by an analyst in a CryptoQuant post, the BTC funding rate has a positive value at the moment.

The “open interest” is an indicator that measures the total amount of positions currently open in the Bitcoin futures market.

When the value of this metric is high, it means there is a large amount of leverage involved in the market right now. Excess leverage usually leads to the crypto’s price turning more volatile.

Related Reading | When Will The Extended Stretch Of Extreme Fear In Crypto End?

On the other hand, low values of the open interest can result in lesser volatility in the BTC market as there isn’t much leverage involved in the futures market.

Now, here is a chart that shows the trend in the open interest over the past week:

Looks like the metric’s value has increased recently | Source: CryptoQuant

As you can see in the above graph, the Bitcoin open interest has observed a rise in recent days. This could mean that the crypto may face higher volatility in the coming days.

Another indicator, the “funding rate,” measures the periodic fee that traders on derivatives exchanges pay each other to hold onto their positions. This metric tells us how the open interest is divided between the long and short traders at the moment.

Related Reading | Bitcoin Manage To Hold Its Own As Wall Street Open With Losses, Analysts Weigh In On Bottom

The below chart shows how this indicator’s value has changed during the past seven days.

The value of the indicator seems to have been green recently | Source: CryptoQuant

From the graph, it’s apparent that the Bitcoin funding rate has a relatively high positive value currently. This means that there are a higher number of longs present in the market right now.

Since long traders are paying a premium to keep their positions (which is why the rate is positive), the overall market sentiment is leaning towards bullish.

However, with the high open interest values, it’s possible that any large swing in the price can cause what’s called a “long squeeze,” which is an event where mass liquidations of long positions cascade together and push the price further down.

BTC Price

At the time of writing, Bitcoin’s price floats around $20.9k, down 2% in the last week. Over the past month, the crypto has lost 5% in value.

The price of BTC has climbed up over the past couple of days | Source: BTCUSD on TradingView
Featured image from Aleksi Räisä on Unsplash.com, charts from TradingView.com, CryptoQuant.com

Bitcoin Funding Rates Remain Negative But Open Interest Tells Another Story

Bitcoin funding rates have been dropping over the last couple of weeks. Even as the price of the digital asset had plummeted, causing some to call it being on ‘discount’, these funding rates have refused to move out of the negative territory. The past week has proven to be no different given that funding rates have exited the neutral territory entirely and remain low.

Funding Rates Refuse To Budge

Coming out of the last week has been a hard one for the crypto market. The bloodbath had sent the majority of the coins in the crypto market into the red and bitcoin had touched the $20,000 level for the first time since December 2020. Through this has come panic across investors and the funding rates have reflected this panic.

Related Reading | Exchange Inflows Ramp Up As Crypto Investors Clamor To Exit Market

The past week had come to a close with funding rates sitting well below neutral. This follows the trend for the 7-day period where the funding rate had trended below neutral each day. It sat at 0.013% as of Tuesday. Not the lowest point so far but it marked the second-lowest point for the month of June.

This decline in funding rates follows what Arcane Research refers to as an orderly sell-off in the derivatives markets. It is no surprise given the liquidation volumes that rocked the market on Monday and Tuesday, touching above $1 billion in a 24-hour period and setting a new daily liquidation event record.

Funding rates remain low | Source: Arcane Research

The research and analysis firm also notes that investors are approaching the market with caution. This is due to the “current market structure with increased contagion risks related to Celsius and the pressuring macro backdrop.” This caution comes as no surprise given that investor sentiment now resides in extreme fear, meaning there is no room for careless abandon in a market such as this.

Bitcoin Open Interest Turns The Other Way

Even with the funding rates low, other metrics are surprisingly not doing as bad. One of these is the bitcoin’s open interest in the perpetual markets. This metric remains high even though the price of bitcoin has plummeted close to 2017 highs.

Historically, BTC-denominated open interest has been known to decline in line with the market. This has not been the case with the most recent bitcoin crash. Instead of falling, open interest had hit multiple new all-time highs even as the sell-offs had continued. This suggests that some investors had believed that the bottom was in and tried to take advantage of it. But this was not the case.

Open interest on the rise | Source: Arcane Research

Nevertheless, open interest in perpetuals was at 298,500 BTC as of Tuesday. It is in stark contrast to the last major market crash that took place back in December, where open interest in perps had declined to 190,000 BTC as the price of the digital asset had fallen.

Related Reading | Bitcoin Crash Sends Institutional Investors Running For The Hills

This increase in open interest suggests that if the bitcoin bottom is not in already, then it may very well be reached soon. Although it is important to keep in mind that a metric like this on its own cannot give a full picture of when the bitcoin bottom will be reached.

BTC drops to $21,000 | Source: BTCUSD on TradingView.com
Featured image from Arabian Business, charts from Arcane Reseach and TradingView.com

Follow Best Owie on Twitter for market insights, updates, and the occasional funny tweet…