Bitcoin Could Crash Below $55,000, Top Analyst Sounds The Alarm

Bitcoin, the leading cryptocurrency, has recently been scrutinized by several analysts and traders as it struggles to maintain its market position.

Michaël van de Poppe, a recognized figure in the crypto analysis sector, has recently expressed his concerns regarding Bitcoin’s current price trajectory.

Bitcoin Risks Dropping to $52,000, Why?

Taking to Elon Musk’s social media platform X, Van de Poppe pointed out that Bitcoin is at the lower end of its current range, a crucial area for maintaining upward momentum.

Van de Poppe warned that if Bitcoin fails to hold this level, the market could see a downturn, with prices potentially falling as low as $52,000 to $55,000.

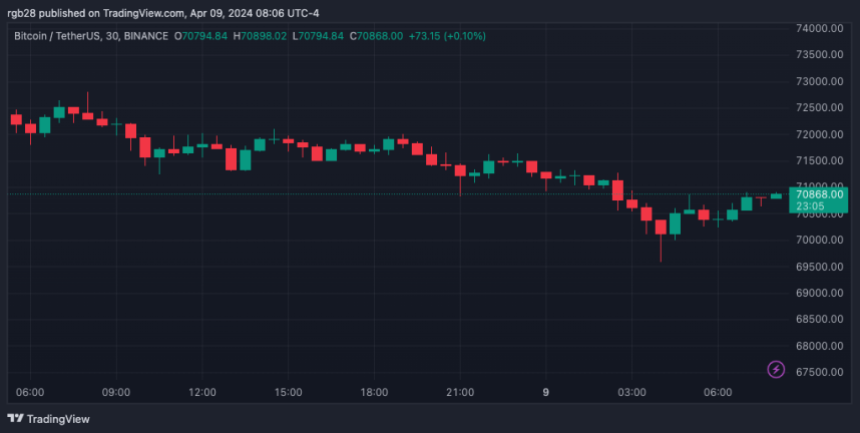
This prediction comes as Bitcoin attempts to stabilize above the $61,000 mark. Despite efforts to sustain this level, recent market behavior suggests a bearish trend could be looming.

Bitcoin (BTC)price chart on TradingView

Van de Poppe’s analysis indicates that failing to maintain the lower range could lead to significant corrections, affecting investor sentiment and market dynamics.

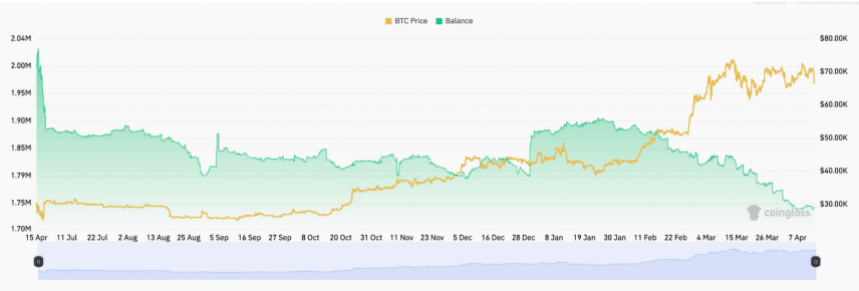
Meanwhile, recent data from the analytics firm IntoTheBlock reveals a noticeable decline in BTC whale accumulation volumes over the past month. These large investors, holding over 1,000 BTC, have been a stabilizing force in the market, particularly during price dips.

However, the trend of diminishing whale purchases, especially during recent market corrections, suggests a decrease in their market influence and potentially a broader loss of appetite for Bitcoin at current levels.

This pattern could indicate a shift in whale strategy or a broader market sentiment change, possibly leading to less support for Bitcoin prices during downturns.

BTC Surging Demand vs. Limited Supply

Despite the potential price dip, other market activities suggest a robust demand for Bitcoin. Samson Mow, a well-known Bitcoin community figure and former Blockstream CSO, highlighted the continuous buying from American spot Bitcoin ETFs.

According to Mow, these US ETFs purchase 1,626 BTC daily. Additionally, MicroStrategy acquires 199 BTC daily, and Tether buys 70 BTC daily.

This significant daily demand, especially in the context of the reduced supply following the latest Bitcoin halving in April, where only 450 BTC are created each day, suggests that demand might significantly exceed supply.

Mow emphasized this imbalance, indicating that the aggregate demand could be outstripping the available supply by 5 to 10 times, hinting at a potential upward pressure on prices if this demand persists.

Featured image from Unsplash, Chart from TradingView

Bitcoin’s Make-Or-Break Moment: Trading Guru Predicts Rally Amid Market Uncertainty

Seasoned trader Peter Brandt has reignited discussions with a bullish Bitcoin forecast that could see the premier cryptocurrency soar to new heights.

Amid skepticism and divergent market opinions, Brandt’s projection places Bitcoin on a potential path to reclaim its all-time high near $74,000.

Brandt’s Bullish Bitcoin Vision

Peter Brandt, synonymous with market foresight, recently outlined a scenario where Bitcoin could experience a significant rally.

His analysis, shared via a social media post on X with a BTC analyzed chart, suggests Bitcoin’s recent price movements align with patterns historically indicative of a bull market’s continuation.

Despite the market’s recent downturns, Brandt’s projection points towards a potential surge to $74,000, a figure mirroring Bitcoin’s peak valuation.

While Brandt’s optimistic outlook for Bitcoin has garnered attention, it also faces scrutiny from parts of the crypto community. Critics point to his past predictions, including significant downturns and peak valuations, as a reason for caution.

In response, Brandt emphasizes the critical role of adaptability in trading, noting:

I can tell you know that you will end up losing all your capital. I’ve supported myself by trading for 50 years and know that successful traders have and execute the ability to be flexible. I’ll welcome your money.

Split On Market Forecast

Meanwhile, the broader crypto analyst community remains divided. Some echo Brandt’s sentiments, seeing the market’s current state as a temporary correction before a bullish reversal.

Others, like analyst Scott Melker, suggest more bearish outcomes. They note the absence of key support levels that could lead to further declines if not held. Melker’s analysis indicates that, without these supports, Bitcoin could freefall to as low as $52,000.

Further complicating the landscape are indicators like the Relative Strength Index (RSI), which Melker points out has not reached oversold levels — typically a sign of a potential rebound.

This absence suggests a tepid confidence among investors, potentially paving the way for further price drops.

Despite the debates and technical analyses, the sentiment among some traders remains buoyantly optimistic. Traders like Marco Johanning argue that the structural market dynamics still favor a bull market scenario. This suggests that Bitcoin’s current price adjustments are part of a broader upward trend that will resume soon.

Bitcoin (BTC) price chart on TradingView

Featured image from Unsplash, Chart from TradingView

Bitcoin Hits ‘Danger Zone’: Peter Schiff Warns Of ‘Do or Die’ Scenario

Bitcoin is facing a critical juncture as it has entered a ‘danger zone,’ according to prominent gold advocate Peter Schiff. This investor, known for his skepticism toward Bitcoin, suggests that the cryptocurrency is entering a “do or die” phase, potentially marking the end of its bullish run if current trends continue.

Breaking Points And Bearish Signals

Peter Schiff has often voiced his bearish outlook on Bitcoin, and his latest comments come as Bitcoin has just slipped below the crucial $60,000 mark.

This level had previously served as strong support during the short-term bull run, and its breach has intensified the bearish sentiment among investors. Schiff warns that staying below this threshold could spell doom for the bullish fervor, potentially derailing Bitcoin’s momentum.

At the time of writing, Bitcoin is trading at approximately $57,054, teetering close to its 100-day Exponential Moving Average (EMA). Schiff points out that remaining below this EMA could confirm a bearish trend, signaling an end to the rally.

Amidst these developments, the market has seen an increase in trading volume, coupled with the price drop, indicating strong selling pressure.

Over the last 24 hours, Bitcoin’s trading volume has dropped from $45 billion to $48 billion, coinciding with a 6.3% price dip during the same period. This heightened activity is a traditional bearish indicator, lending weight to Schiff’s prediction of a downturn.

Moreover, investor sentiment is treading thin ice with significant outflows from Bitcoin spot ETFs, hitting a weekly high of $162 million. This departure of funds is particularly poignant as it unfolds just before the FOMC meeting, where potential interest rate hikes are on the agenda.

These outflows reflect a broader market trend, with the Grayscale Bitcoin Trust (GBTC) experiencing a substantial daily outflow of $93.23 million.

The Bitcoin ETF Conundrum And Market Forecasts

It is worth noting that last month was quite challenging for US Bitcoin ETFs. After a promising start with positive inflows in the initial months following their launch, April witnessed collective outflows amounting to $182 million across all active spot Bitcoin ETFs in the US.

This pullback is attributed to macroeconomic concerns and geopolitical tensions, which have clouded the investment landscape.

Bitcoin (BTC) price chart on TradingView

As the market braces for further turbulence, analysts such as Micheal Van de Poppe are forecasting an additional correction, potentially pushing Bitcoin’s price down to $55,000 before any sign of recovery.

Featured image from Unsplash, Chart from TradingView

Bitcoin Bottom Out? Analyst Signal Turnaround Amid Market Slump

Bitcoin has recently concluded April, marking its most significant monthly decline. Despite the bearish momentum, leading market analysts, including Michael van de Poppe, believe that the worst may soon be over, suggesting that Bitcoin is nearing the end of its current correction phase.

Bitcoin At The End Of Correction?

April was challenging for Bitcoin, as its value plunged nearly 20%, dipping below $57,000, the lowest level traded since late February.

This drop is part of an intense market sell-off that has slashed the combined cryptocurrency market cap by nearly 10%, bringing it down to $2.2 trillion. Amid these declines, Michael van de Poppe, a revered figure in the crypto analysis space, provided hope.

In his recent statements on the social platform X, Van de Poppe suggested that Bitcoin’s current price levels might be nearing the bottom of this correction cycle.

Bitcoin (BTC) price chart on TradingView

He highlighted the critical price range of $56,000 to $58,000 as pivotal for Bitcoin’s short-term trajectory, indicating potential areas for a rebound.

A Closer Look At Predictions And Market Sentiments

Van de Poppe isn’t alone in his optimistic outlook. Other analysts, like Checkmate, an on-chain expert, have analyzed Bitcoin’s historical data to predict future movements.

Checkmate introduced the term “chopsolidation,” describing it as a phase of stagnant yet volatile market conditions that could precede a significant bullish run.

He expects this phase to last about six months, followed by a potential 6 to 12 months of explosive growth reminiscent of past cycles. Furthermore, historical data from Bitcoin’s Halving years support the theory that after a halving event, the market tends to perform strongly towards the end of the year.

However, there are not all optimistic forecasts in the crypto realm. The spot Bitcoin ETF market witnessed over $300 million in net outflows in April, breaking a three-month streak of inflows, reflecting a broader sentiment of caution among investors.

Moreover, Charles Edwards, founder of Capriole Investments, has voiced concerns over the market’s extraordinary bullishness, warning of the necessity for corrections within such a volatile asset class.

Featured image from Unsplash, Chart from TradingView

This Bitcoin Metric Foreshadowed Recent Price Drops, Quant Reveals

A quant has pointed out how a Bitcoin metric may have detected selling pressure in the market, and therefore, the subsequent price drops, in advance.

Bitcoin CDD Registered Spikes Before Recent Price Plunges

In a new post on X, an analyst has discussed about how the Coin Days Destroyed (CDD) on-chain indicator may be used to identify selling pressure in the market early.

A “coin day” refers to the quantity that 1 BTC accumulates after staying still on the blockchain for 1 day. When a token stays dormant for a while, it naturally accumulates some number of coin days, and once it’s finally transferred on the network, its coin days counter resets back to zero.

The coin days that this token had been carrying prior to this movement are said to be “destroyed” by the transaction. The CDD keeps track of the total number of such days being reset across the network on any given day.

Now, here is a chart that shows the trend in the CDD for Bitcoin over the last couple of months:

Bitcoin CDD

As displayed in the above graph, the Bitcoin CDD observed a large spike just a few days ago. Whenever this metric’s value shoots up, it means that a large amount of coins previously dormant are now on the move.

Such transfers are generally correlated with the long-term holder whales, who are large entities who carry their coins for significant periods, and thus, accumulate a large number of coin days.

Often, when these dormant entities finally break their silence, it’s for selling-related purposes. As such, spikes in the CDD can be an indication that the HODLer whales have decided to do some selling.

In the chart, the quant has highlighted the major spikes that the indicator observed during the last two months. It would appear that following the onset of such spikes, the asset’s price has generally gone on to witness some bearish action.

The aforementioned spike from a few days ago, too, has proven to be bearish for the asset so far as it occurred when Bitcoin had recovered towards $67,000, and the price has since erased this recovery. It would appear that some of these diamond hands had looked at this surge as an exit opportunity.

Last month, the CDD had seen two spikes even larger than this recent one. These spikes had occurred near what continues to be the top for the rally so far. Thus, the selling pressure from HODLers may have played a role in this top and the subsequent drawdown that followed.

Given the relationship that this metric has appeared to have held with the Bitcoin price, it may be worth keeping an eye on it, as it may continue to indicate the onset of selling pressure in the near future as well.

BTC Price

Bitcoin has continued its bearish trajectory during the past day as it has now slipped towards the $62,300 level.

Bitcoin Price Chart

Expert Makes Bold Call: It’s Time To Swap Your Dollars For Bitcoin

Billionaire investor Anthony Scaramucci, the founder of SkyBridge Capital, recently discussed the viability of financial assets. He took to X, a social media platform previously known as Twitter and owned by Elon Musk, to highlight the decreasing purchasing power of the United States dollar in comparison to the potential of Bitcoin (BTC).

US Dollar Vs. Bitcoin Value Performance

In the post on X, the SkyBridge Capital founder pointed out that a dollar from 2020 is now only worth about 75 cents, underscoring a significant devaluation due to inflation.

According to Scaramucci, this scenario illustrates why investors should reconsider traditional fiat currencies as a reliable store of value, advocating instead for the inherent benefits of digital assets like Bitcoin.

Scaramucci’s critique comes at a time when the global economy grapples with heightened inflation rates, which have eroded the real value of fiat money.

He specifically cited a “25.14% compounded inflation rate” as a critical indicator of why the dollar is losing ground. In contrast, Bitcoin has not only maintained a strong profile but has also appreciated in value, further cementing its position as a viable hedge against inflation and a potential safe haven for investors.

So far, Bitcoin’s market performance has been quite appealing. Particularly, despite the significant downturn experienced in the past few years, the asset has managed to come out of the bloodbath and recently soared to an all-time high above $73,000 in March.

This peak performance labels Bitcoin as not just a digital asset but a major player in the global financial landscape.

However, despite Scaramucci’s bullish outlook, it’s worth noting that Bitcoin has seen its share of volatility. It has been struggling to maintain its appeal recently, with a modest 0.9% increase in the last 24 hours – a slight recovery from a 2% drop over the past week.

Bitcoin (BTC) price chart on TradingView

BTC Shifting Market Sentiments

Further insights into the market’s behavior towards Bitcoin reveal changing dynamics. Data from CryptoQuant highlighted a negative turn in the Bitcoin funding rate for the first time since October 2023, indicating a cooling interest in speculative trading on the asset.

This shift suggests that while the long-term outlook might still be strong, short-term investor sentiment has become cautious, possibly awaiting clearer signals before making further commitments.

The current market sentiment is also reflected in the technical analysis of a prominent crypto analyst, Ali. In Ali’s recent post on X, a notable mention was made of a “death cross” seen in Bitcoin’s 12-hour chart, where the short-term moving average dips below a long-term counterpart, traditionally a bearish signal.

Additionally, the Tom Demark (TD) Sequential indicator points to potential price reversals after a consistent trend, adding another layer of complexity to Bitcoin’s trading strategy.

Despite these potentially bearish indicators, on-chain data from Santiment shows an interesting trend: Bitcoin whales have increased their holdings significantly, now owning 25.16% of the total supply.

This accumulation suggests that while retail sentiment may be bearish, large-scale investors are seeing the dips as buying opportunities, potentially prepping for a future bullish run.

Featured image from Unsplash, Chart from TradingView

Is A $72K Bitcoin Surge On The Horizon? Glassnode’s Latest Analysis Points To An Answer

Recent insights from Glassnode’s cofounders, shared under their X (formerly Twitter) account ‘Negentrophic’ have sparked interest in Bitcoin market dynamics, leading to a promising stabilization and possible price surge.

Market Sentiments And EMA Trends

With Bitcoin’s value recently wavering below the $70,000 mark, a detailed analysis from the cofounders suggests that a strong support level around the $62,000 50-day Exponential Moving Average (EMA) could set the stage for a significant rebound.

This crucial support level indicates a strong buying sentiment, indicating the market’s confidence in the cryptocurrency’s value and a potential resistance against further declines.

Using the strategic placement of the 50-day EMA as a support point, the analysis suggests that investors might see the current price levels as a solid base, preventing significant downward movements.

This perspective is reinforced by recent price movements, where despite a pre-halving general dip, Bitcoin has experienced a 7.1% increase in value over the past week, and the same uptick continued in the last 24 hours.

Bitcoin (BTC) price chart on TradingView

Further analysis by the Glassnode cofounders delves into the behavior of EMAs over different durations. Short-term EMAs indicate a growing inclination among investors to buy, while longer-term EMAs lean towards selling.

This contrasting behavior between short and long-term EMAs sheds light on the current phase of the market, which seems to be in a period of consolidation after the notable 92% increase in Bitcoin’s price over six weeks earlier in the year.

Such insights are vital as they offer a deeper understanding of the underlying market forces and investor behavior during volatile periods.

Meanwhile, Glassnode’s team’s analytical approach extends beyond simple price movements. Yesterday, they compared the current market conditions to the early 2021 “strong correction,” which they term “wave 4” of the ongoing market cycle.

This historical perspective provides a lens through which current trends can be evaluated, suggesting a cyclic return to bullish conditions reminiscent of past market behaviors.

Bitcoin Bullish Projections And Market Dynamics

Bitfinex analysts have highlighted significant activities around Bitcoin withdrawals, supporting the optimistic outlook on Bitcoin. The current levels, echo those of January 2023, suggest that investors are increasingly moving their Bitcoin to cold storage—a sign that many anticipate further price increases.

Veering back to Glassnode’s projections yesterday based on their indexes and Fibonacci levels, the cofounders were boldly optimistic, anticipating a potential 350% increase from current market levels.

Notably, this forecast highlights the expected financial trajectory and underscores a growing confidence among experts and market analysts in Bitcoin’s market performance and its foundational economic principles.

Featured image from Unsplash, Chart from TradingView

Samson Mow On Bitcoin Halving: Brace For Supply Shock, Omega Candle In Sight

Samson Mow, the chief executive at Jan3, recently spoke to Forbes about the latest Bitcoin halving and its potential to catalyze what he refers to as the “Omega candles” – significant price movements that could elevate Bitcoin to the $1 million mark.

According to Mow, halvings ensure a controlled distribution of Bitcoin, maintaining scarcity and value.

The Mechanics Of Halving And Its Market Implications

Samson Mow detailed in the interview with Forbes the mechanics behind Bitcoin halvings—a critical process built into Bitcoin’s framework by its creator, Satoshi Nakamoto.

This mechanism is designed to halve the block rewards given to miners every 210,000 blocks, or approximately every four years, reducing the reward by 50%.

So far, the most recent halving has reduced the reward for mining from 6.25 BTC to 3.125 BTC per mined block. However, initially, miners received 50 BTC per block.

Still, due to the halvings, this amount has decreased over time to manage inflation and extend the mining lifecycle of Bitcoin’s capped supply of 21 million coins. If not for these halvings, the total supply of Bitcoin would have already been mined.

In the same discussion, Mow highlighted the significant impact of newly approved spot-based Bitcoin ETFs, which received SEC approval earlier this year. He believes these ETFs, combined with the reduced block rewards from the halving, could precipitate a “supply shock” in the BTC market.

Mow further speculated on the occurrence of what he calls “Omega candles”—large price movement events in the Bitcoin market.

He noted that even before the recent halving, the daily demand for Bitcoin was significantly outstripping supply, predicting these Omega candles as almost certain events due to their high volatility and substantial price changes.

Mow views these developments as marking the beginning of a new era for Bitcoin, coinciding with its next, or fifth, halving in the coming four years.

Bitcoin Bright Future And Market Performance

Regarding positive sentiment on Bitcoin, Geoff Kendrick of Standard Chartered also supports this bullish outlook, projecting substantial inflows into BTC akin to those experienced by gold with the advent of gold ETFs.

Kendrick suggests that the maturation of the spot ETF market could channel between $50 and $100 billion into BTC.

However, despite the post-halving price not reaching the anticipated heights, BTC has demonstrated resilience and potential for considerable growth. Meanwhile, analysts remain confident, predicting significant long-term value increases.

For instance, Michael Sullivan’s analysis suggests a possible reach of $245,000 by 2029 if BTC maintains a 30% compound annual growth rate, underlining the optimistic projections shared by several market experts.

This optimism is further supported by recent trends, including a 7.1% increase in Bitcoin’s price over the last week, which indicates a possible recovery on the horizon.

Bitcoin (BTC) price chart on TradingView

Featured image from Unsplash, Chart from TradingView

Analyst Reveals Bitcoin’s Bull Market Breakthrough: Here’s What You Need To Know

In a recent tweet, well-known crypto analyst Rekt Capital delved into the potential timeline for the next Bitcoin market peak, emphasizing the Halving cycle’s significant impact on building BTC’s market path.

As the Bitcoin Halving is set to occur between today and tomorrow, April 20, Bitcoin has shown less significant market movement. At the time of writing, the asset has a market price of $64,578.

Analyst: ‘When Could Bitcoin Peak In This Bull Market?’

According to Rekt Capital’s analysis, Bitcoin typically reaches its bull market peak between 518 and 546 days following a Halving event. Applying this historical timeline, the next anticipated bull market peak could fall between mid-September and mid-October 2025.

Bitcoin chart shared by RektCapital on X

However, as disclosed by Rekt Capital, recent market trends suggest a possible acceleration in Bitcoin’s ongoing cycle compared to historical patterns, demonstrated by the cryptocurrency achieving new record levels approximately 260 days ahead of the typical schedule.

Despite this apparent acceleration, Rekt Capital noted:

Bitcoin has been experiencing a Pre-Halving Retrace for the past month or so As a result, Bitcoin has been slowing down and decelerating the cycle by 30 days thus far and counting So while Bitcoin may have been accelerating by ~260 days last month… Today this acceleration is now more close to ~230 days due to the current Pre-Halving Retrace.

Additionally, Rekt Capital introduced an alternative viewpoint termed the “Accelerated Perspective,” which factors in the duration from when Bitcoin exceeds its previous peak to the projected culmination of the bull market.

Given Bitcoin’s recent attainment of new all-time highs in March, this perspective implies that the subsequent bull market peak could happen between December 2024 and February 2025.

BTC Price Dynamics Amidst Market Fluctuations

Meanwhile, amidst recent market fluctuations, BTC is undergoing a slight recovery. At the time of writing, it had increased marginally by 1.4%, bringing its market price to above $64,000. This recovery follows a week-long decline during which Bitcoin experienced nearly a 10% downturn.

Bitcoin (BTC) price chart on TradingView

In light of these developments, crypto expert Michaël van de Poppe has shared insights into the potential implications of the impending BTC Halving event. Van de Poppe suggests a shift in focus away from Bitcoin once the halving occurs, speculating on potential changes in market narratives.

While he did not specify the exact narrative shift, Van de Poppe previously outlined expectations for the crypto market, including an anticipated emphasis on Ethereum (ETH) and projects focused on Decentralized Physical Infrastructure Networks (DePIN) and Real World Assets (RWA) post-Halving.

Featured image from Unsplash, Chart from TradingView

Bitcoin’s Next Move Revealed: Trading Guru Reveals This Cryptic Chart Pattern, Here’s What It Says

Legendary trader Peter Brandt has recently shared notable insights into the potential future trajectory of Bitcoin price, suggesting the possibility of a significant market move for the crypto asset.

This insight comes as Bitcoin appears to be recovering slightly from its week-long decline. The asset is up nearly 5% over the past 24 hours, with a current trading price of $64,968 at the time of writing.

Bitcoin Next Move According To This Chart Pattern

Brandt’s analysis, presented through a series of charts, outlines a distinctive pattern in Bitcoin’s historical price behavior, characterized by three distinct phases.: the Hump-Slump, Bump-Rump, and Pump-Dump cycles.

As per Brandt’s observation, while Bitcoin has completed the initial two phases of the cycle, the third phase, marked by the “pump” component, remains unfulfilled, hinting at potential bullish momentum ahead.

Meanwhile, amid heightened market volatility and uncertainty, Bitcoin has faced notable price fluctuations, experiencing a nearly 10% decline over the past week.

However, recent bullish momentum has seen the cryptocurrency surging by 3.7% in the past 24 hours, with its price briefly climbing above $65,000 after hitting a 24-hour low of $60,000.

Bitcoin (BTC) price chart on TradingView

This upward movement aligns with Brandt’s suggestion of a pending bullish phase in Bitcoin’s price cycle, adding weight to the anticipation of a potential market “pump.”

Insights From Industry Leaders And Analysts

In addition to Brandt’s analysis, industry leaders and analysts have offered their perspectives on Bitcoin’s future trajectory.

Anthony Scaramucci, founder and managing partner of Skybridge Capital, has recently projected a bullish outlook for Bitcoin, forecasting a potential price surge to $200,000 following the upcoming halving event.

Scaramucci cited various factors, including the influence of new financial products like spot ETFs and increasing institutional interest, as key drivers behind Bitcoin’s anticipated price appreciation.

However, amidst optimistic forecasts, CryptoQuant, a prominent crypto analytics platform, has cautioned that Bitcoin could face a significant downturn to $52,000 if its price breaches the critical $60,000 support level.

A CryptoQuant analyst particularly noted:

If the price breaks below $60,000, we might witness a decline to $52,000 before a subsequent rise. However, given the significant dominance of institutional ETFs, I wouldn’t be surprised if they accumulate excess supply from liquidations near the short-term support level of $60,000.

Featured image from Unsplash, Chart from TradingView

Bitcoin Could Drop To $52,000 If Price Breaks Below This Mark – CryptoQuant

Amidst the ongoing fluctuations in the cryptocurrency market, the price of Bitcoin has surged by 1.7% in the past 24 hours, hovering above the $62,000 mark.

However, recent warnings from CryptoQuant, a leading crypto analytics platform, suggest that Bitcoin could face a significant downturn to $52,000 if specific key levels are violated.

This cautionary note comes amidst growing uncertainty in the Bitcoin derivatives market, with derivative traders showing unprecedented caution compared to previous halving cycles.

Bitcoin Risky Level

CryptoQuant’s analysis highlights declining open interest and funding rates in the Bitcoin derivatives market, indicating a “cautious” stance among traders, particularly with the arrival of several institutional participants. CryptoQuant analyst Shiven Moodley noted:

At this halving, derivative traders exhibit far more caution than in previous instances. This season witnesses the entry of numerous new institutional players into the market.

According to the analyst, If Bitcoin’s price falls below the critical $60,000 support level, the top cryptocurrency could experience a notable correction to $52,000, signaling a potential short-term bearish trend.

However, the presence of institutional Bitcoin Spot ETFs may mitigate the severity of the decline by absorbing “excess supply from liquidations” around the $60,000 support zone.

Moodley stated:

If the price breaks below $60,000, we might witness a decline to $52,000 before a subsequent rise. However, given the significant dominance of institutional ETFs, I wouldn’t be surprised if they accumulate excess supply from liquidations near the short-term support level of $60,000.

Analysts Sound Alarm On BTC’s Fragile Position

Meanwhile, crypto trader and analyst Ali has further fuelled concerns by identifying a pivotal price level for Bitcoin. Ali’s analysis indicates that if Bitcoin drops to $50,500, over $15 billion in liquidations could occur on the Binance alone.

Such a significant liquidation event could exert immense pressure on the market, potentially leading to further price declines and heightened volatility.

This outlook echoes recent warnings from prominent analyst Crypto Rover, who has also cautioned about a potential liquidation event affecting short holders if Bitcoin climbs back to the crucial price mark of $71,600.

Despite these concerns, some analysts remain optimistic about Bitcoin’s long-term prospects. Crypto analyst Plan B, known for his Stock-to-Flow (S2F) model, has made bullish predictions for Bitcoin’s future price movements.

According to Plan B, Bitcoin’s upcoming Halving event will serve as a central driver for price increases, with the cryptocurrency expected to surpass $100,000 this year and exceed $300,000 by 2025.

Bitcoin (BTC) price chart on TradingView

Featured image from Unsplash, Chart from TradingView

Bitcoin Halving Hysteria: Will History Repeat Itself Or Are We Heading For A Market Meltdown?

Bitcoin stands at the forefront, with its upcoming halving event sparking excitement and uncertainty among investors. As the countdown to Bitcoin’s fourth halving narrows to roughly three days, market dynamics have taken a tumultuous turn, with significant implications for the digital asset’s price trajectory.

Deciphering BTC’s Halving Patterns: Insights Into Pre-Event Price Behaviour

While the Bitcoin market has been on a decline over the past week, A CryptoQuant analyst has recently highlighted a recurring pattern in Bitcoin’s price dynamics observed before each halving cycle.

This pattern entails a significant price decline, a trend witnessed in previous halving events. For instance, during the second halving, Bitcoin experienced a price drop of 40.36%, plummeting to $465 before eventually surging to an all-time high of $19,600.

Similarly, preceding the third halving, the cryptocurrency saw a decline of 20.35%, reaching a low of $8,078 before reaching a peak of $69,000.

Bitcoin recurring pre-halving plunge.

In the current halving cycle, the price has already decreased by 16.65%, mirroring the historical trend identified by CryptoQuant.

Despite the decline, CryptoQuant suggests that this reduction is typical before halving events, indicating that it may not necessarily warrant concern. The CryptoQuant analyst noted:

There’s no need for alarm, as this scenario repeats consistently in each cycle, albeit with varying percentages. The correct approach now is to enter the market gradually at previously identified strategic points. The path to the current cycle’s peak remains open, and we are still at the beginning of this journey.

Bitcoin’s recent price action reflects the observations made in the CryptoQuant report. The crypto has witnessed a downward trend over the past week, with a decrease of over 10% in the last seven days and a further decline of 3.1% in the past 24 hours. Currently, Bitcoin is trading at $63,098, indicating ongoing volatility in the market.

Bitcoin (BTC) price chart on TradingView

Market Experts Weigh In: Bitcoin Insights And Projections

Industry experts offer contrasting perspectives on Bitcoin’s future trajectory in light of the impending halving. Kris Marszalek, CEO of Crypto.com, acknowledges the likelihood of short-term selling pressure leading up to the halving, citing the familiar adage of “buy-the-rumor, sell-the-news” trading behavior.

Nonetheless, Marszalek remains optimistic about the long-term implications of the halving, emphasizing its potential to “bolster” Bitcoin’s price trajectory over an extended period.

Echoing this sentiment, Samson Mow, head of Jan3 BTC adoption-focused company, dismisses the current price downturn as an “overreaction,” foreseeing a bullish resurgence post-halving.

Mow highlights the impending halving as a catalyst for a significant “supply shock” in the Bitcoin market, driven by the absorption of BTC by spot Bitcoin ETFs and recent regulatory approvals for Bitcoin-related financial products in Hong Kong.

Featured image from Unsplash, Chart from TradingView

Is Bitcoin About To Skyrocket? Bitfinex Analysts Spot Familiar Patterns From December 2020

According to analysts at Bitfinex, Bitcoin and its recent activity on exchanges reflects a pattern reminiscent of December 2020, hinting at a possible growth phase.

The exchange’s latest report highlights a significant decline in the supply of Bitcoin held by long-term investors on centralized exchanges, reaching its lowest levels in 18 months.

This trend, coupled with the forthcoming halving event, suggests a scenario conducive to further price appreciation, as stated by the analysts.

Potential Growth On The Horizon

The Bitfinex Alpha report underscores the diminishing inactive supply of Bitcoin, particularly those assets stagnant for over a year. This reduction implies that long-term holders either reduce their positions or transfer their assets off exchanges.

Bitcoin Exchange Supply.

Such actions are fundamental to understanding Bitcoin’s price dynamics, especially as the halving event approaches.

With an increasing number of BTC leaving centralized exchanges and a decrease in inactive supply, the market is primed for “potential growth,” according to Bitfinex analysts. They add that this mirrors the conditions observed before the significant market surge in December 2020.

On a broader scale, data from CryptoQuant corroborates Bitfinex’s observations, indicating a continuous decline in Bitcoin exchange reserves since July 2021. This decline, which has seen reserves plummet from 2.8 million to approximately 1.94 million, suggests a sustained trend of Bitcoin leaving exchange wallets.

Bitcoin Latest Price Action

Meanwhile, Bitcoin’s price performance has taken a downturn, notably beginning late last week Friday and continuing throughout the weekend. The top crypto witnessed a significant decline, plummeting from above $70,000 to as low as $62,000.

Notably, this downward trend has persisted over the past 24 hours, with the asset experiencing a decrease of 4.6% during this period and over 10% in the past week, leading to its current trading price of $62,034 at the time of writing.

Bitcoin (BTC) price chart on TradingView

Amidst these price movements, signs of panic have emerged within the Bitcoin market. Recent data from Whale Alert sheds light on a significant transfer involving 7,690 BTC, valued at $483 million, to Coinbase, the largest cryptocurrency exchange in the United States.

While details about the origin of the address, “1Eob1,” remain undisclosed, it’s important to recognize that such transfers to exchanges often signal potential intentions to liquidate holdings. This occurrence typically suggests a readiness to sell off assets within the crypto sphere.

Furthermore, should the entity responsible for this transfer decide to sell off the entirety of the deposited BTC, it could potentially exert a notable influence on the broader Bitcoin market.

Featured image from Unsplash, Chart from TradingView

Bitcoin Bears Beware: $3 Billion Short Liquidation Looms At This Price Mark, Warns Analyst

The Bitcoin market is currently on edge as prominent analyst Crypto Rover warns of a potential liquidation event that could negatively affect the short holders.

With Bitcoin trading within a significant consolidation phase, as revealed by Rover, analysis suggests that over $3 billion in short positions could face liquidation should Bitcoin climb back to a specific price mark.

Bitcoin Bears Beware Of This Price Range

According to Rover, the crucial price mark, which is the $71,600 region, is where the $3 billion short liquidation would occur if Bitcoin reclaims it. Rover’s assessment is based on data gathered from CoinGlass, a renowned derivative market tracker, indicating a substantial liquidity accumulation at higher price levels.

BTC Liquidation Heatmap.

The recent warning from Crypto Rover comes amidst a period of turbulence in the crypto market, marked by sharp price movements and heightened trading activity.

Particularly, Bitcoin experienced a sudden decline over the weekend, bringing its price to as low as $62,000 in the zone. However, in the early hours of Monday, the asset showed signs of recovery, briefly reaching a high of $66,797 before retracing to its current price of $64,711.

Bitcoin (BTC) price chart on TradingView

The market downturn over the weekend witnessed a record number of liquidations, with over $1.2 billion in Bitcoin long positions liquidated in a single day, according to WhaleWire.

The liquidation hasn’t stopped, as the latest data from Coinglass reveals that in the past 24 hours alone, 89,151 traders have been liquidated, resulting in a total loss of $266.10 million.

The crypto market liquidation heat map

Analyst Insights And Market Dynamics

It is worth noting that Bitcoin’s recorded slight recovery comes as Hong Kong regulators granted provisional approval for asset managers to launch spot Bitcoin and Ethereum exchange-traded funds (ETFs).

Crypto analyst Willy Woo has shared his perspective on the potential impact of Bitcoin exchange-traded funds (ETFs) on market dynamics.

According to Woo, introducing the new Bitcoin ETFs could lead to significant price targets, with projections ranging from $91,000 at the bear market bottom to $650,000 at the bull market top.

Woo’s analysis underscores the growing institutional interest in BTC, with asset managers expected to allocate a substantial portion of their funds to the cryptocurrency.

However, Woo emphasizes that these projections are conservative estimates, and Bitcoin’s market capitalization could exceed gold as more capital is deployed into the asset.

Featured image from Unsplash, Chart from TradingView

Bitcoin Mining Difficulty Hits Record High In Anticipation Of Halving Event – Here’s Why It Matters

The Bitcoin network mining difficulty has surged nearly 4% to hit an all-time high just a few days before the highly anticipated Halving event. This adjustment, recorded at 86.4 trillion, marks a crucial milestone in the cryptocurrency’s history.

Decrypting Bitcoin’s Mining Complexity

Notably, Bitcoin mining difficulty measures miners’ complexity in solving mathematical puzzles to validate transactions and add new blocks to the blockchain.

This latest surge reflects the increasing computational power dedicated to securing the network as miners brace themselves for the impending Halving event scheduled for April 20.

As the mining difficulty continues to soar, miners ramp up their hash rate, representing the total computational power contributed to the network.

This surge in hash rate underscores the growing interest and investment in Bitcoin mining infrastructure, highlighting miners’ commitment to secure the network and reap rewards amidst the evolving landscape of crypto mining.

Bitcoin Hashrate and Difficulty Level.

Bitcoin Bullish Sentiment Amid Rising Mining Difficulty 

The surge in mining difficulty and hash rate comes amidst a bullish sentiment surrounding Bitcoin’s price and its potential for further growth.

The impending Halving event will see block subsidy rewards reduced from 6.25 BTC to 3.125 BTC, potentially impacting miner revenues and the overall network dynamics.

Despite these uncertainties, as the halving event draws nearer, Bitcoin has demonstrated resilience, maintaining its upward trajectory. Over the past week, the cryptocurrency has surged approximately 2.5%, with a 1.5% increase in the last 24 hours alone.

Bitcoin (BTC) BTC price chart on TradingView

As of this writing, Bitcoin trades at $69,921, reflecting its bullish momentum. Amidst these slight positive price movements and the impending Halving, Bitcoin enthusiasts and analysts have continued to express optimism, instilling confidence in investors and traders awaiting a potential BTC price spike.

Notably, prominent figures like Robert Kiyosaki, author of “Rich Dad, Poor Dad,” have recently echoed bullish sentiments, endorsing the price predictions put forth by Ark Invest founder Cathie Wood.

Wood forecasted that Bitcoin’s price could skyrocket to $2.3 million, emphasizing the cryptocurrency’s potential amidst a global investment base valued at roughly $250 trillion. Kiyosaki expressed his confidence in Wood’s prediction, highlighting her intelligence and expertise.

Featured image from Unsplash, Chart from TradingView

Bitcoin To Go ‘Ballistic’ After Halving, Says Top Analyst – Here’s Why

As the crypto space eagerly awaits the highly anticipated Bitcoin halving event, top crypto analyst Willy Woo has emerged with a bullish prediction that has stirred considerable excitement among enthusiasts.

Woo particularly underscored the potential for Bitcoin’s price to surge dramatically, using the term “ballistic” to describe the expected trajectory post-Halving.

Notably, Bitcoin’s Halving is an integral component of its protocol. It occurs approximately every four years and reduces miners’ reward for validating transactions on the blockchain.

This event also effectively reduces the rate at which new BTC enters circulation, increasing the asset’s scarcity and potentially impacting its price dynamics.

Bitcoin Would Go ‘Ballistic’ Based On This

Woo’s analysis delves into the profound implications of the impending Halving, particularly regarding Bitcoin’s supply dynamics. The cryptocurrency experiences an annual supply growth rate of 1.7%, which will be halved to 0.85% following the upcoming event.

This reduction favors Bitcoin’s supply growth rate compared to traditional assets like gold, which boasts an annual supply growth rate of approximately 1.6%.

Moreover, Woo juxtaposes Bitcoin’s supply growth against the US dollar, characterized by a negative growth rate attributed to inflation.

As the USD supply growth trends back to a standard range of 5% to 10%, Woo anticipates a momentous surge in Bitcoin’s price, driven by its inherent scarcity and growing recognition as a hedge against inflationary pressures.

Diverging Perspectives On BTC Trajectory

While Woo’s bullish forecast sets an optimistic tone for Bitcoin’s future, recent insights from a consumer survey conducted by Deutsche Bank present a more nuanced perspective.

The survey findings reveal a palpable division among respondents regarding Bitcoin’s trajectory, with approximately one-third expressing negativity about its price prospects.

These individuals anticipate Bitcoin’s value to plummet below $20,000 by year-end, representing a stark deviation from the prevailing bullish sentiment.

Adding to the discourse, Authur Hayes, co-founder of BitMEX, offers a dissenting view characterized by a bearish outlook on Bitcoin’s post-halving performance. In a comprehensive analysis shared via a blog post, Hayes outlines his concerns regarding the potential for a significant price decline after the halving.

While many analysts anticipate a bullish rally during the halving period, Hayes posits a scenario in which Bitcoin experiences a more subdued trajectory, emphasizing the need for careful consideration amid heightened market volatility.

Bitcoin (BTC) price chart on TradingView

Featured image from Unsplash, Chart from TradingView

Crypto Prophet Jeremy DaVinci Predicts Bitcoin Surge: Are We Headed For $130,000?

Amidst the recent market retracement, notable crypto enthusiast and YouTuber Jeremy DaVinci has sparked optimism in the Bitcoin community.

DaVinci’s analysis revolves around a technical indicator, the Bollinger Bands, suggesting a potential rally in Bitcoin’s price trajectory.

Where Are We Headed To?

According to DaVinci, Bitcoin has closed above the upper Bollinger Bands indicator for two consecutive months, a pattern that historically preceded significant price surges. Drawing from past occurrences, DaVinci hints at the possibility of Bitcoin’s price doubling within three months following this setup.

DaVinci, renowned for his early adoption of Bitcoin and emotional support for the cryptocurrency, has positioned himself as a prominent figure within the crypto space.

With his latest forecast, DaVinci projects Bitcoin’s price to surpass $130,000 within the next three months potentially. This bullish prediction aligns with similar sentiments echoed by other market experts, further supporting optimism among Bitcoin investors.

Macroeconomic Factors To Drive Bitcoin Rise

Adding to Bitcoin’s bullish sentiment, prominent investor Dan Tapiero has voiced his optimistic outlook for the leading cryptocurrency.

Tapiero, known for his investment insights and founding roles in Gold Bullion International and 10T Holdings, highlighted a significant macroeconomic factor that drives Bitcoin’s potential ascent.

According to Tapiero, the observed correlation in the market points to concerns regarding “monetary debasement” fueled by a substantial increase in the Treasury market over the past five years.

Tapiero’s bullish stance centers on the unique scarcity of Bitcoin as a digital asset, emphasizing its potential to outperform traditional assets like gold.

While acknowledging the favorable prospects for gold in such a scenario, Tapiero remains particularly bullish on Bitcoin’s future price trajectory. His forecast hints at the possibility of Bitcoin surpassing the $200,000 mark, offering investors an opportunity for substantial gains in digital gold.

The asset has demonstrated resilience amid these speculations and predictions regarding BTC’s possible price rally in the coming months. While Bitcoin has plunged nearly 5% in the past 24 hours, it has traded above $69,000 at the time of writing.

Bitcoin (BTC) price chart on TradingView

Featured image from Unsplash, Chart from TradingView

Are The Odds In Bitcoin Bulls Favor? These Analysts Forecast BTC’s Future

As the Bitcoin (BTC) “Halving” approaches, expectations increase about how the flagship cryptocurrency will perform. Bitcoin (BTC) is recovering momentum after facing a significant correction in the first few days of Q2, and some analysts are forecasting new heights for the number one cryptocurrency soon.

Are The Odds In The Bulls Or Bears Favor?

Bitcoin had its best quarterly close during Q1, 2024. Despite BTC’s stellar performance, as Q2 started, the market was dragged by the leading cryptocurrency’s price correction.

Since then, Bitcoin has been steadily recovering, testing the $70,000 resistance level over the weekend. As the week started, BTC appeared to have regained support above the $70,000 level.

Crypto analyst Ali Martinez seems to think that Bitcoin’s performance so far reflects a positive sentiment from investors. In an X post, Martinez shared a chart that paints an optimistic picture, at least for now.

According to Martinez’s post, the In/Out of the Money Around Price (IOMAP) indicator seems favorable to the bulls. Per the chart, the addresses holding BTC at the support level massively outnumber those holding Bitcoin at the resistance level.

The chart suggests that Bitcoin is at “stable support” as 474,000 addresses hold 285,000 BTC between $70,760 and $71,200. Meanwhile, 1.4 million addresses hold the flagship cryptocurrency between $68,220 and $70,325.

When compared, the addresses and BTC held at the support level nearly triple those in the resistance zone. To the analyst, bulls are the current victors as “odds appear to favor” them.

Analyst Forecast Bitcoin To 90,000 Soon

Captain Faibik, another crypto analyst, also seems to perceive more bullish momentum for Bitcoin. In an X post, the analyst suggests that BTC’s “bullish pennant upside break is confirmed on the daily chart.”

Per the chart, the flagship cryptocurrency’s price started a consolidation period in early March, forming a pennant pattern. This pattern saw an upside breakout after Monday’s daily candle closed above the $70,000 price range.

Due to this breakout, the analyst forecasts a surge to the $88,000-$90,000 price range this month.


At the time of writing, Bitcoin remains above the $70,000 support level, only 5% below its most recent all-time high (ATH) price of $73,373. Despite the positive resistance, BTC’s price performance shows a slight decrease of 2.3% from yesterday.

Similarly, its daily trading volume and market capitalization have mildly dropped. According to CoinMarketCap data, BTC’s daily trading volume is down by 6%, while its market cap of $1.38 trillion represents a 2.1% decrease.

Nonetheless, Bitcoin remains 8.4% above its price seven days ago, trading at $70,378. Further bullish sentiment, fueled by the upcoming “Halving” event, could help the largest cryptocurrency by market capitalization consolidate its support above the current levels.

BTC, BTCUSDT, Bitcoin

Beyond Halving: Expert Predicts Bitcoin To Soar Above $200,000 With Surprising Catalyst

Global investor Dan Tapiero recently shared his optimistic outlook for Bitcoin (BTC), suggesting that the leading cryptocurrency soars above the $200,000 mark might be on the horizon.

Tapiero, known for his investment insights and co-founding roles in Gold Bullion International and 10T Holdings, took to X to express this bullish sentiment.

Catalyst That Could Drive Bitcoin To $200,000

According to Tapiero, a significant macroeconomic factor is expected to drive Bitcoin’s price to new heights, offering investors an opportunity for substantial gains. Tapiero’s bullish stance on Bitcoin’s future price trajectory revolves around a unique correlation he observed in the market.

Particularly, the expert highlighted concerns about “monetary debasement” driven by a notable 60% increase in the Treasury market over the past five years.

This factor leads Tapiero to anticipate a surge beyond $200,000 for the digital gold, Bitcoin. While acknowledging the potential for gold to perform well in such a scenario, Tapiero remains particularly bullish on Bitcoin’s prospects.

Bitcoin’s Recent Performance And Analyst Insights

In the past 24 hours, Bitcoin has exhibited bullish momentum, surpassing and reclaiming the $71,000 price level. With a 2.6% increase over the week and a 3.1% surge in the last 24 hours, Bitcoin’s upward trajectory continues to attract attention from investors and analysts alike.

Bitcoin (BTC) price chart on TradingView

Notably, the current price performance of the asset coincides with a notable event: over 600 BTC of $100,000 strike call options have recently been traded in a Block trade. This significant development, as illuminated by Greek Live, carries a notional value of up to $45 million, with $8.5 million worth of premiums alone.

Greeks Live further reported that this occurrence has propelled the entire market into a prolonged bullish momentum. In addition, with the halving event on the horizon, the prospect of reaching new all-time highs, including the milestone of $100,000, appears to be within reach.

Echoing Tapiero’s optimism, analyst Michael Van De Poppe has also recently emphasized Bitcoin’s potential for unprecedented growth.

According to Van De Poppe, despite encountering resistance, Bitcoin’s ability to break through key levels could pave the way for a surge towards new all-time highs, with projections reaching as high as $300,000 in the current bull run.

Featured image from Unsplash, Chart from TradingView

Bitcoin’s Recovery Rally: Breaking Through This Level Is Key To Bullish Momentum – Analyst

Over the past week, Bitcoin (BTC) has struggled to move significantly to the upside as the leading cryptocurrency has entered a consolidation phase below the $69,000 mark.

This subdued volatility departs from Bitcoin’s usual fluctuations, raising speculation about a potential stagnation phase in its market trajectory.

Anticipation Builds For Bitcoin’s Next Rally

The cryptocurrency community has closely monitored Bitcoin’s movements, especially as it approaches crucial resistance levels. Insights from prominent crypto analyst Captain Faibik shed light on Bitcoin’s current outlook.

Captain Faibik suggests that Bitcoin could be on the brink of a significant breakout, contingent upon surpassing the $70,000 resistance threshold. According to the crypto analyst, the BTC “Bulls must Clear the $70,000 Resistance area to Confirm the upside Breakout.”

Another crypto analyst, Jelle, Echoes similar sentiments and emphasizes the importance of patience among investors, particularly with the impending Bitcoin halving event on the horizon.

Notably, the Halving is a pre-programmed event built into the Bitcoin protocol that occurs approximately every four years within the Bitcoin network to reduce the reward for mining new BTC blocks.

Despite Bitcoin’s recent consolidation, anticipation for a potential rally above the $70,000 mark continues to build within the crypto community, especially as the halving is now less than 20 days away. This is because the halving ultimately decreases the supply of new BTC, and reduced supply often leads to increased demand and speculative buying.

 Hope For Bitcoin Bull Run

Jelle’s analysis underscores the historical precedent of Bitcoin’s price movements, noting that previous all-time highs were often preceded by periods of consolidation and uncertainty.

Drawing attention to bullish indicators such as the pennant formation and strong support levels, Jelle predicts a breakout in the coming weeks, providing hope for investors seeking upward momentum in Bitcoin’s price trajectory.

Meanwhile, current market data indicates a favorable environment for retail traders, with Glassnode reporting increased Bitcoin accumulation by short-term holders since December 2023.

Bitcoin short term holders metric.

This trend suggests growing confidence among retail investors in Bitcoin’s long-term potential, further fuelling expectations for a potential rally beyond $70,000.

Featured image from Unsplash, Chart from TradingView