Can Bitcoin Overcome Past Trends? Examining The Pre-Halving Rally And Resistance Levels

Bitcoin (BTC), the largest cryptocurrency in the market by trading volume and capitalization, has embarked on a renewed bullish uptrend, reclaiming previously lost territories and surpassing resistance levels, igniting optimism among investors. 

Currently trading just below its 25-month high of $49,000 at $47,900, Bitcoin has experienced a remarkable price increase of over 6% within 24 hours and a significant 11% surge over the past seven days. 

Mapping BTC’s Path Amidst Pre-Halving Rally

However, amidst the market’s excitement, it is crucial to consider historical tendencies and their potential impact on Bitcoin’s trajectory leading up to the upcoming halving event. Market expert and analyst Rekt Capital highlights two noteworthy historical patterns:

Firstly, the “Pre-Halving Rally” phase appears to be commencing. This phase refers to a period where Bitcoin experiences a surge in price before the halving event takes place. 

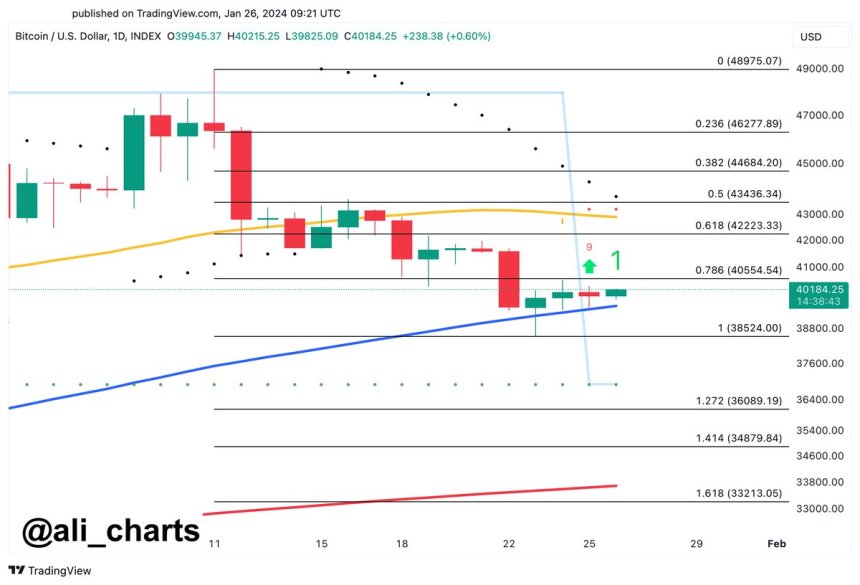
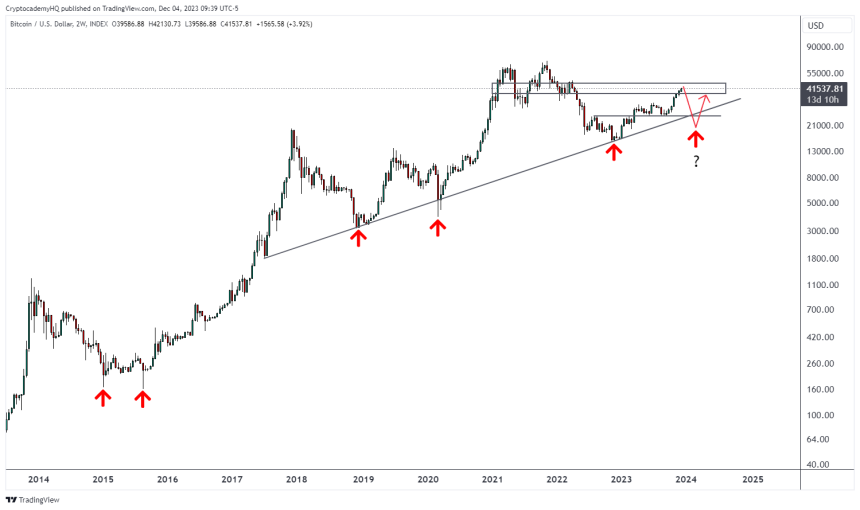
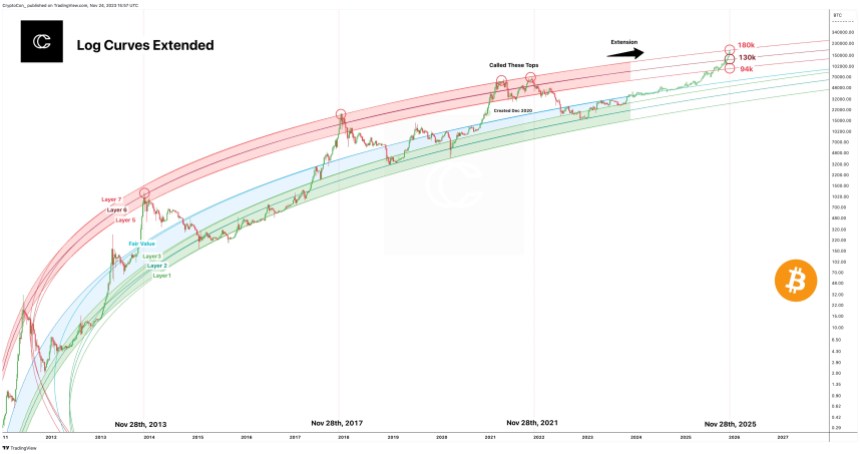
Secondly, historical data reveals that Bitcoin has struggled to break beyond the macro diagonal resistance before the halving, which Rekt places at $47,000. Additionally, it has encountered difficulty surpassing its Four Year Cycle resistance, which is approximately $46,000 in the current cycle.

It is worth noting that even though the price has surpassed these resistance levels, a consolidation or continuation of the uptrend must be seen, as a retracement could take place and leave the BTC price stuck between these resistances.

Bitcoin

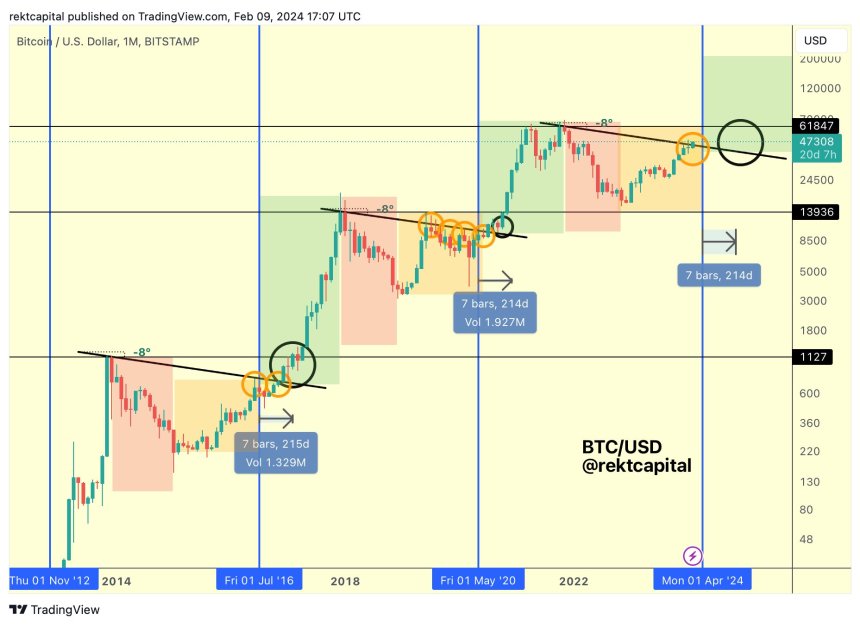
Given these historical trends, exploring how Bitcoin could potentially reconcile these patterns is interesting. Rekt Capital offers insights into one possible path that Bitcoin could take:

During the pre-halving rally phase, Bitcoin may produce limited upside, resulting in an upside wick at the end of February. This pattern has been observed in previous months and 2019. 

Following this, Bitcoin might establish another range at higher price levels in March, potentially allowing altcoin rallies to take center stage. Finally, a few weeks before the halving event, Bitcoin could experience a pullback, creating a pre-halving retrace.

This proposed path suggests that Bitcoin could surpass the Macro Diagonal resistance with an upside wick but remain below it in terms of end-of-month monthly candle closes during this gradually concluding pre-halving period.

Bitcoin Bull Run Indicator Flashing Buy Signal

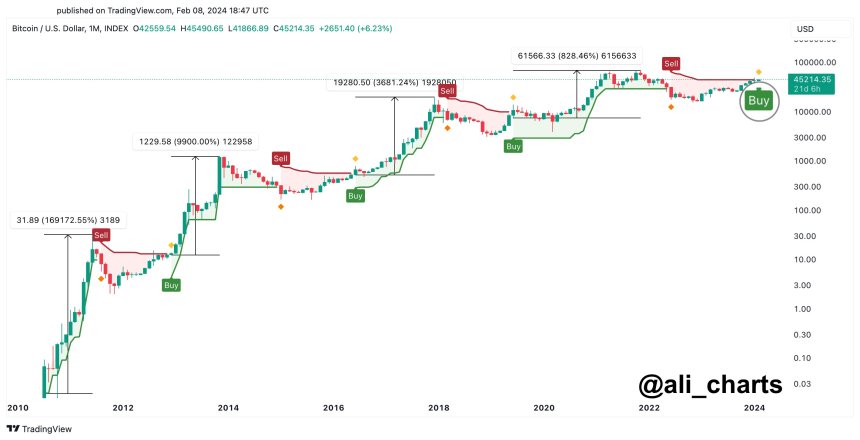
Crypto analyst Ali Martinez has added to the growing bullish sentiment surrounding Bitcoin by highlighting a key indicator that suggests potential upside movement. 

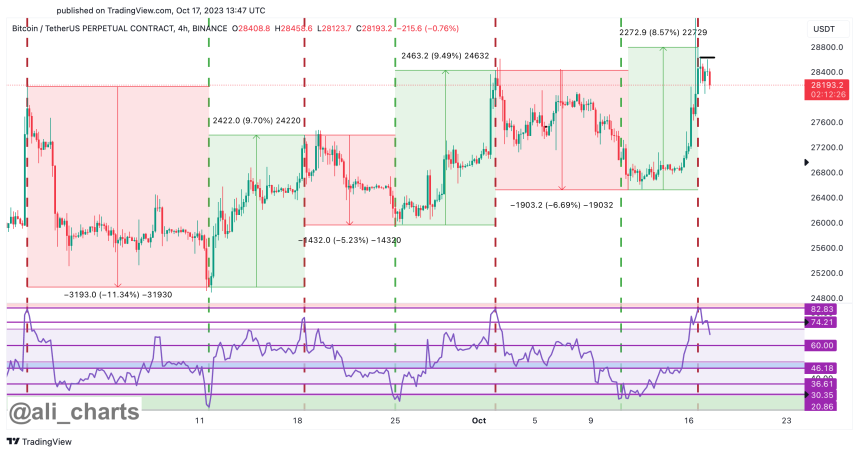
According to Martinez, the Super Trend indicator flashed a buy signal on the BTC monthly chart. This tool is renowned for its precision in predicting bullish trends in Bitcoin markets.

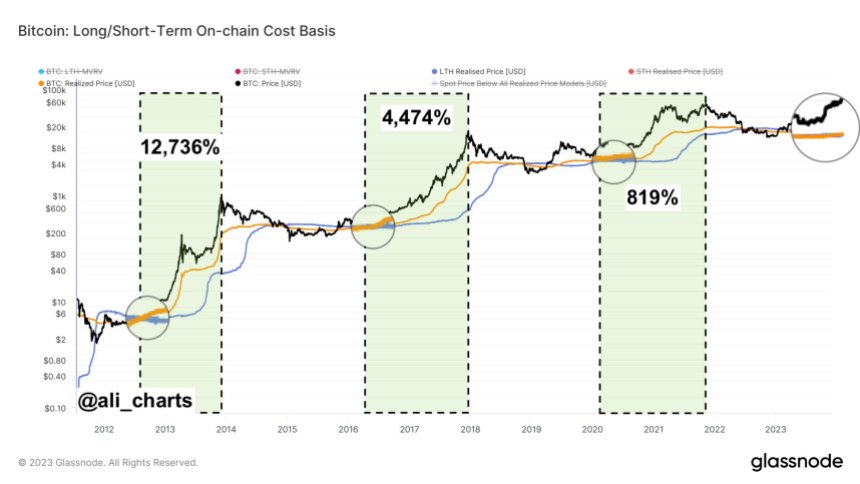
The indicator’s track record underscores the significance of this buy signal. Martinez points out that the Super Trend has issued four buy signals since Bitcoin’s inception, and all four have been validated, leading to substantial gains. These gains amount to an impressive 169,172%, 9,900%, 3,680%, and 828%, respectively.

Bitcoin

However, amidst the bullish outlook, Martinez also highlights a potential strategy that may soon impact Bitcoin’s price.

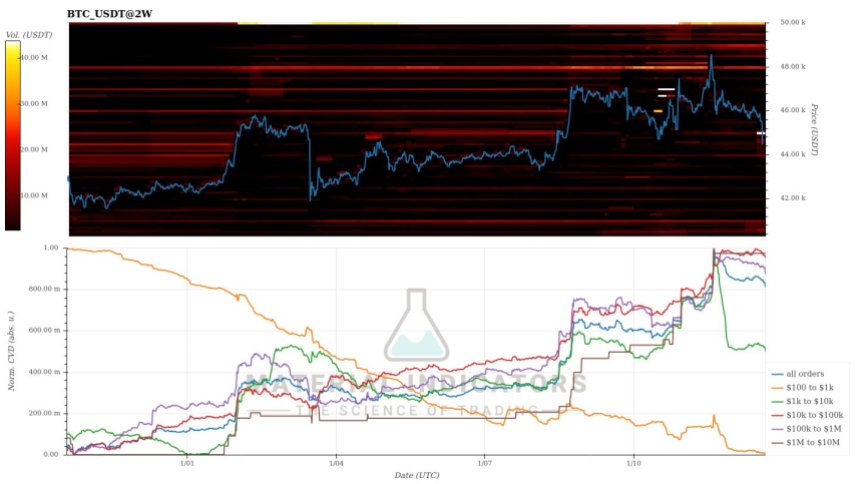
According to the Bitcoin liquidation heatmap, a scenario is unfolding where liquidity hunters could drive the price of Bitcoin down to $45,810. The intention behind this move would be to trigger liquidations amounting to a substantial $54.73 million.

It is important to understand that liquidity hunters aim to exploit price movements to trigger forced liquidations among overleveraged traders. By strategically driving the price down, they can force these traders to sell their positions, resulting in cascading liquidations that potentially amplify price downward movements.

Bitcoin

Featured image from Shutterstock, chart from TradingView.com 

Bitcoin Crash Ahead: Expert Predicts Testing $20K Before Rebound

Bitcoin, the largest cryptocurrency in the market, experienced a price recovery on Friday; however, industry experts anticipate a further test of sub-$30,000 levels in the near term. 

The prolonged downtrend observed over the past fourteen days, coupled with mounting selling pressure, has raised concerns about the sustainability of the recent rebound.

BTC’s Local Bottom Predicted

Chris Burniske, co-founder of a New York-based venture crypto firm, highlights several factors contributing to the anticipated downward movement of Bitcoin. 

Burniske suggests that the consolidation phase may extend longer than expected due to many variables, including crypto-market dynamics, macroeconomic conditions, adoption trends, and new product developments. 

Burniske offers his outlook on Bitcoin, stating that a local bottom could be reached in the $30,000 to $36,000 range. However, he wouldn’t be surprised if the cryptocurrency tests the mid-to-high $20,000 before recovery occurs, leading to a renewed push toward previous all-time highs. 

Burniske cautions that the path to such a recovery will likely be volatile, marked by potential fakeouts, and may span several months.

The market expert advises investors to exercise patience during this period of uncertainty. Burniske suggests that other cryptocurrencies may experience more significant percentage declines if his predictions hold Bitcoin. Burniske further stated:

Before you get mad with, “We’re just getting this cycle started, Chris!!!” Mostly agree, ~called the cycle bottom in Nov 2022 and continue to believe the long-term trend remains robust. Have also seen a lot of crypto volatility over the last decade+…. recently, I’ve specifically been discussing a local top and local low, not a cycle-wide top and low. 

Buy Signal For Bitcoin

Crypto analyst Ali Martinez has provided insights into potential price movements for Bitcoin in its latest analysis conducted on the social media platform X (formerly Twitter). 

Martinez’s assessment indicates that the TD Sequential indicator recently flashed a buy signal on the daily chart, coinciding with Bitcoin’s current position above the 100-day Simple Moving Average (SMA) at approximately the $40,000 level. 

Bitcoin

According to Martinez, if Bitcoin surpasses the $40,550 resistance level, it may trigger an upswing with a target price of $43,000. This bullish scenario implies a potential price rally for Bitcoin soon. 

However, the analyst also highlights the importance of closely monitoring the 100SMA support level, as a breach of this level could have significant implications for the cryptocurrency’s price trajectory.

Martinez cautions that if the 100SMA support level is breached, it might result in Bitcoin experiencing a downward move toward the $33,300 level. This potential downside scenario indicates a critical support level that, if broken, could lead to increased selling pressure and a bearish sentiment in the market.

Bitcoin

At the time of writing, BTC’s price has recovered 3.8% over the past 24 hours, resulting in a current trading price of $41,400.

Featured image from Shutterstock, chart from TradingView.com

Bitcoin Price At Risk? Grayscale’s $335M Coinbase Transfer Stirs $30,000 Plunge Potential

The Bitcoin price has experienced a notable shift as selling pressure mounts, with BTC bears gaining the upper hand. Asset manager Grayscale, the owner and manager of the Grayscale Bitcoin Trust (GBTC), is a significant contributor to this trend. 

Since the trading of spot Bitcoin exchange-traded funds (ETFs) began on January 12, Grayscale has been on a selling spree, as evidenced by substantial transfers of BTC to the United States-based crypto exchange Coinbase.

Bitcoin Price Under Pressure As Grayscale Selling Spree Continues

According to Akrham Intelligence data, in addition to the previously reported 69,994 BTC ($2.9 billion) transfers, Grayscale sent an additional 8,593,075 BTC (approximately $335.19 million) to the exchange on Tuesday, suggesting the possibility of further selling activities.

Bitcoin price

These developments have affected the Bitcoin price, which has experienced a significant downtrend, declining by 20% over the past week and a half. 

On Tuesday, the largest cryptocurrency dropped as low as $38,500, placing considerable pressure on a crucial support level. Despite the bearish pressure, the $38,500 support level has demonstrated resilience so far, with the cryptocurrency rebounding to $39,300 at the time of writing. 

Nevertheless, the duration of Grayscale’s selling spree remains uncertain, and if market sentiment continues to turn negative, Bitcoin could potentially revisit the $30,000 mark. This figure is just above the key $29,000 level that marked the beginning of the bull run that took Bitcoin to its 22-month high of $49,000 on January 11th.

Bears On The Rise

If the $38,500 threshold succumbs to Grayscale’s selling pressure and profit-taking, market observers should closely monitor the $37,750 level as the next resistance. 

Failure to hold above this level would open the door to a potential decline toward the major resistance at $35,600, which could further prevent a dip to the next support level at $33,000.

However, if these support levels are breached and the Bitcoin price continues its downtrend, the next significant key levels to watch for bullish momentum would be $29,000 to $30,000. A breakdown below these levels could signal an end to the current bull market structure and grant the bears the upper hand in the mid-term, at least until the anticipated halving event in April. 

Historically, halving events have acted as major catalysts for the Bitcoin price, and their influence has been demonstrated.

As the Bitcoin market faces intensified selling pressure and Grayscale’s ongoing selling spree, market participants remain cautious about the potential for a significant price plunge. The coming days and weeks will be critical in determining whether Bitcoin can regain its bullish momentum or if it will succumb to further downward pressure.

Bitcoin price

Featured image from Shutterstock, chart from TradingView.com

Bloodbath For Bitcoin: Grayscale’s $529 Million BTC Move To Coinbase Pushes Price Below $41,000

Bitcoin (BTC), the largest cryptocurrency in the market, has experienced a sharp drop below the $41,000 mark as exchange-traded funds (ETFs) for Bitcoin went live on January 12. 

The subsequent profit-taking, selling pressure, and outflows from Grayscale’s Bitcoin Trust ETF (GBTC) played a significant role in the downward trend.

Grayscale’s Bitcoin Transfers To Coinbase Intensify

On Tuesday, NewsBTC reported that six days ago, Grayscale initiated the first batch of BTC outflows from their holdings to a Coinbase, totaling 4,000 BTC (approximately $183 million) over six days. 

However, the asset manager resumed outflows from the Trust to the exchange on Tuesday, sending an additional 11,700 BTC (equivalent to $491.4 million) to Coinbase. 

Furthermore, on Friday, data from Arkham Intelligence revealed that 12,865 BTC ($529 million) were transferred from the Grayscale Trust address to Coinbase Prime. 

Bitcoin

In total, the Grayscale Trust address has transferred 54,343 BTC ($2.313 billion) to Coinbase Prime during the opening hours of the US stock market over five consecutive trading days since January 12, which has undoubtedly contributed to the downtrend in Bitcoin’s price.

Selling Frenzy Among BTC Miners

In addition to Grayscale’s selling spree, there has been increased selling activity by Bitcoin miners ahead of the upcoming Bitcoin halving. 

Crypto analyst Ali Martinez highlights that on-chain data from CryptoQuant indicates a substantial increase in selling activity by BTC miners. In the past 24 hours, miners offloaded nearly 10,600 BTC, with a value of approximately $455.8 million.

The persistent selling pressure has caused BTC to trade at $40,900, reflecting a slight 0.2% decrease over the past 24 hours. 

Bitcoin

The downtrend has been evident across various time frames, with declines of 5%, 6%, and 7% over the seven, fourteen, and thirty-day periods, respectively. However, despite these recent setbacks, Bitcoin remains remarkably positive year-to-date, with an impressive 98% gain.

Overall, the combined impact of Grayscale’s Bitcoin Trust ETF outflows and increased selling activity by miners has intensified the downward pressure on Bitcoin’s price, breaching the critical support level of $41,000. 

The focus now turns to how Bitcoin bulls will defend the crucial $40,000 support level, which stands as the last line of defense before a potential dip toward the $37,700 mark.

Bitcoin

Should this support level fail to hold, the Bitcoin market could witness further price declines, potentially pushing the price down to the $35,800 mark. However, with the Bitcoin halving scheduled for April, bullish investors are hopeful that this event will catalyze a significant bull run.

Featured image from Shutterstock, chart from TradingView.com

Bitcoin Price Suffers Post-Spot ETF Blues, Drops 7% To $43,200

The introduction of Bitcoin (BTC) exchange-traded funds (ETFs) has triggered a significant sell-off, leading to a sharp decline in the Bitcoin price.

After gaining approval and commencing trading on Thursday, the ETFs have prompted a “sell the news” event, causing Bitcoin’s value to plummet from its initial trading price of $46,500 at the time of approval to a low of $43,200 within a matter of hours on Friday.

Over the past 24 hours, Bitcoin, the largest cryptocurrency by market capitalization, has experienced a 7% drop. Its gains over the past 30 days have been limited to a mere 4%, erasing much of the progress made during that period. 

Additionally, as selling pressure continues to mount following the approval, there are indications that the Bitcoin price may face further downward pressure.

Bitcoin Price Under Pressure

CryptoQuant analyst J.A. Maartunn observed significant sell orders in Bitcoin’s two-week chart on Wednesday. Notably, three clusters of sell orders were positioned between $46,100 and $48,000, comprising stacks of 755, 1,031, and 794 BTC, respectively.

According to the CryptoQuant analyst, such patterns are typically associated with market tops, unless these orders are later withdrawn or executed.

This influx of sell orders may help explain the lackluster response to the ETF approvals until now, as it appears that selling pressure has been building up. However, the situation has intensified even further. 

According to Maartunn, additional sell orders were detected on Friday, indicating that the seller is not yet finished. Two substantial sell orders have been placed just above the current Bitcoin price: one for 894 BTC at $44,000 and another for 1,071 BTC at $45,100.

Bitcoin price

These developments suggest that market participants are taking advantage of the ETF news to offload their Bitcoin holdings, leading to increased selling pressure and a subsequent price decline. 

The market’s stabilization following this period of heightened selling pressure remains uncertain. The introduction of ETFs was believed to bring about heightened institutional interest and potentially drive up the Bitcoin price. 

However, it is important to note that the impact of these ETFs is expected to unfold over the long term, rather than being evident within days, weeks, or even months. It will likely take years to fully gauge the effects and consequences of ETF integration on the Bitcoin market.

Bitcoin’s Bullish Structure Remains Intact

Amidst the ongoing selling pressure, several support lines may potentially halt the downtrend and bring positive news for the Bitcoin price and BTC bulls.

Although Bitcoin has already lost its $44,000 support level, there is another crucial threshold at $42,700 that could prevent further decline. If this level holds, there is a chance for Bitcoin to regain the $43,000 mark and reverse the downward momentum.

Bitcoin price

If the $42,700 support is breached, additional support lines come into play. These include $42,300, $41,700, and $41,200, which act as the last barriers before a potential test of the $40,000 support level. The $40,000 mark holds significance as it represents the final support before a potential dip towards $38,000.

However, there is a positive aspect for Bitcoin bulls to consider. The current bullish structure of the cryptocurrency remains intact as long as the dip does not breach the $29,900 mark.

This level marked the beginning of the current bullish uptrend, and its preservation would ensure the maintenance of the overall positive market structure.

Featured image from Shutterstock, chart from TradingView.com 

SEC’s “Crypto Asset Securities” Alert Boosts Spot Bitcoin ETF Prospects – Here’s Why

As anticipation builds for the long-awaited approval of a spot Bitcoin ETF by the US Securities and Exchange Commission (SEC), an encouraging sign has emerged, further increasing the likelihood of approval

The SEC issued an investor alert regarding “crypto asset securities,” prompting speculation that the spot Bitcoin ETF may be closer than ever. 

Spot Bitcoin ETF Approval On The Horizon?

The recent investor alert issued by the SEC has garnered significant attention in the cryptocurrency community. While the alert does not explicitly mention the spot Bitcoin ETF, many market participants believe it is a positive indicator for its potential approval.

The parallel between the investor alert and the approval of Bitcoin Futures adds to the growing optimism surrounding the spot Bitcoin ETF. Before approving Bitcoin Futures, the SEC issued similar alerts and warnings, indicating their concern and engagement with the underlying asset class. 

Consequently, market observers, including Bloomberg’s ETF expert Erich Balchunas, are interpreting the investor alert on “crypto asset securities” as a potential precursor to the approval of a spot Bitcoin ETF. Balchunas stated: 

Oh snap, SEC tweeting out educational materials, warnings on crypto investing, which is something they also did ahead of $BITO

It is important to note that the SEC will evaluate various factors, including investor protection, market integrity, and compliance with existing regulations, before making a final determination on the spot Bitcoin ETF. 

However, given the increased attention and progress in cryptocurrency, the issuance of the investor alert signifies a step in the right direction.

Potential BTC Surge To $48,000 

Renowned crypto analyst, Crypto Con, has made interesting observations regarding BTC’s current market dynamics that shed light on the potential next steps for the largest cryptocurrency on the market.

According to Crypto Con, money has been pouring into BTC at a rate not witnessed since the last cycle’s peak, with historical data indicating similar patterns on only five prior occasions. 

This influx of funds has heightened the market’s sentiment and created anticipation for potential further price gains. Crypto Con highlights the significance of Bitcoin’s Money Flow Index (MFI), a technical indicator used to measure the strength and volume of funds flowing into or out of an asset, which reached a value of 91.57, historically indicating the presence of additional bullish momentum.

Bitcoin ETF

Furthermore, the analyst identifies the .618 cycle retrace of weekly candle bodies as a point of interest for potential target ranges. This level aligns with other significant price regions, further bolstering its importance. 

Crypto Con suggests that Bitcoin’s price could likely reach the range of $47,000-$48,000 based on these target ranges. However, the analyst also notes that significant price increases are often followed by retracements at this stage in the market cycle.

Crypto Con highlights the potential for a retracement after the completion of the current price rise. The analyst identifies the $31,000-$32,000 range as an area of interest for a potential retracement based on long-term data. 

Bitcoin ETF

As of the time of writing, Bitcoin (BTC) is being traded at $43,800, showcasing a noteworthy recovery within the past 24 hours following a retracement below $42,900 on Thursday. 

While this price rebound is encouraging, it remains uncertain whether the prevailing market dynamics possess sufficient strength to propel Bitcoin beyond its current yearly high of $44,500. There is a possibility that Bitcoin may experience another failed attempt to surpass this level, which could subsequently result in a deeper retracement before witnessing another upward movement.

Featured image from Shutterstock, chart from TradingView.com 

Bitcoin Poised For December Surge As Historical Patterns Suggest Strong Upside Ahead

As the eagerly awaited Bitcoin (BTC) exchange-traded fund (ETF) verdict approaches, excitement and anticipation continue to grow in the cryptocurrency market. 

According to a report by K33 Research, the upcoming decision, expected between January 8 and January 10, has been a significant factor behind Bitcoin’s positive momentum since October. Institutional demand remains robust, with traditional investors strongly interested in adding long BTC exposure. 

Bitcoin Set For Bullish December? 

Bitcoin has displayed a notable tendency to surge higher in the lead-up to major events, creating a sense of enthusiasm and driving prices upward. This phenomenon has been observed across various significant milestones in the cryptocurrency’s history. 

According to the report, examples include Bitcoin’s peak coinciding with the launch of the Chicago Mercantile Exchange’s (CME) BTC futures in 2017, its spike coinciding with Coinbase’s public listing in April 2021, and its peak on the day El Salvador declared Bitcoin legal tender in September 2021.

Similarly, Bitcoin reached its peak on the date of VanEck’s spot ETF deadline in November 2021. These instances highlight the potential for Bitcoin to experience significant price movements as the ETF verdict draws near.

The report emphasizes the substantial demand from institutional investors seeking exposure to Bitcoin. BTC exchange-traded products (ETPs) witnessed inflows of nearly 40,000 BTC in November, while CME open interest reached and maintained all-time highs. Futures premiums have also surged to 20%, indicating the strong interest from institutional players. 

In contrast, retail participation has shown signs of stagnation. Offshore flows have remained shallow, and Bitcoin-denominated open interest in BTC perpetual contracts is currently at yearly lows. These factors suggest that institutional flows continue to be the driving force behind Bitcoin’s solid market strength.

Based on the historical pattern of event-driven price movements and the sustained institutional demand, the report maintains a positive outlook for Bitcoin in December. 

As the ETF verdict approaches, K33 Research’s report suggests that the narrowing time window is expected to fuel enthusiasm and drive prices higher. However, it is worth noting that once the event occurs, prices may experience a temporary surge before potentially stabilizing, according to the report. 

 BTC’s Bull Run Indicator

Renowned crypto analyst Ali Martinez has identified a significant development in the Bitcoin market that suggests a bullish outlook for the cryptocurrency. 

According to Martinez, the Realized Price of Bitcoin has surpassed the Long-Term Holder Realized Price, signaling an increase in market momentum and attracting new investors willing to purchase Bitcoin at higher prices. 

Martinez’s analysis highlights that similar occurrences in the past have preceded substantial price surges, further fueling optimism regarding Bitcoin’s future performance. 

Bitcoin

The Realized Price of Bitcoin refers to the average price at which all previously transacted coins were acquired. It considers the price at which each Bitcoin unit was last moved on the blockchain. 

On the other hand, the Long-Term Holder Realized Price focuses specifically on coins held by long-term investors, providing insights into their average acquisition price. When the Realized Price surpasses the Long-Term Holder’s Realized Price, it suggests that newer investors are entering the market and are willing to buy Bitcoin at higher valuations.

As seen in the above chart, Bitcoin experienced significant gains following this bullish signal on three separate occasions in the past. Specifically, the cryptocurrency surged 12,736%, 4,474%, and 819%, respectively, following similar events. 

Bitcoin

In addition to Martinez’s bullish outlook for BTC, the largest cryptocurrency on the market has demonstrated relatively stable price action above $44,000 in the past hour. 

This stability increases the potential for continued upside and consolidation above key levels, positioning Bitcoin for further gains and surges in the future. It remains to be seen if the cryptocurrency will see any corrections following its impressive 16% surge over the past few days. 

Featured image from Shutterstock, chart from TradingView.com 

Warning Signals Flash As Bitcoin Surges: Expert Spotlights Potential $25,000 Liquidity Sweep

Bitcoin (BTC), the world’s leading cryptocurrency, has recently witnessed a surge in price, reaching a new yearly high of $42,100 on Monday. However, this significant price increase has raised concerns among market participants about the possibility of a potential correction and a subsequent liquidation sweep, which could drive the price down to as low as $25,000.

Second Capitulation And Liquidity Sweep For Bitcoin?

Justin Bennett, a prominent technical analysis expert, acknowledges the remarkable performance of Bitcoin, stating, “It’s been a hell of a run from BTC, and it may very well continue without a significant correction in the short term.” 

However, Bennett highlights that the previous two bear markets concluded with a second capitulation, suggesting the possibility of a similar scenario occurring this time. Bennet cautions against ruling out a liquidity sweep that could drive the price down to $25,000.

To provide further context, liquidity sweep refers to a sudden and drastic move in price that aims to clear out excess leverage and trigger liquidations of overleveraged positions. 

Such a move could lead to a cascading effect, causing the price to drop further as more positions get forcefully closed. The occurrence of a liquidity sweep at the $25,000 level would not only test the resilience of Bitcoin but also serve as a crucial moment for market sentiment.

Bitcoin

As seen in the 2-week chart above shared by Bennet, despite the potential correction in BTC, this could be the last difficulty that Bitcoin bulls experience before the continuation of the bull run; this will be further fueled by the potential approval of Bitcoin spot exchange-traded funds (ETFs) applications by the US Securities and Exchange Commission (SEC), which is expected to push prices even higher. 

A boost from the halving of Bitcoin will further add to the bullish momentum and sentiment in the market, which could push the price of BTC to new all-time highs (ATH).

Additionally, historical trends indicate a promising outlook for Bitcoin. Analyst Ali Martinez points out that in the past, strong BTC performance during October and November has been followed by a bullish December. According to Martinez, market participants can anticipate a bullish December ahead if this pattern holds. 

El Salvador’s BTC Investments Prove Profitable

El Salvador’s President Nayib Bukele recently announced that the nation’s investments in Bitcoin have yielded significant profits, refuting previous claims of losses made by critics. 

President Bukele revealed that if El Salvador were to sell its Bitcoin holdings at the current market price, the country would not only fully recover its initial investment but also make a profit of $3,620,277.13.

Bitcoin

Addressing the numerous articles and hit pieces that had ridiculed El Salvador’s Bitcoin investment strategy, President Bukele emphasized that these assessments were based on the cryptocurrency’s market price at the time of evaluation. With Bitcoin’s recent surge in value, the country’s investment has turned profitable.

While acknowledging that the price of Bitcoin will continue to fluctuate, President Bukele reaffirmed that El Salvador remains committed to its long-term strategy and has no intention of selling its Bitcoin holdings. President Bukele stated: 

Of course, we have no intention of selling; that has never been our objective. We are fully aware that the price will continue to fluctuate in the future, this doesn’t affect our long-term strategy.

Bitcoin

At the time of writing, BTC is trading at $41,200, reflecting a notable price increase of 3.8% over the past 24 hours and 12% over the past seven days.

Featured image from Shutterstock, chart from TradingView.com 

Bitcoin Eyes New Highs As Bloomberg Analyst Reiterates 90% Chance Of January ETF Approval

Bitcoin (BTC), the leading cryptocurrency, is currently in an upward accumulation phase, inching closer to surpassing its current yearly high of $38,390. 

This upward trend is further fueled by the anticipation surrounding the approval of Bitcoin spot exchange-traded funds (ETFs) by the US Securities and Exchange Commission (SEC).

Bitcoin ETF Approval By January 10

In a recent post on X (formerly Twitter), Erich Balchunas, a Bloomberg ETF expert, shared his perspective on the probability of Bitcoin ETF approval. Balchunas maintains a 90% chance of SEC approval by January 10, which has remained consistent for months. 

Balchunas highlights that while debates over specific dates and timelines persist, the SEC and issuers are diligently working behind the scenes to make ETFs ready for this cycle, defying earlier skepticism. Balchunas stated: 

People asking me if we changed odds. No, we still holding line at 90% odds of approval by Jan 10 (aka this cycle), the same odds we’ve had for months (before it was cool/safe). What we watching for now: more amended/final filings to roll in and clarity on in-kind vs cash creates

As predicted by many analysts, Bitcoin is poised for a potential breakout in the upcoming months, both before and after these investment products’ anticipated approval. As reported by NewsBTC, Bitcoin could surge to as high as $50,000 even before the halving event forecasted for April.

In this context, Bitcoin must maintain its position above the key support level of $35,000. This mark serves as a threshold for future gains, both preceding and succeeding the approval of spot ETFs. 

Upholding this support level will be instrumental in determining Bitcoin’s prospects for continued growth and market performance.

Next Resistance Level Holds Key To Surpassing All-Time High

Renowned crypto analyst Crypto Con has shed light on the remarkable strength of the current Bitcoin cycle, drawing comparisons to the previous from 2019 to 2022. 

By examining key resistance levels and price movements, Crypto Con emphasizes the positive outlook for Bitcoin’s price trajectory and suggests that the current cycle is poised for success.

Crypto Con highlights the prolonged weakness observed during the 2019-2022 Bitcoin cycle, characterized by Bitcoin’s struggle to surpass the initial Wave Trend resistance over a year. 

In contrast, the current cycle has demonstrated impressive resilience, effortlessly breaking through this resistance level.

Despite the substantial rise in Bitcoin’s price, Crypto Con points out that the cryptocurrency has yet to reach the next resistance level, called green zone 2, with a price target of $40,000. 

Bitcoin

In a typical cycle, this milestone does not indicate the end of price action but rather marks the beginning of a more significant upward trajectory.

Crypto Con further suggests that subsequent resistance levels, indicated by the color blue in the chart above, can drive Bitcoin’s price even higher, surpassing its previous all-time high.

Bitcoin

At the time of writing, BTC is trading at $37,700, down 0.7% over the past 24 hours, and it remains to be seen if a consolidation above $38,000 will occur.

 Featured image from Shutterstock, chart from TradingView.com

Bitcoin Storms Past $38,000 Once More, Anticipating Breakout To New Annual Peak

Bitcoin (BTC) has again demonstrated its bullish momentum by surging above the $38,000 mark. Breaking free from the recent trading range between $36,500 and $37,500, BTC currently trades at $38,100, slightly below its yearly high of $38,400 achieved on Friday, November 24. However, this is just one of the many milestones BTC has achieved during its ongoing bullish resurgence.

Bitcoin Achieves New 52-Week Closing Record

According to crypto trading firm The Birb Nest, Bitcoin has set a new 52-week closing record by a small margin, holding above $32,000 for four consecutive weeks, demonstrating the continued strength of the uptrend. 

Per the firm’s analysis, the observed performance aligns with the principles of Elliott Wave Theory and signifies the presence of the third wave within the ongoing bull market.

Notably, of the five waves outlined in the theory, the third impulse wave is a visually captivating and crucial element of the overall pattern.

Bitcoin

Following the consolidation phase of the second wave that Bitcoin experienced between August and October, as seen on the 1-day chart of BTC above, the emergence of the third wave is characterized by a breakout that drives price action in line with the prevailing trend.

In particular, this wave is known for its extended nature, which often exceeds the length of the first wave, which began at the beginning of January 2023 for BTC.

The third wave exhibits a substantial extension relative to the length of the initial wave, typically reaching the 161.8% Fibonacci level. In simpler terms, the third wave can be interpreted as a 161.8% Fibonacci extension of the first wave.

Solid Support Levels Reinforce Positive Outlook For BTC 

According to The Birb Nest, key technical indicators further support Bitcoin’s market momentum. The 200-week moving average (MA) at $29,130 and the 50-week MA at $27,450 serve as solid support levels, reinforcing the positive outlook for the cryptocurrency.

Additionally, Bitcoin’s correlation coefficient has risen to 0.75, indicating an increased synchronization with the performance of the S&P 500. This correlation can be viewed as a positive sign, particularly as the S&P 500 and Nasdaq enter their ‘Best Months’ strategy, which historically has been associated with market gains.

Furthermore, the firm believes that anticipation surrounding the upcoming Bitcoin halving event and the potential approval of a Bitcoin spot exchange-traded fund (ETF) is fueling investor interest. These factors hint at the potential for further market upturns and provide an optimistic outlook for Bitcoin’s future.

It remains to be seen if the current bullish momentum will be sustained and if BTC can consolidate above $38,000 and target the $40,000 level yet to be reached in 2023.

Featured image from Shutterstock, chart from TradingView.com 

Bitcoin Sees Influx Of Over $1.5 Billion In 2023: Price Surge Aims For $43,000

Amidst the regulatory scrutiny and enforcement actions faced by the cryptocurrency industry, Bitcoin (BTC), the leading cryptocurrency by trading volume, has remained resilient and maintained its consolidation level between $36,000 and $37,000. It reached a new record for the year, surging to a new yearly high of $38,390 on Friday.

$312 Million Inflows Amid Spot-Based ETF Expectations

The latest report from CoinShares provides further evidence of Bitcoin’s robustness. Despite concerns that the regulatory feud involving Binance might trigger a sell-off of BTC, the report reveals a significant influx of capital into digital asset investment products. 

Last week, these products witnessed a notable inflow of $346 million, marking the largest weekly inflows observed during a nine-week consecutive run.

The CoinShares report highlights that the surge in inflows can be attributed to the anticipation surrounding the potential launch of a spot Bitcoin exchange-traded fund (ETF) in the United States, which has been eagerly awaited by investors but delayed by the US Securities and Exchange Commission (SEC).

Interestingly, this surge is the largest since the bull market of late 2021. CoinShares reports that the combination of rising prices and inflows has pushed total Assets Under Management (AuM) to $45.3 billion, the highest level seen in over a year and a half.

Bitcoin

Bitcoin’s inflows last week amounted to $312 million, bringing year-to-date inflows to just over $1.5 billion. Meanwhile, short-sellers are capitulating, with outflows totaling $0.9 million for the third consecutive week. 

Since the peak in April 2023, AuM has declined by 61%. The use of exchange-traded Products (ETPs) to gain exposure to the asset class remains significant, with ETP volumes representing 18% of total spot Bitcoin volumes last week.

Ethereum (ETH) also experienced a positive shift in sentiment, with inflows of $34 million last week and a four-week run of $103 million. This marks a turnaround from the outflows observed earlier this year. 

Furthermore, other cryptocurrencies such as Solana (SOL), Polkadot (DOT), and Chainlink (LINK) saw inflows totaling $3.5 million, $0.8 million, and $0.6 million, respectively.

Ichimoku Cloud Predicts Bitcoin Surge To $43,000

In a bold prediction backed by technical analysis, renowned crypto analyst “Crypto Con” suggests that Bitcoin (BTC) is poised for a significant surge in the coming weeks. 

Crypto Con claims to have accurately predicted BTC’s previous rise to $38,000 two months before it occurred, using the weekly Ichimoku cloud. Now all eyes are on the completion of the current upward move, with the initial target set at $43,000.

For further context, the Ichimoku cloud is a popular technical indicator used to gauge potential future price trends and identify key support and resistance levels. According to Crypto Con, the weekly Ichimoku cloud has projected a bullish cross shortly, indicating that Bitcoin’s upward trajectory is far from over.

Bitcoin

Based on historical data, Crypto Con notes that the completion of previous Bitcoin rallies following a similar cross has taken anywhere from 7 to 11 weeks, with an average duration of 10 weeks. Consequently, the analyst expects the current move to culminate in early January.

When the rise reaches its peak, Crypto Con suggests that the top of the red cloud, a key feature of the Ichimoku cloud, becomes the primary target. While the analyst identifies $43,200 as the most conservative level for this target, Crypto Con asserts that the red cloud’s true top could reach as high as $48,000.

Bitcoin

Featured image from Shutterstock, chart from TradingView.com 

Crypto Market Cap Soars: $1.5 Trillion Milestone Achieved, Bitcoin Sets New Record

Bitcoin (BTC) and the cryptocurrency market have seen a significant uptrend, hitting a new annual high and surpassing $1.45 trillion, paving the way for potential gains in the final days of November.

Notably, BTC, the largest cryptocurrency in the market, has achieved a remarkable milestone, approaching the $40,000 level with a price surge to $38,400. 

The catalysts behind this recent surge include the anticipated acceptance of the BlackRock Bitcoin Spot exchange-traded fund (ETF) within the next 45 days and speculation that BlackRock itself may influence Bitcoin’s price through significant buying pressure on Coinbase.

BlackRock Driving BTC’s Recent Price Surge? 

According to CoinGecko, the global cryptocurrency market cap currently stands at $1.5 trillion, reflecting a 2.05% change in the last 24 hours and an impressive 72.26% change compared to the same period last year. 

This surge in market capitalization has not only boosted Bitcoin but has also contributed to gains in other major cryptocurrencies within the Top 100, such as Blur (BLUR), which soared a staggering 27%, Mina Protocol (MINA), which gained 9%, and Bittensor (TAO), which has seen a 14% surge in the last 24 hours, to name a few.

Regarding the recent surge of BTC to a new yearly high, crypto expert known by the pseudonym “Crypto Rover” has shed light on potential catalysts driving the recent surge. According to Rover, the BlackRock Bitcoin Spot ETF launch is expected to occur within the next 45 days.

In this regard, Rover’s analysis suggests that BlackRock, the world’s largest asset manager, may play a role in Bitcoin’s recent surge. The speculation is based on the observation that a significant amount of Bitcoin buying pressure appears to be coming from Coinbase, the largest cryptocurrency exchange in the United States, with the platform serving as BlackRock’s custodial partner. 

Promising Bitcoin Price Targets For Late 2025

Renowned crypto analyst Crypto Con has unveiled what he claims to be the most accurate Log Regression Curves for Bitcoin to date. These curves have provided insights into the future cycle top, an elusive aspect of Bitcoin analysis. 

According to projections derived from the curve matching technique, late 2025 could witness two potential price targets for Bitcoin: $130,000, referred to as Layer 6, and Layer 7, with a target price of $180,000.

Bitcoin

The analyst says several models and projections support the $130,000 target, adding to its credibility. According to Crypto Con, even the most conservative estimate, known as Layer 5 at $94,000, seems less likely. 

Based on historical trends, it is improbable that the entire red band, representing potential price ranges, would fail during this cycle. Therefore, one of the projected targets is expected to be accurate.

Based on the available information, Crypto Con favors layer 6 at $130,000 as the more likely target for Bitcoin’s late 2025 price surge. This projection aligns with the Halving Cycles Theory, suggesting a timeframe of approximately 21 days from November 28th, 2025.

Bitcoin

Bitcoin has undergone a recent pullback within the last hour following its attainment of a new yearly high. As of now, it is trading at $37,800.

Featured image from Shutterstock, chart from TradingView.com 

Bitcoin Bulls Buckle Up: Seasonal Trends Point To $50,000 Target

Bitcoin (BTC), the largest cryptocurrency on the market, has again failed to consolidate and reach the $38,000 level for the third time, as it is currently experiencing a 3% pullback. This has led the community to speculate that a significant retracement may occur before the bullish momentum resumes and the next uptrend begins. 

However, renowned crypto analyst Adrian Zduńczyk has recently shed light on Bitcoin’s potential next target of $50,000. Zduńczyk’s analysis considers several crucial factors, including the prevailing bullish market sentiment, the ongoing uptrend, the short-term outlook, miner sentiment, and seasonal trends. 

Evidence Of Dominant Bull Market

Zduńczyk notes that the cryptocurrency industry is in a bull market, with Bitcoin reaching a new 52-week high close and experiencing the third wave of the bullish cycle. The correlation between Bitcoin and the S&P 500 has risen, indicating a favorable environment for Bitcoin. High time frame trends are also rising.

Zduńczyk identifies key macro support levels for Bitcoin at $29,000 and $27,000, highlighting growing demand fueled by the anticipation of the approval of spot Bitcoin exchange-traded funds (ETFs) and the upcoming halving event expected in April 2024.

Notably, the daily chart for BTC remains in an uptrend, according to Zduńczyk. He points to a target of $40,000, supported by the appearance of a “golden cross” pattern.

Furthermore, Zduńczyk believes that the rising Simple Moving Average (SMA) 200 serves as “irrefutable evidence” of a dominant bull market since January. These indicators suggest a continuation of the upward trajectory for Bitcoin.

Zduńczyk also identifies key support levels at $35,000 to $35,800, emphasizing that a bullish sentiment prevails as long as Bitcoin remains above these levels. 

Zduńczyk Eyes Bitcoin November Target Of $50,000

Currently, Bitcoin is ranging between $35,500 and $38,000, Zduńczyk notes that the momentum bands are widening, indicating an increase in volatility. The rising 50-day Average True Range (ATR) trend supports this observation.

Fear & Greed Index stands at 69, indicating a mixed sentiment among market participants. Miners, on average, are enjoying a profit increase of 23%. Zduńczyk maintains a positive outlook based on these factors. 

Regarding seasonal trends, October demonstrated a gain of 27%, exceeding the average performance. Historically, November has been the best month for Bitcoin, which has an average gain of 43%, with a target of around $50,000. Notably, December typically adds 7% to November’s closing price.

Bitcoin

Currently, BTC is trading at $36,400, reflecting a 5% and 22% profit over the past fourteen and thirty days, respectively. The focus now shifts to whether BTC’s price can maintain its crucial support levels and sustain its bullish uptrend, potentially reaching the $50,000 milestone supported by historical patterns.

Featured image from Shutterstock, chart from TradingView.com 

Bearish Divergence? Bitcoin Price Rises, But Network Growth Sends Warning Signals

The recent Bitcoin (BTC) price surge has ignited renewed interest and confidence among investors, leading many to believe that the BTC bull run is accelerating. 

According to trader and crypto analyst Adrian Zduńczyk, Bitcoin has reached a new 52-week closing high and has maintained a close above the previous high of $32,000 for three consecutive weeks. 

This sustained upward momentum indicates a strong bullish trend sentiment and signals the beginning of the third wave of the Bitcoin bull run.

Analyst Highlights Key Trends

Zduńczyk points out several dominant trends that contribute to the positive outlook for Bitcoin. The rising 200-week and 50-week moving averages (MAs) highlight the long-term uptrend strength, with key support levels at $28,800 and $26,600. 

Additionally, there is a growing correlation with the S&P 500, as evidenced by the 7-week correlation coefficient of 0.34. This alignment with traditional markets suggests that Bitcoin increasingly trades similarly to the Nasdaq.

Fundamental drivers also play a significant role in Bitcoin’s upward trajectory. Traders eagerly anticipate the approval of spot Bitcoin exchange-traded funds (ETFs) and the upcoming fourth halving event. 

Furthermore, according to Zduńczyk, the historical pattern of previous halvings indicates that Bitcoin has rallied significantly after each halving and has never retraced to pre-halving prices. 

Examining the daily trend, Zduńczyk highlights the technical strength demonstrated by Bitcoin’s reliable breakout above $32,000. Breakouts often lead to new trend formations that persist over time. 

Despite occasional volatility, the 50-day average true range (ATR) trend and the 50-day relative strength index (RSI) momentum trend are rising, indicating ongoing positive momentum.

Bitcoin’s future appears promising, supported by positive market trends, fundamental drivers, and technical indicators. However, warning signs cast doubt on Bitcoin’s favorable outlook, as renowned crypto analyst Ali Martinez pointed out

Bitcoin Bullish Momentum At Risk?

Martinez draws attention to the bearish divergence between Bitcoin’s price and network growth, indicating a potential lack of sustained momentum in the ongoing uptrend.

Bitcoin

The chart above shows a notable disparity between the exponential rise in Bitcoin’s price and the dramatic decline in new addresses over recent days. 

This bearish divergence raises concerns about the overall strength of the current uptrend. While Bitcoin’s value has experienced significant gains, the number of new addresses created has decreased significantly.

According to Martinez, this bearish divergence between Bitcoin’s price and network growth serves as an on-chain sell signal that traders should be aware of. The slowdown in network growth despite the price surge suggests that the current upward momentum may not have enough strength to sustain.

Bitcoin

At the time of writing, BTC is trading at $36,200, down 1.6% over the past 24 hours. However, it is still up a substantial 4.6% over the past 7 days. 

It remains to be seen if a surge in new addresses will be able to support BTC’s bullish momentum and break the current consolidation phase. Alternatively, the cryptocurrency could retest support levels in the coming days.

Featured image from Shutterstock, chart from TradingView.com

MicroStrategy’s Bitcoin Portfolio Soars Past $5 Billion As BTC Holds Firm At $34,000

In a remarkable turn of events for the business intelligence (BI) company MicroStrategy, the recent bullish momentum of Bitcoin (BTC) has resulted in significant profits and a resurgence for the company. 

MicroStrategy has returned on a profitable trajectory after a prolonged period of market downturn and losses suffered by companies with cryptocurrency holdings.

MicroStrategy’s Bitcoin Holdings Surge 

Just a month ago, MicroStrategy and its subsidiaries made a strategic move by increasing their BTC holdings. According to a filing with the US Securities and Exchange Commission (SEC), the company, co-founded by renowned investor Michael Saylor, added 5,455 BTC to their portfolio, valued at $147 million.

As of the time of writing, MicroStrategy’s Bitcoin holdings stand at a staggering 158,245 BTC, with a total valuation of approximately $4.68 billion. 

Over the past 24 hours, Bitcoin has experienced a remarkable upswing, breaking through a long consolidation phase above $27,000 and reaching a new 2023 high. With a significant surge of 12.2%, BTC peaked at $35,300. This surge has unlocked substantial unrealized profits for MicroStrategy.

According to Lookonchain, MicroStrategy’s Bitcoin holdings have generated an estimated unrealized profit of around $746 million. 

With BTC’s skyrocketing price, MicroStrategy’s strategic accumulation of 28,560 BTC since May 2022, at an average price of $25,707, has proven profitable. 

Bitcoin

MicroStrategy’s success in capitalizing on the recent price surge of Bitcoin highlights the company’s strategic approach and belief in the long-term value of the cryptocurrency. 

By significantly increasing their Bitcoin holdings, MicroStrategy has positioned itself to benefit from BTC’s continued growth and adoption.

BTC Bears Crushed As $300 Million In Shorts Liquidated

The cryptocurrency market witnessed a stunning surge, resulting in a staggering $100 billion addition to its total market capitalization within a single day. This rapid ascent also triggered a wave of liquidations amounting to over $400 million, with shorts accounting for a significant portion of the losses. 

With BTC experiencing a 12% price increase, this led to the liquidation of more than $180 million in short positions out of a total of $222 million in BTC liquidations. 

Ethereum (ETH) traders also saw a significant loss of $60 million, with $44 million coming from those anticipating a price drop, according to data from CoinGlass.

Most of these liquidations, totaling $317 million, occurred within the last 12 hours, with short sellers accounting for a substantial 76% ($241 million) of the total losses. 

Concurrently, trading volumes for the top three cryptocurrencies on the derivatives market witnessed significant growth. 

Bitcoin’s volume experienced a remarkable 221% surge, while Ethereum and XRP saw a 108% increase in trading activity. As a result, approximately 95,000 traders faced liquidation during this period of intense market volatility.

Scott Melker, an investor and host of a cryptocurrency podcast, commented on the situation, stating:

Bitcoin bears have been left reeling as the market witnessed an extraordinary rally, resulting in massive liquidations of short positions. This surge has caught many traders off guard, leading to substantial losses in a short period.

Bitcoin

Featured image from Shutterstock, chart from TradingView.com 

Time To Cash Out? Bitcoin’s 4-Hour RSI Triggers Sell Indicator

Bitcoin (BTC) has retraced to the $28,400 level following a failed breakout above $30,000, resulting in a high rate of liquidations for both long and short positions. 

Additionally, the recent fake news surrounding the approval of Blackrock’s spot Bitcoin Exchange-Traded Fund (ETF) by the US Securities and Exchange Commission has disrupted the upward trend and introduced new bearish indicators in the Bitcoin market.

RSI Screams Sell

Renowned trader and crypto analyst Ali Martinez suggests selling BTC based on its 4-hour chart Relative Strength Index (RSI) indicator. His simple trading strategy advises selling BTC when the RSI exceeds 74.21 and buying when the RSI dips below 30.35.

Bitcoin

As seen in the chart above, BTC’s RSI stands at the 74 level, which is notably high considering that on October 16, after the spread of the fake news on various platforms, including X (Formerly Twitter), the RSI reached as high as 82.83.

While this indicator may seem straightforward, it has proven effective on BTC’s 4-hour chart. For instance, on October 1st, Bitcoin peaked at $28,500, but after the RSI climbed above 80, the leading cryptocurrency swiftly dropped to $27,150 within hours.

Although the effectiveness of these indicators is not always guaranteed, the combination of the recent false pump, the ongoing retrace evident in all BTC charts, the lack of bullish momentum, and the prevailing market sentiment of fear, doubt, and uncertainty could create the perfect storm for BTC to retest lower support levels before potentially embarking on another upward movement.

Bitcoin Pre-Halving Retracements Sound Alarm Bells

To further support Ali Martinez’s bearish thesis, renowned crypto analyst Rekt Capital recently shed light on Bitcoin’s historical retracements approximately 180 days before halving events

According to Rekt, in 2015/2016, approximately 180 days before the halving, Bitcoin experienced a retracement of -25%. Similarly, in 2019, around the same timeframe before the halving, Bitcoin retraced by -38%. 

While Rekt Capital identifies as a macro bull, he acknowledges that historical data favors bearish trends before halving events. 

This observation raises the question of whether history will repeat itself in 2023. Will Bitcoin witness a significant retracement similar to previous cycles, or will the market dynamics 2023 deviate from historical patterns?

What is certain is that as the crypto community eagerly anticipates the 2023 halving, uncertainty looms regarding Bitcoin’s price behavior leading up to the event.

Bitcoin

As of the current market conditions, BTC is trading at $28,400, indicating a profitable position across all time frames. In the past 24 hours, Bitcoin has experienced a modest increase of 1%.

Over the seven, fourteen, and thirty-day periods, BTC has recorded profits of 3.7%, 4%, and 7%, respectively, despite the earlier bearish factors. The sustainability of Bitcoin’s current price level remains uncertain, as it remains to be seen whether it will withstand potential retracements soon.

Featured image from Shutterstock, chart from TradingView.com 

Nearly 375k BTC Has Left Coinbase Since April 2020, New Report Reveals

The overall balance on Coinbase, the publicly traded digital exchange, has dropped by about 36.6 percent in the last 24 months due to huge BTC outflows.

Reports Shows BTC Exchange Supply Has Decreased

The overall Bitcoin balance on Coinbase has reached roughly 650,000 coins, according to Glassnode, a notable on-chain analytics platform, compared to an all-time high of 1,025k BTC in April 2020.

Coinbase’s balance has dropped by about 30k BTC in the last week. Since April 2020, bitcoin outflows from digital asset trading platforms have been increasing. In the last two years, the quantity of BTC on exchanges has decreased dramatically.

Glassnode mentioned in its weekly on-chain analysis report:

“This outflow has dropped the total balance held on Coinbase to 649.5k BTC, bringing it back to levels last seen at the 2017 bull market top. The total Bitcoin balance held by Coinbase has now declined by 375.5k BTC (36.6%) from the ATH reached in April 2020. Large outflows like this one are actually part of a consistent trend in the Coinbase balance, which has been stair-stepping downwards over the last two years.”

Nearly 10.8% of the active Bitcoin supply is now held by crypto exchanges throughout the world, the lowest amount in the last three years. Over the last year, the supply has decreased by more than 3%. On the other side, BTC’s illiquid supply has risen to 76 percent, the highest level in ten months.

Glassnode stated the following while discussing current market dynamics and BTC’s price action:

“Bitcoin prices continue to consolidate this week, compressing into an increasingly tight range between a low of $37,274, and a high of $42,455. As was covered in the previous edition, the market currently exists in a delicate balance, amidst a backdrop of high macro and geopolitical uncertainty playing out on the global stage.”

Related Reading | Russian Cryptocurrency Volumes Across Several Exchanges Dip By 50%

Price Falls

Bitcoin (BTC) had another brief short squeeze overnight on March 15, with bulls aiming to break through the $40,000 resistance level.

Massive liquidity exists above the $45K resistance level, as well as below the $34K support zone, based on market behavior throughout this period, as seen below. Before a possible healthy surge, the market normally absorbs the liquidity.

The market is nervous ahead of tomorrow’s FOMC meeting, which will make important decisions about interest rates and the growth/printing of the US money supply.

BTC/USD month chart. Source: TradingView

If the direction is upward, the first big barrier is the marked descending trendline seen on the RSI indicator; conversely, if the direction is downward, the first major resistance is the marked descending trendline shown on the RSI indicator (the lower section of the following chart).

As a result of the recent squeeze higher, data from on-chain monitoring resource Coinglass showed minor shakeouts – BTC liquidations totaled $47 million over 24 hours.

Crypto liquidations chart. Source: Coinglass

The price movement, based on the daily close, also put an end to prospects of a more optimistic outcome.

Related Reading | Bitcoin MPI Rises To Highest Value Since March 2021, Bull Rally Soon?

Featured image from Admiral Markets, chart from TradingView.com

Bitcoin Slips Back To 38k, Further Downside Incoming?

Bitcoin slide to $37,000 on March 7 sparked some purchasing interest, resulting in a price bounce to $39,000 on March 8. Surprisingly, the upward sloping trendline that served as an accumulation zone for traders in 2022 was the origin of the upside retracement move.

Price Fall Signals Retracement

Bitcoin price established another lower high on the 4-hour chart, showing that bears are still in control and that more loss is likely.

Today is set to provide a breath of relief and let some steam out of the pressure cooker that is Ukraine, with global markets still anxious and on edge. As this favorable news is picked up and turned into another round of bullish uplift for the cryptocurrency, expect more decompression going into the U.S. session.

Over the last few days, bitcoin’s price has suffered a significant retreat from its latest major swing high of $45,600. The initial decline of roughly 15% sent BTC/USD to $39,000, and the pair was tested further on the negative over the weekend.

BTC/USD 4-hour chart. Source: TradingView

Despite being mildly oversold at 45.6, the 14-day RSI appears to be headed for the 47 level, which has previously served as resistance.

If price strength reaches this level, BTC/USD will likely trade towards the $40,000 barrier, with a breakout likely to rekindle bullish sentiment.

Despite bears probing the downside again yesterday, bearish momentum has slowed.

Related Article | Risk Aversion Pulls Crypto Market Down, Bitcoin Still Below $40K

Bitcoin May See Upside

In his latest view, Rekt Capital noted the successful retest of the trendline, speculating that the move might push Bitcoin above $43,100 in the near future, assuming it breaks above the green dashed diagonal resistance shown in the chart below.

BTC/USD weekly price chart. Source: Rekt Capital, TradingView

Throughout Q1/2022, Bitcoin remained trapped in a trading range — between $34,000 and $45,000 — indicating an interim positive outlook. BTC was able to withstand significant selloff pressure as a result of persistent macroeconomic and geopolitical concerns, such as expectations of rate hikes and the armed conflict between Russia and Ukraine.

Last weekend, Filbfilb, the creator of trading platform DecenTrader, said that “Bitcoin is rangebound on a macro level,” but that its long-term structure suggests it would break to the upside.

“In the immediate term, if the 50 DMA and 3-day level can prove to be supported, a retest of the $43K and high timeframe level could occur,” said Flibflib, adding that a further break above Bitcoin’s yearly pivot level of $48,000 would be “very significant and implicit of a fundamental change.”

Related Reading | Crypto Markets Slightly Recover After Weekend Decline

Featured image from iStock Photo, chart from TradingView.com