Bitcoin Price Surges Towards $61,000, Eyeing Potential Breakout To $67-$68k Range

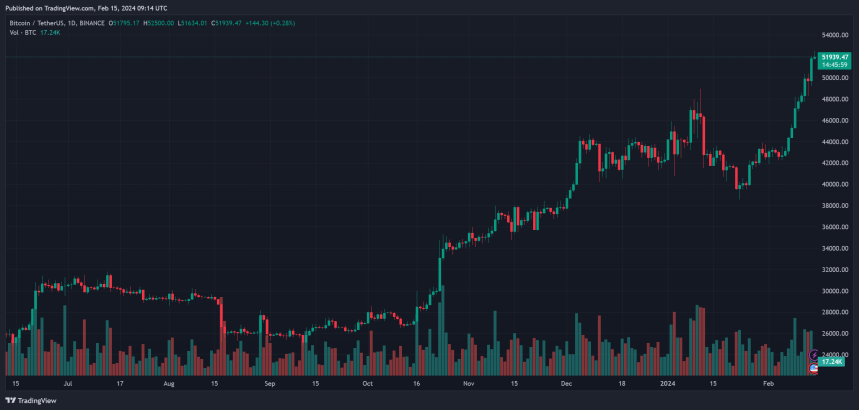
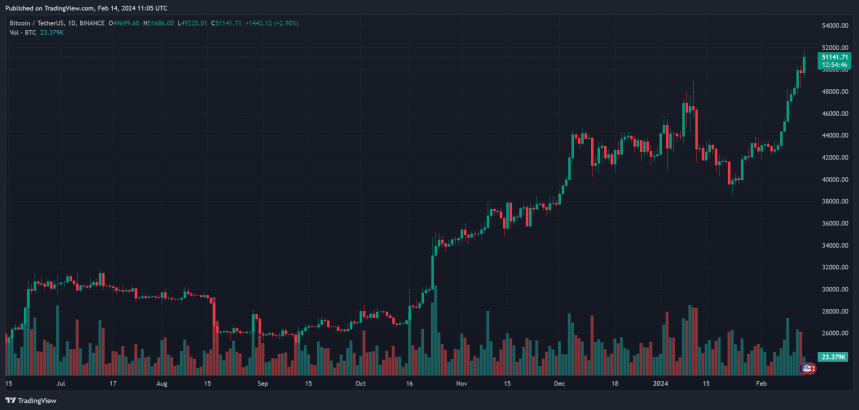
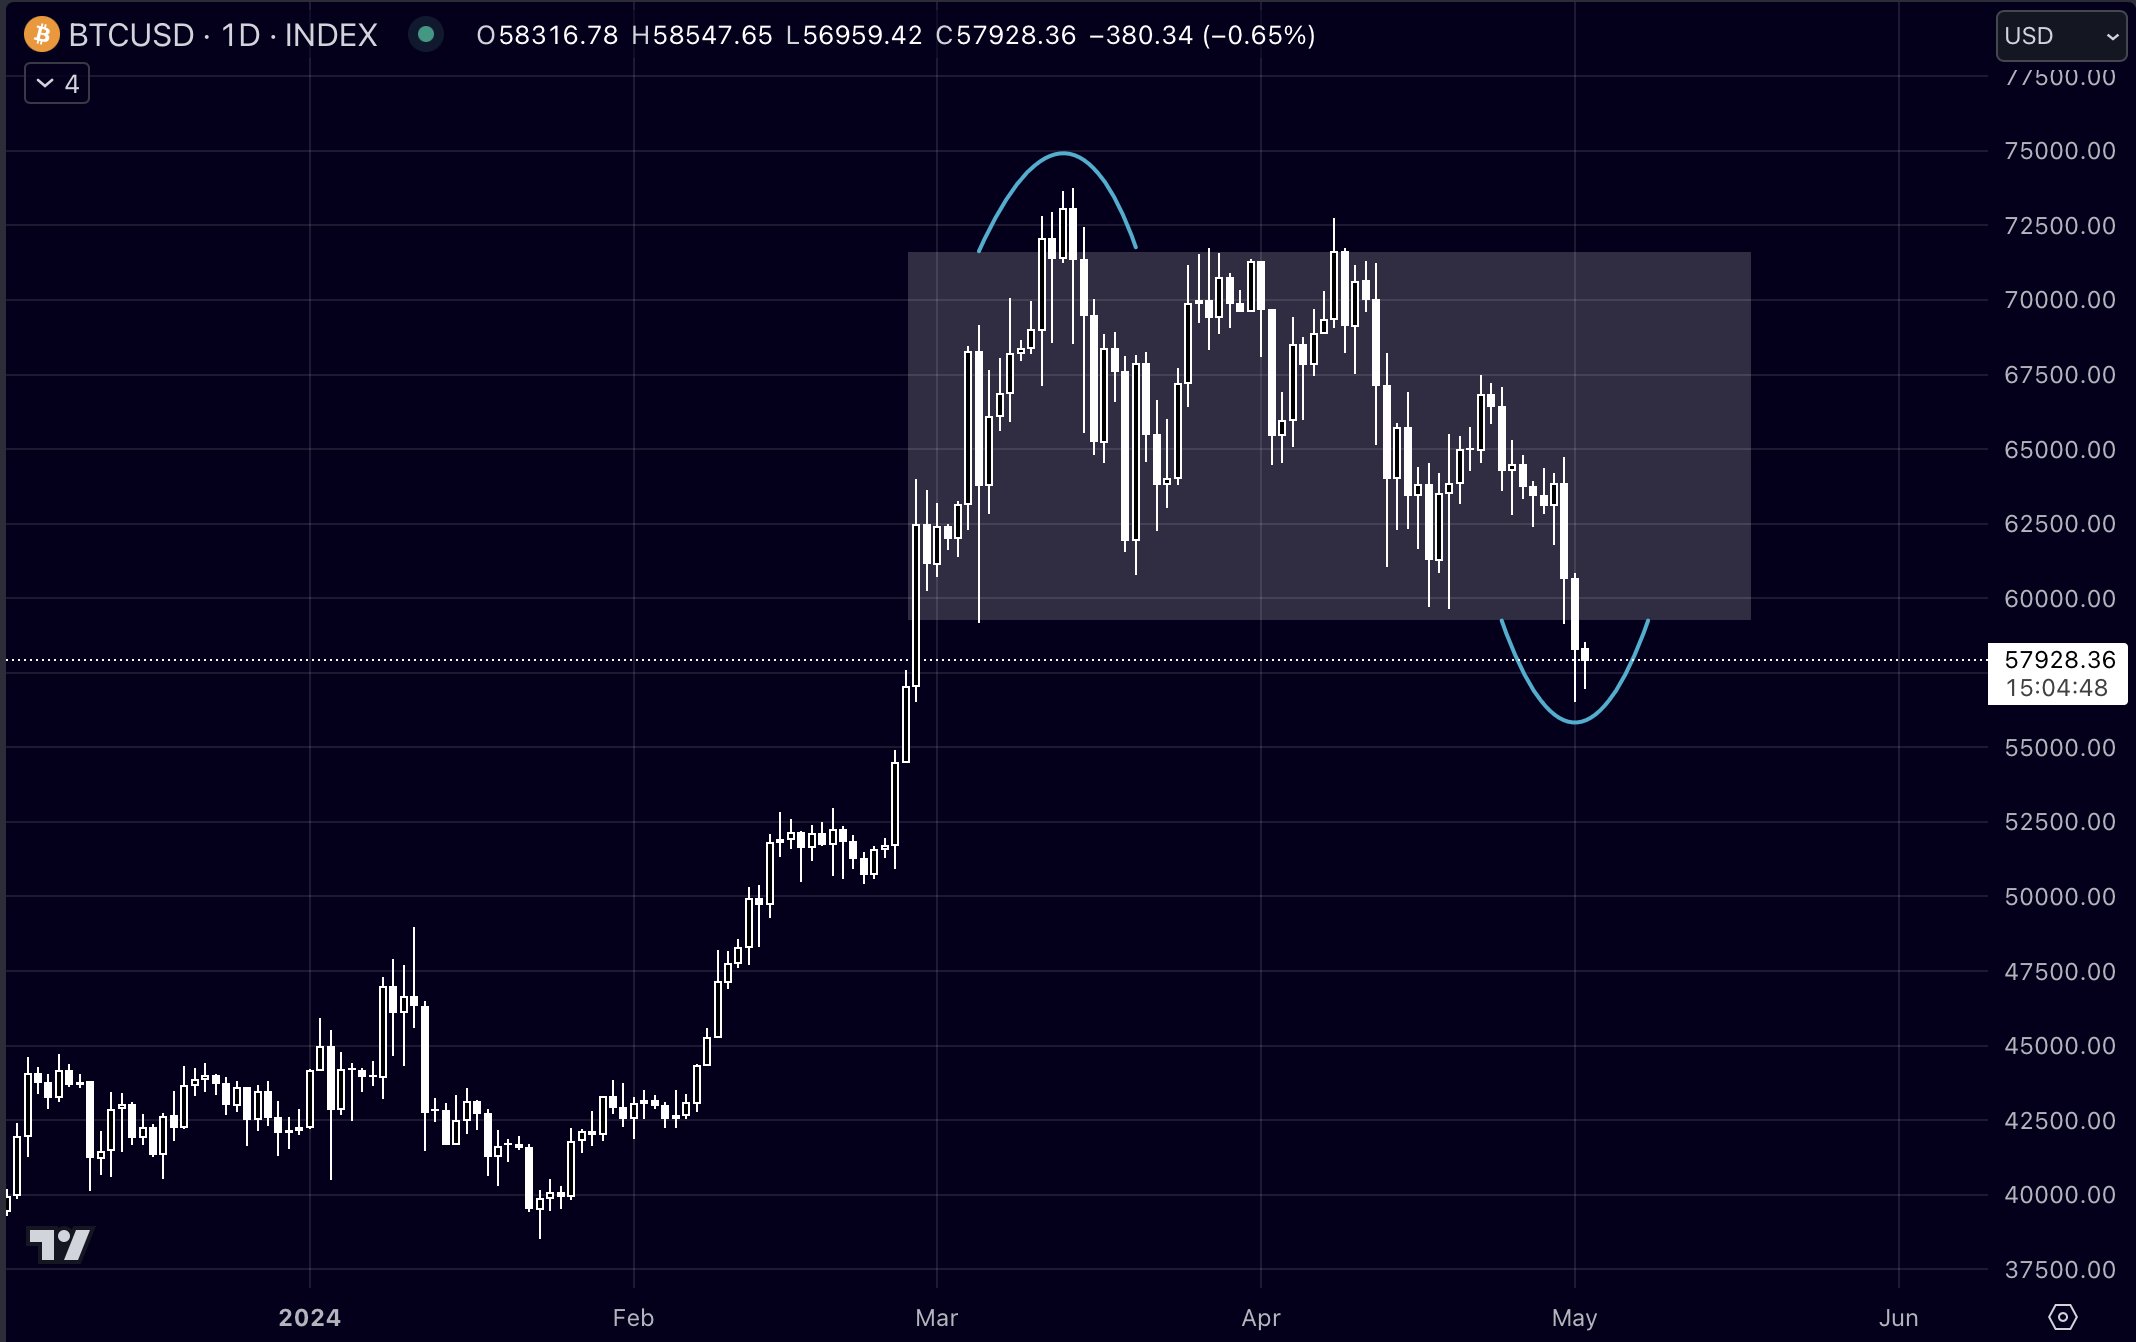
Bitcoin (BTC), the largest cryptocurrency in the market, has experienced a notable resurgence in its bullish momentum, with the Bitcoin price reclaiming the crucial $61,000 threshold. 

This recovery follows a week-long downtrend that led to a 20% drop to $56,000 on Wednesday. As the bullish momentum returns, the possibility of further testing upper resistance levels and reclaiming previously lost price levels grows stronger.

Bitcoin Bulls Eye $68,000

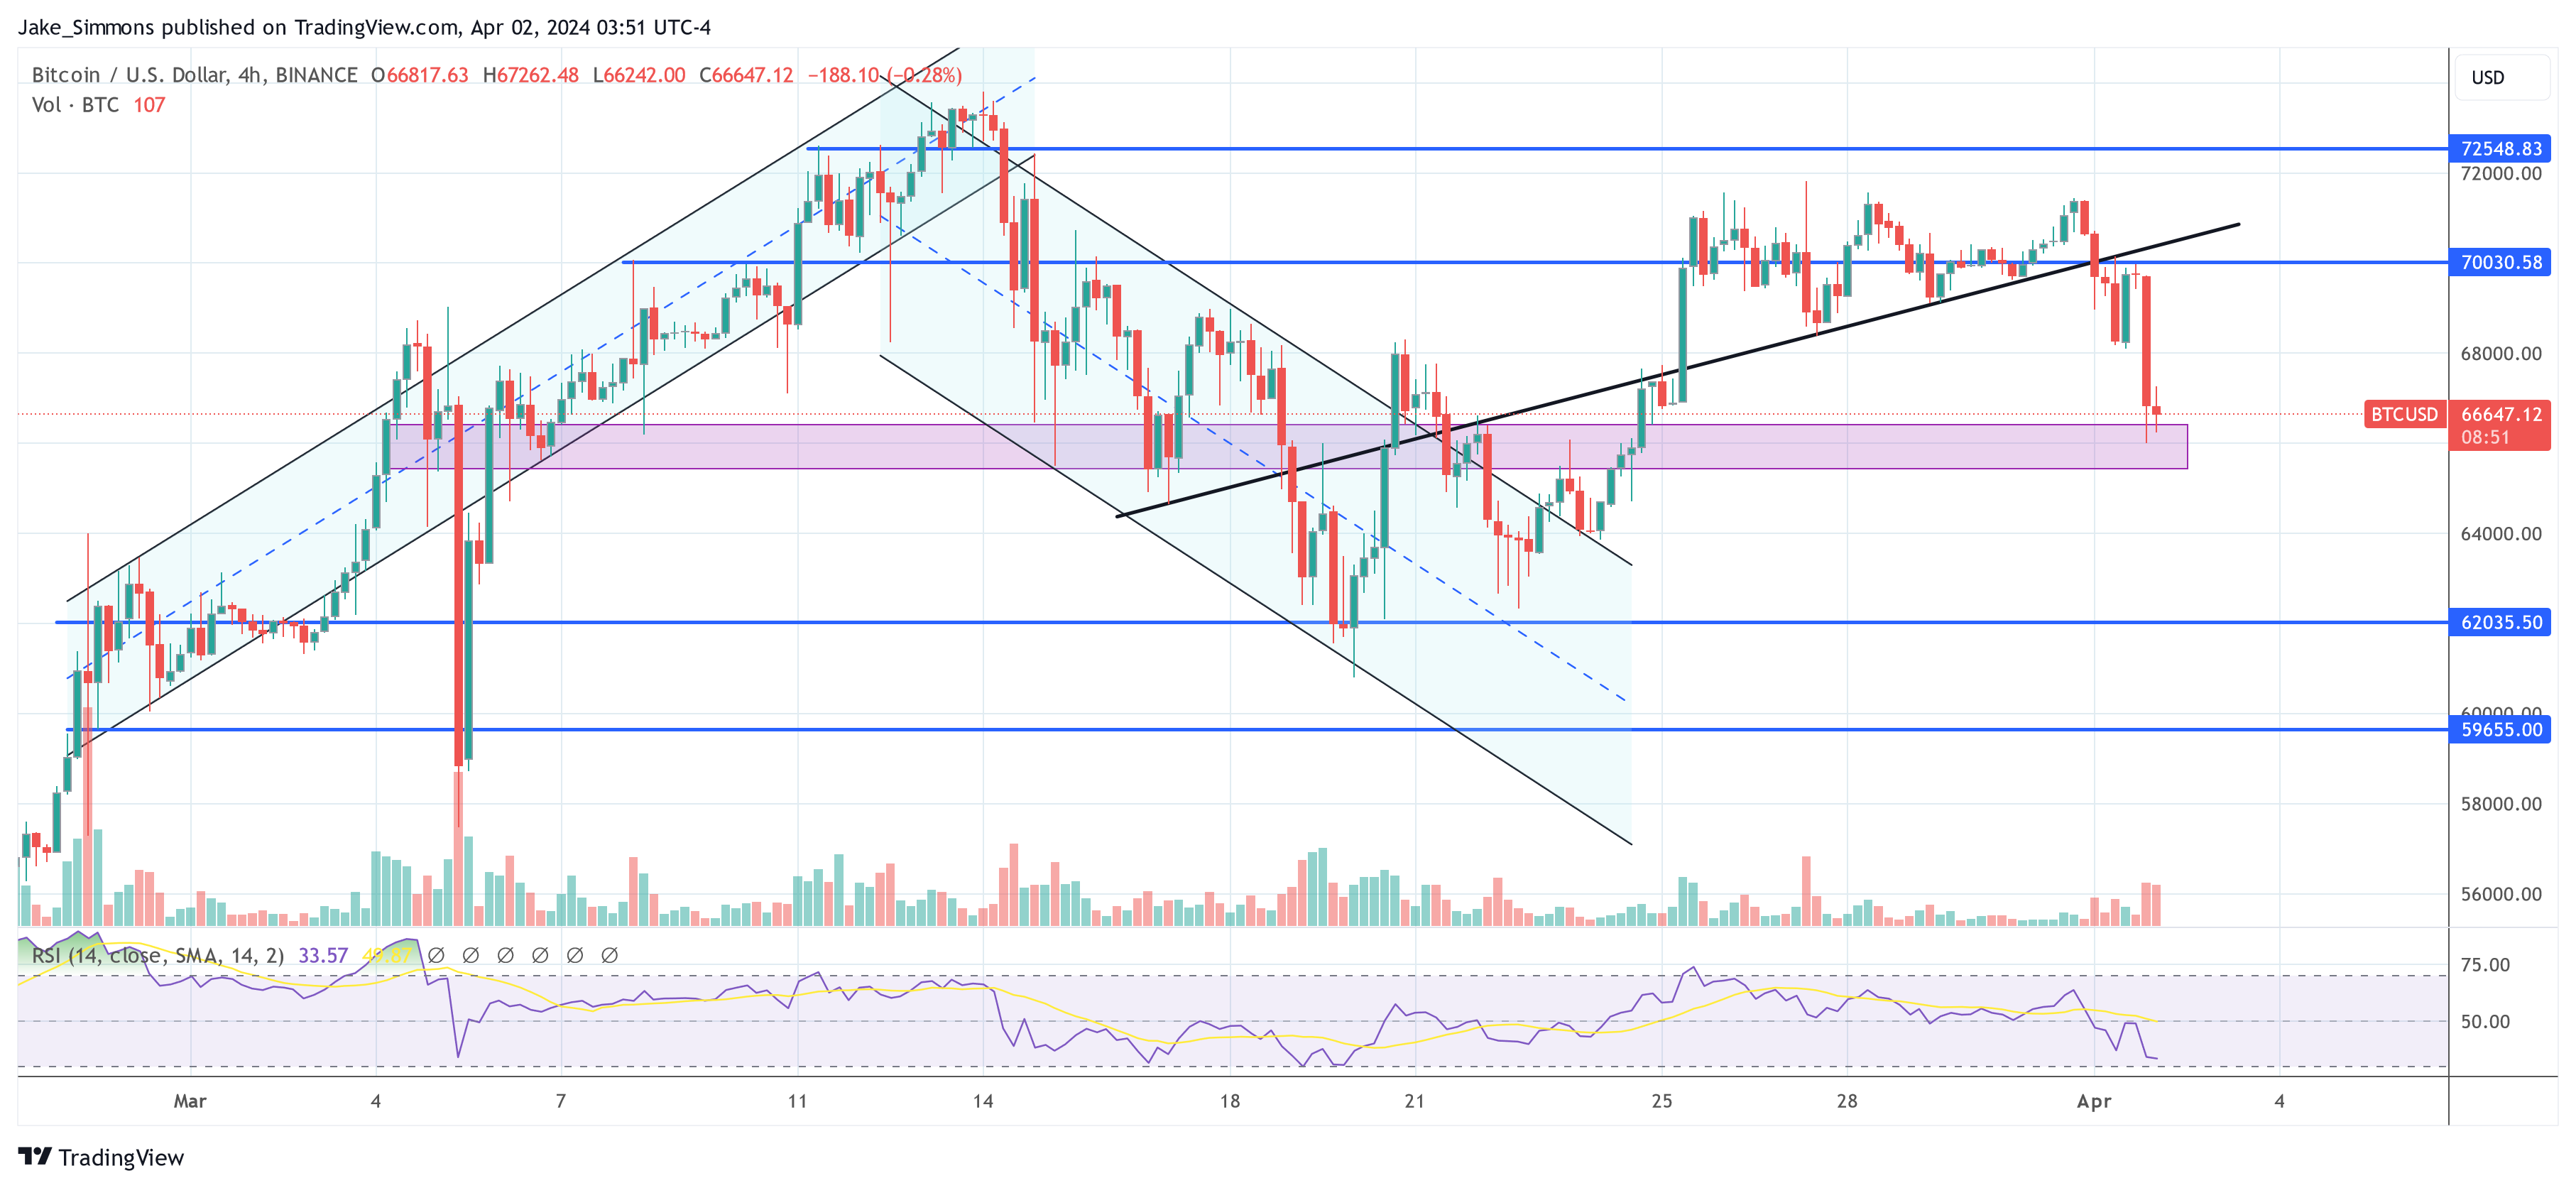
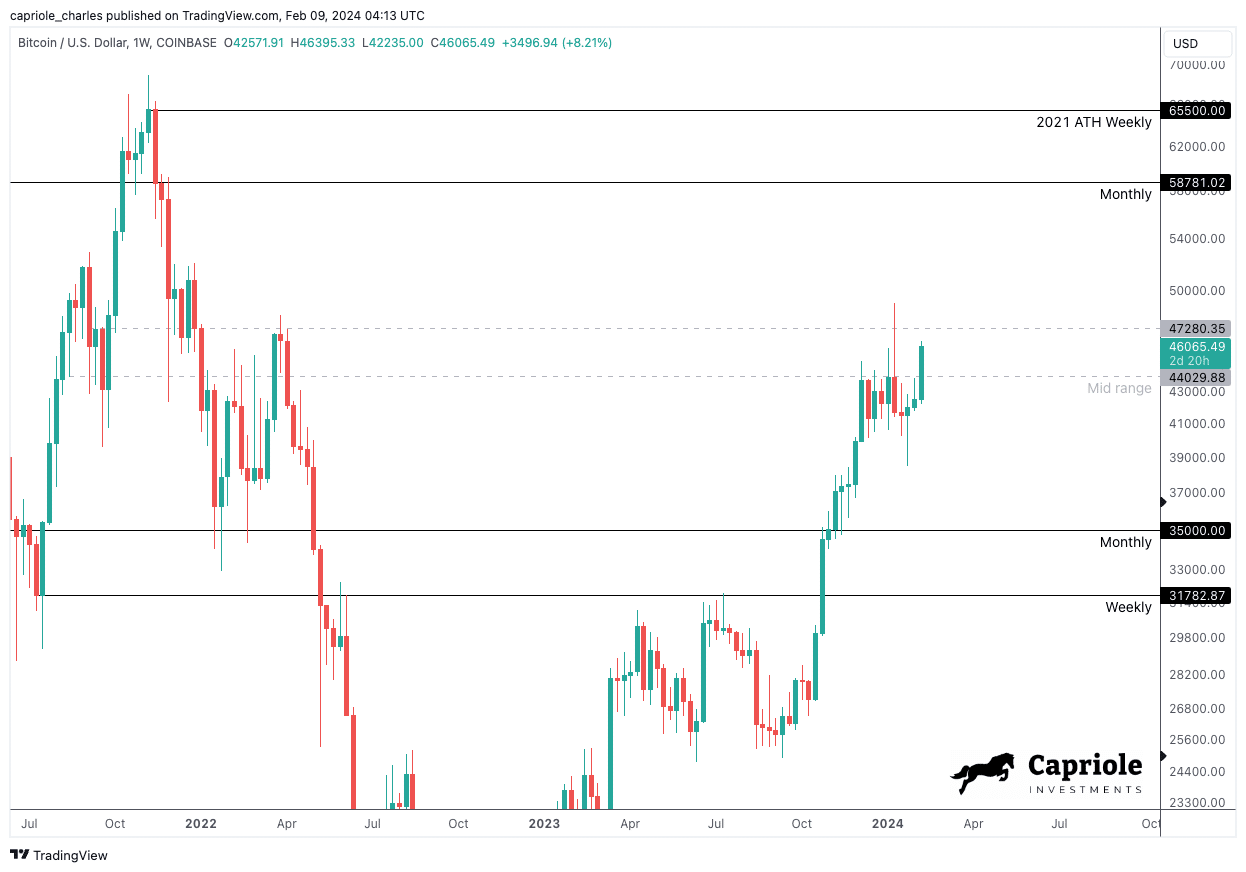
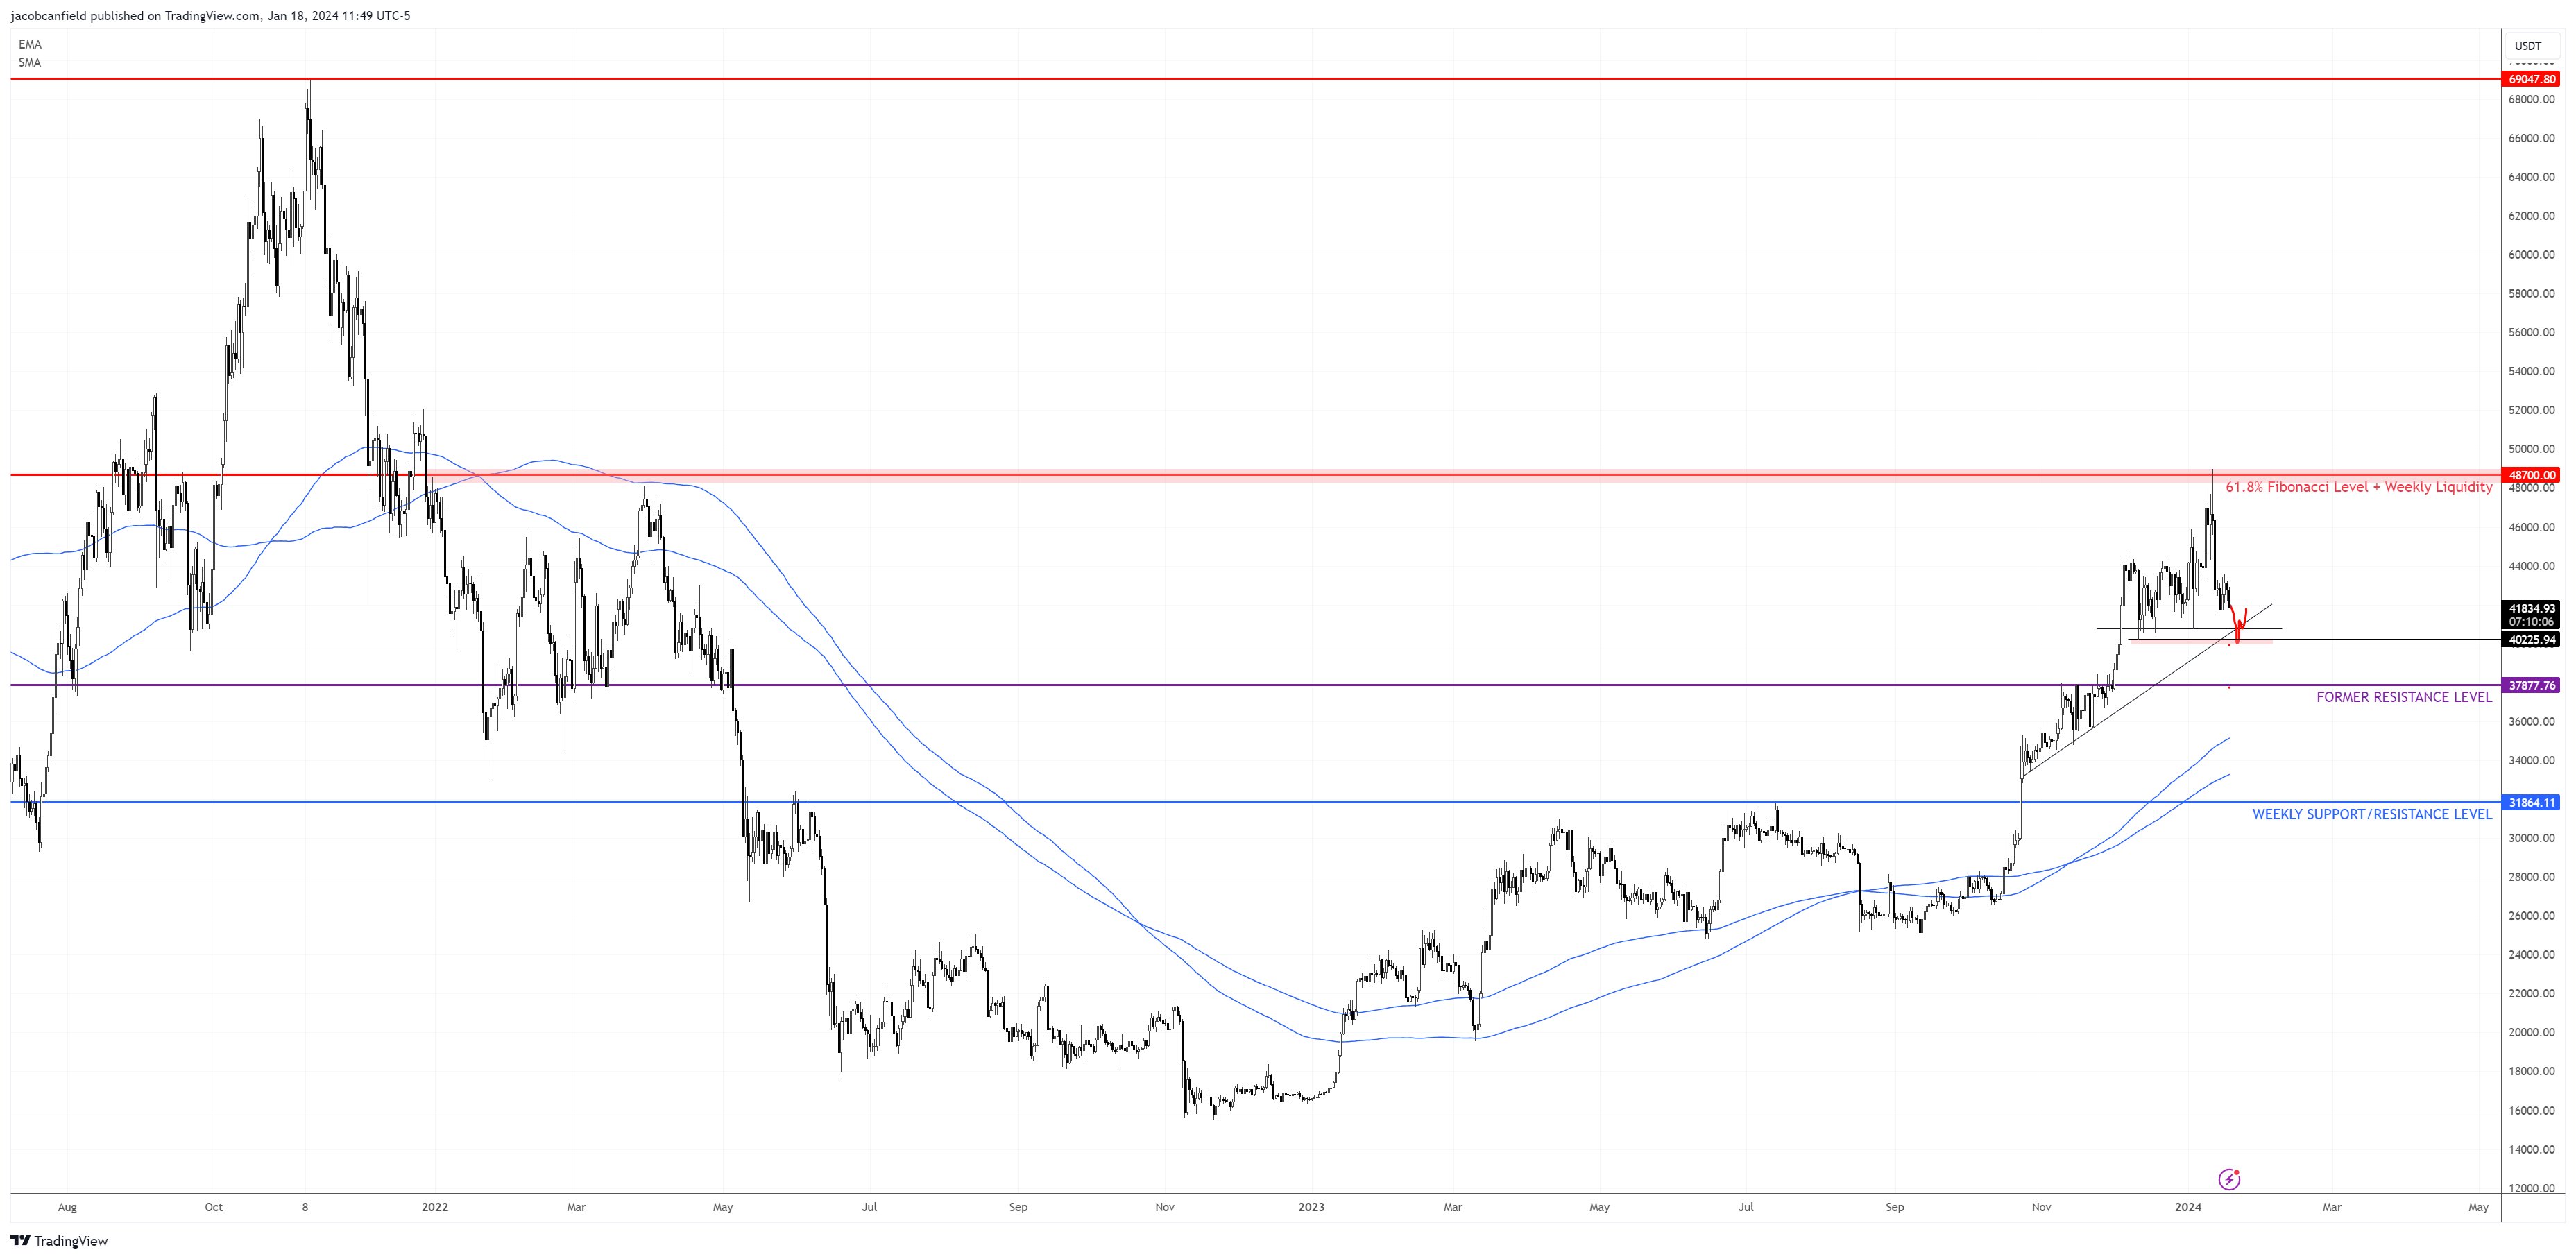
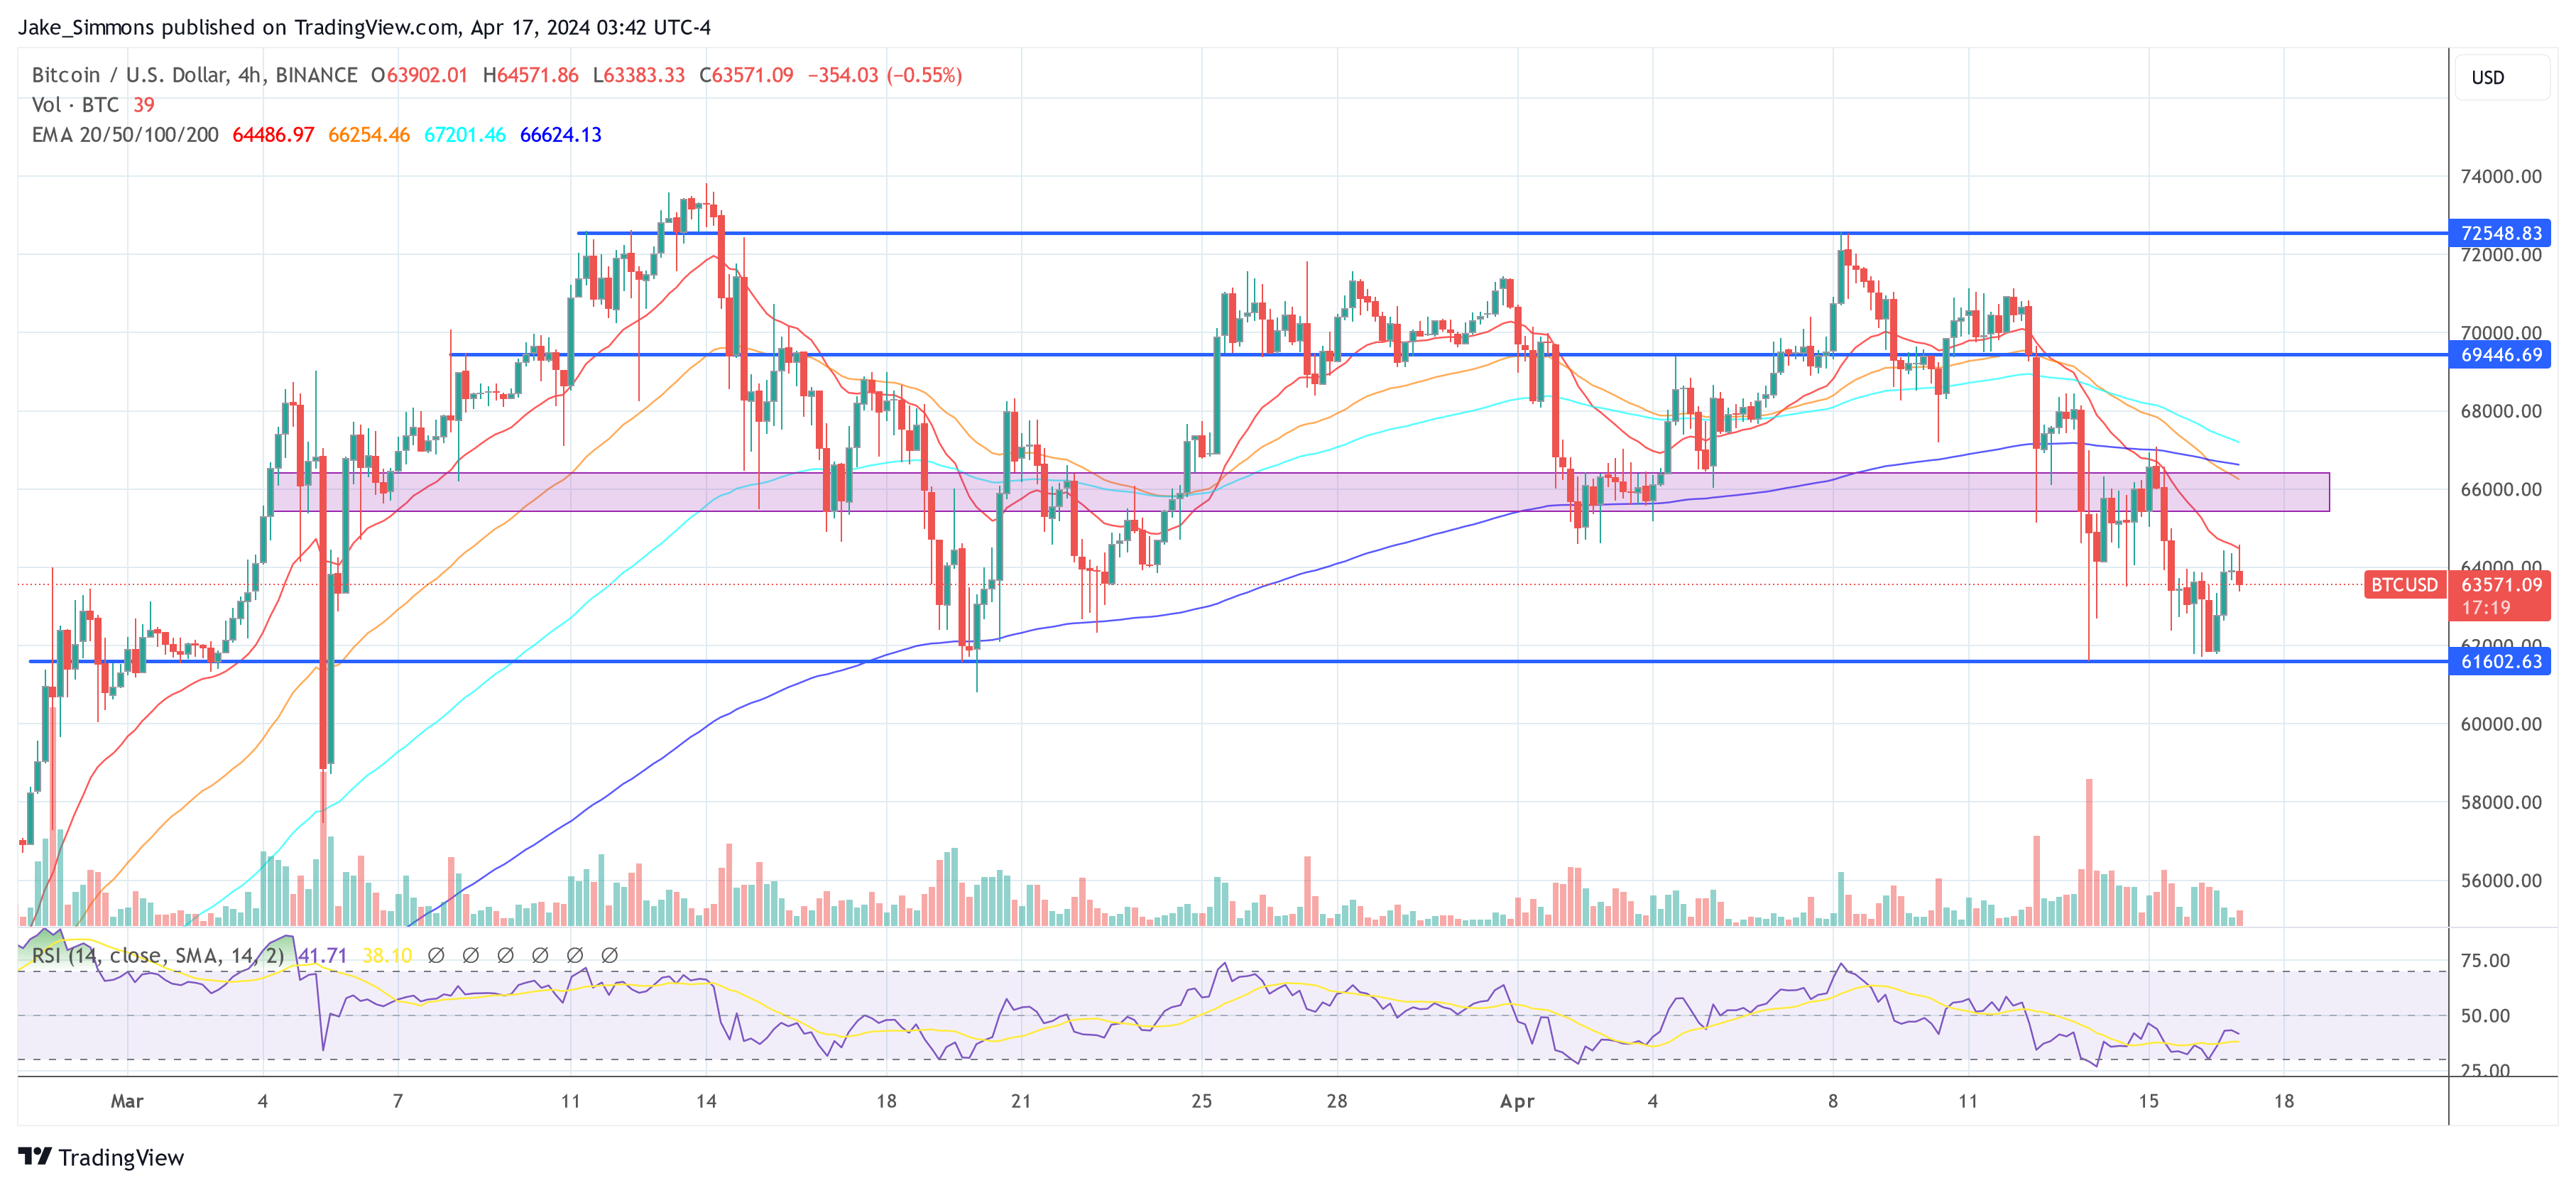
According to market expert Justin Bennett, a recovery of the $61,000 resistance level would open up potential areas such as $67,000 to $68,000. However, at the present moment, this level continues to pose a significant resistance.

Analyzing the recent correction in the Bitcoin price, analyst Crypto Con suggests that the market correction was necessary for the long-term price trajectory. 

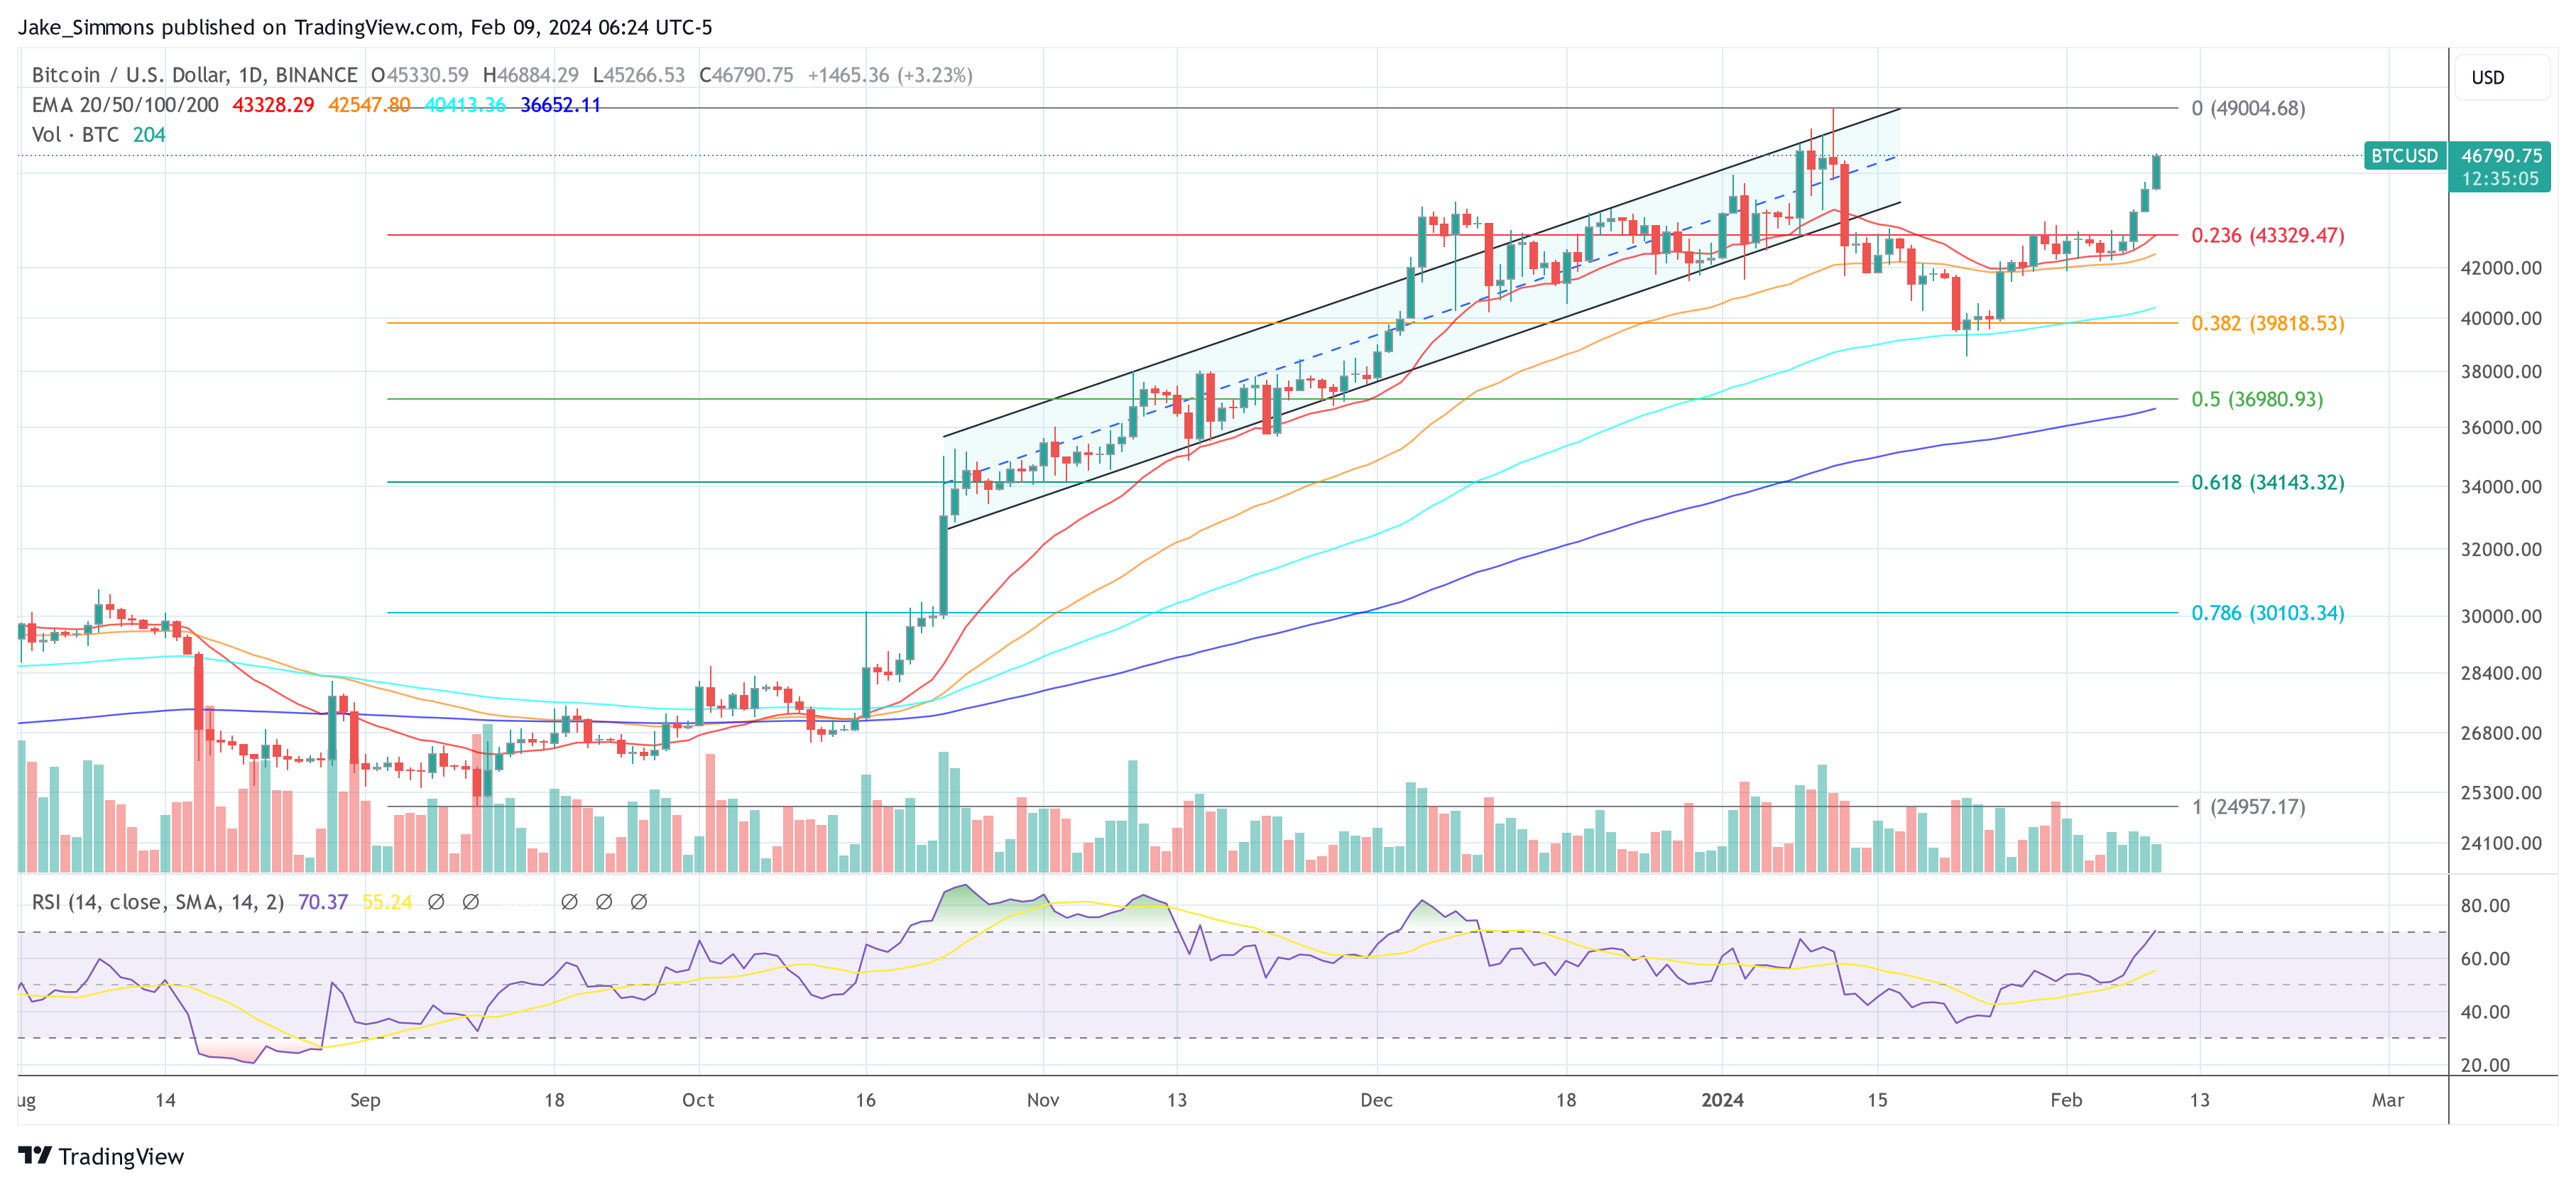
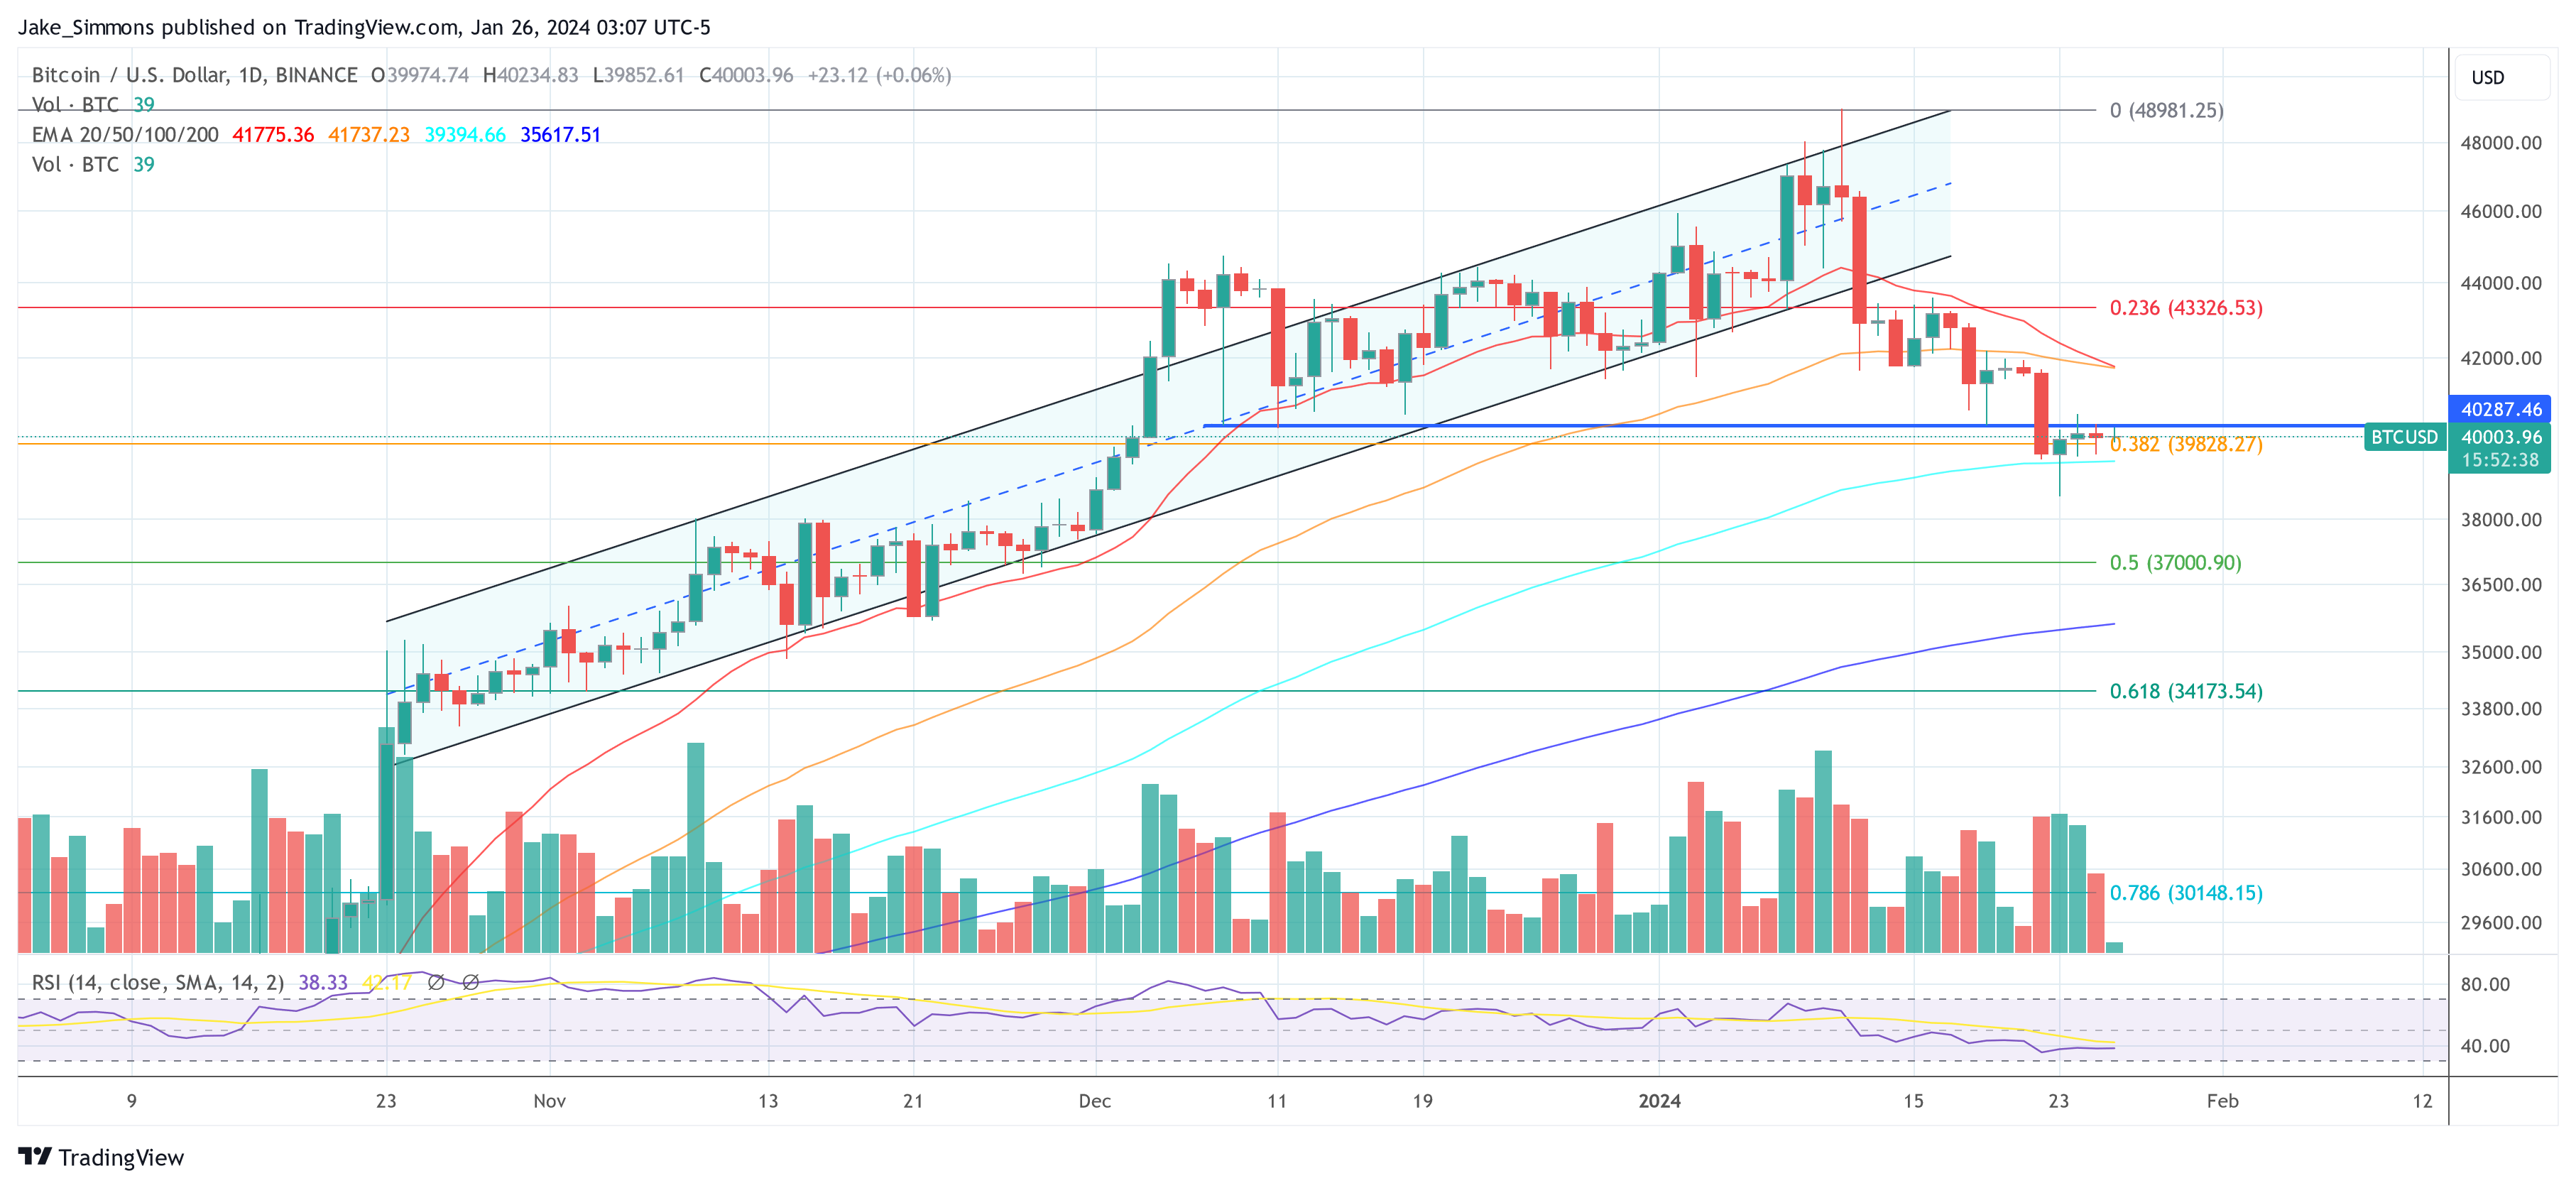
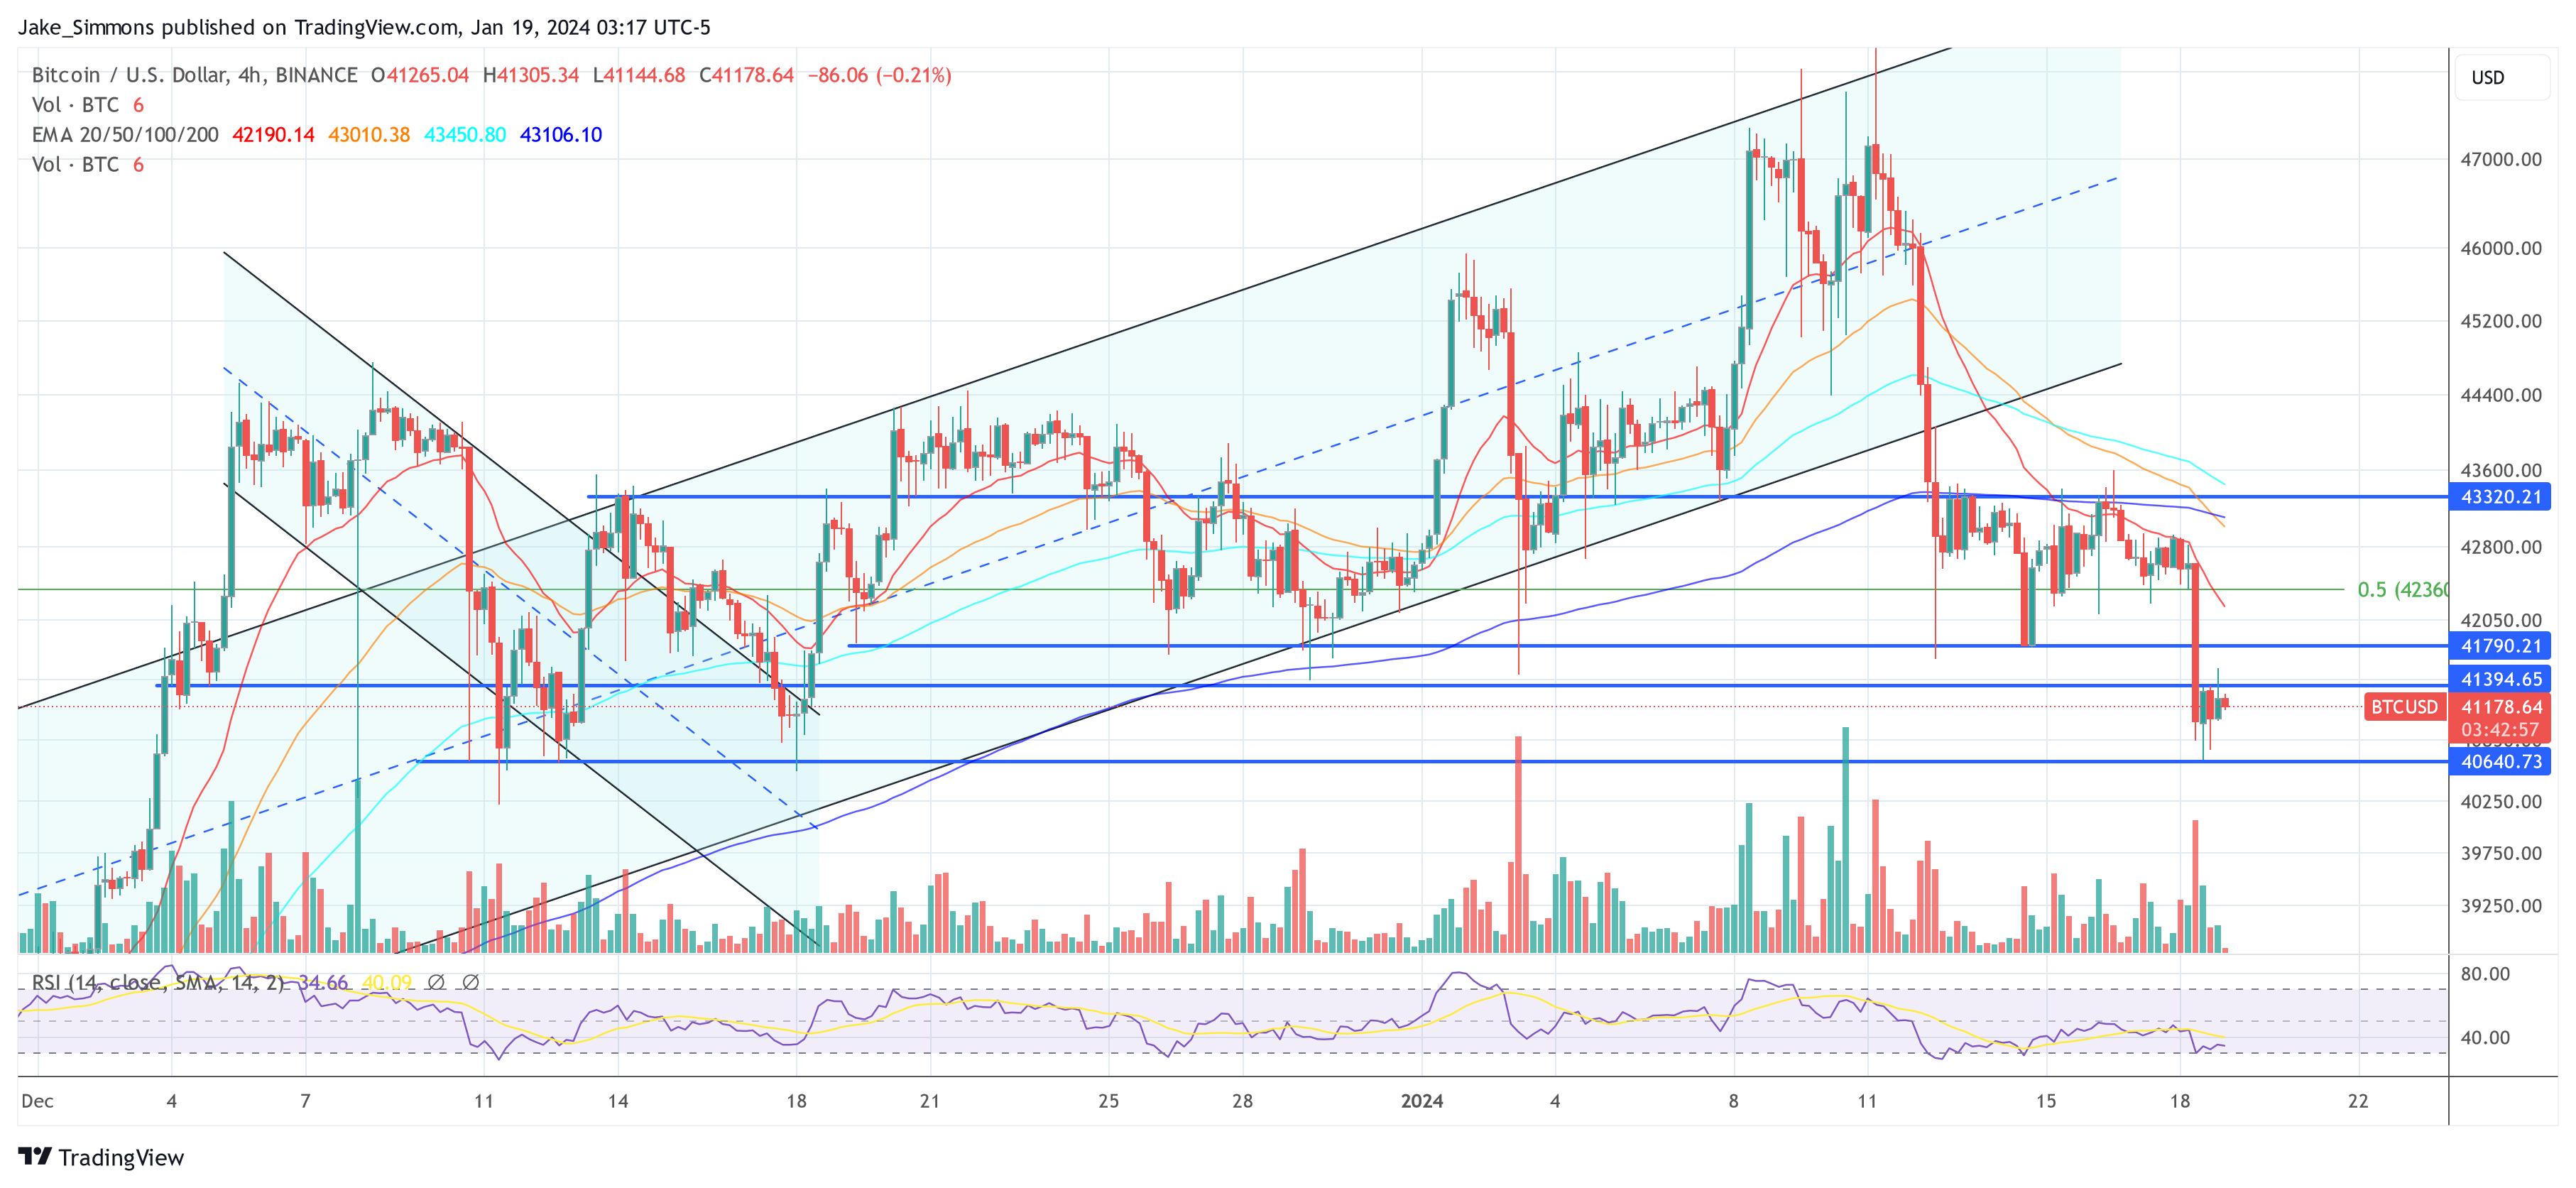
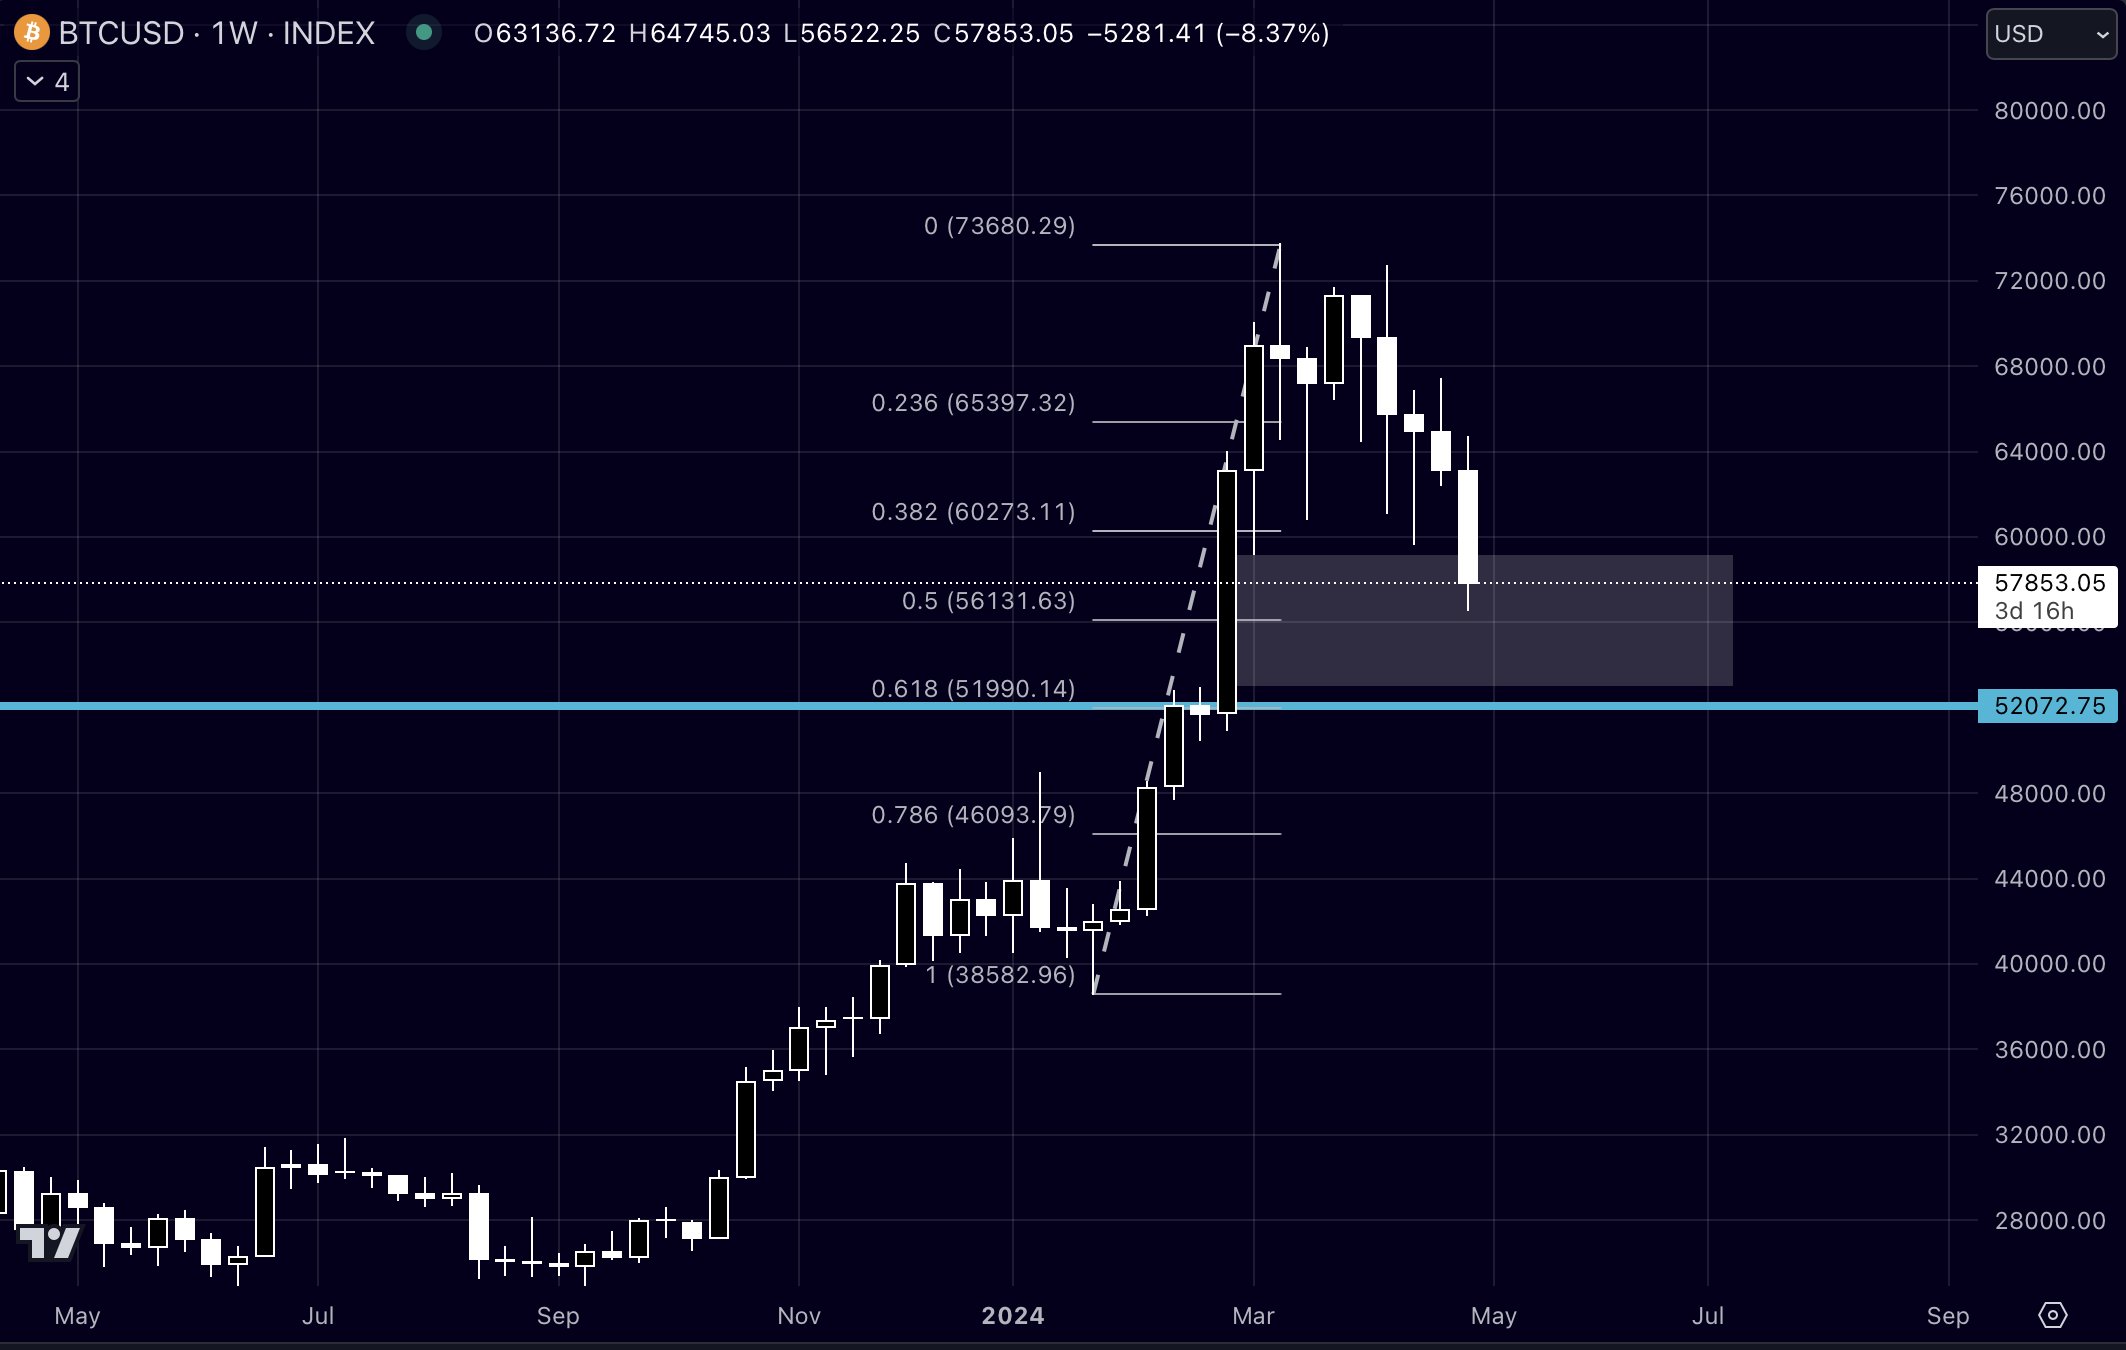
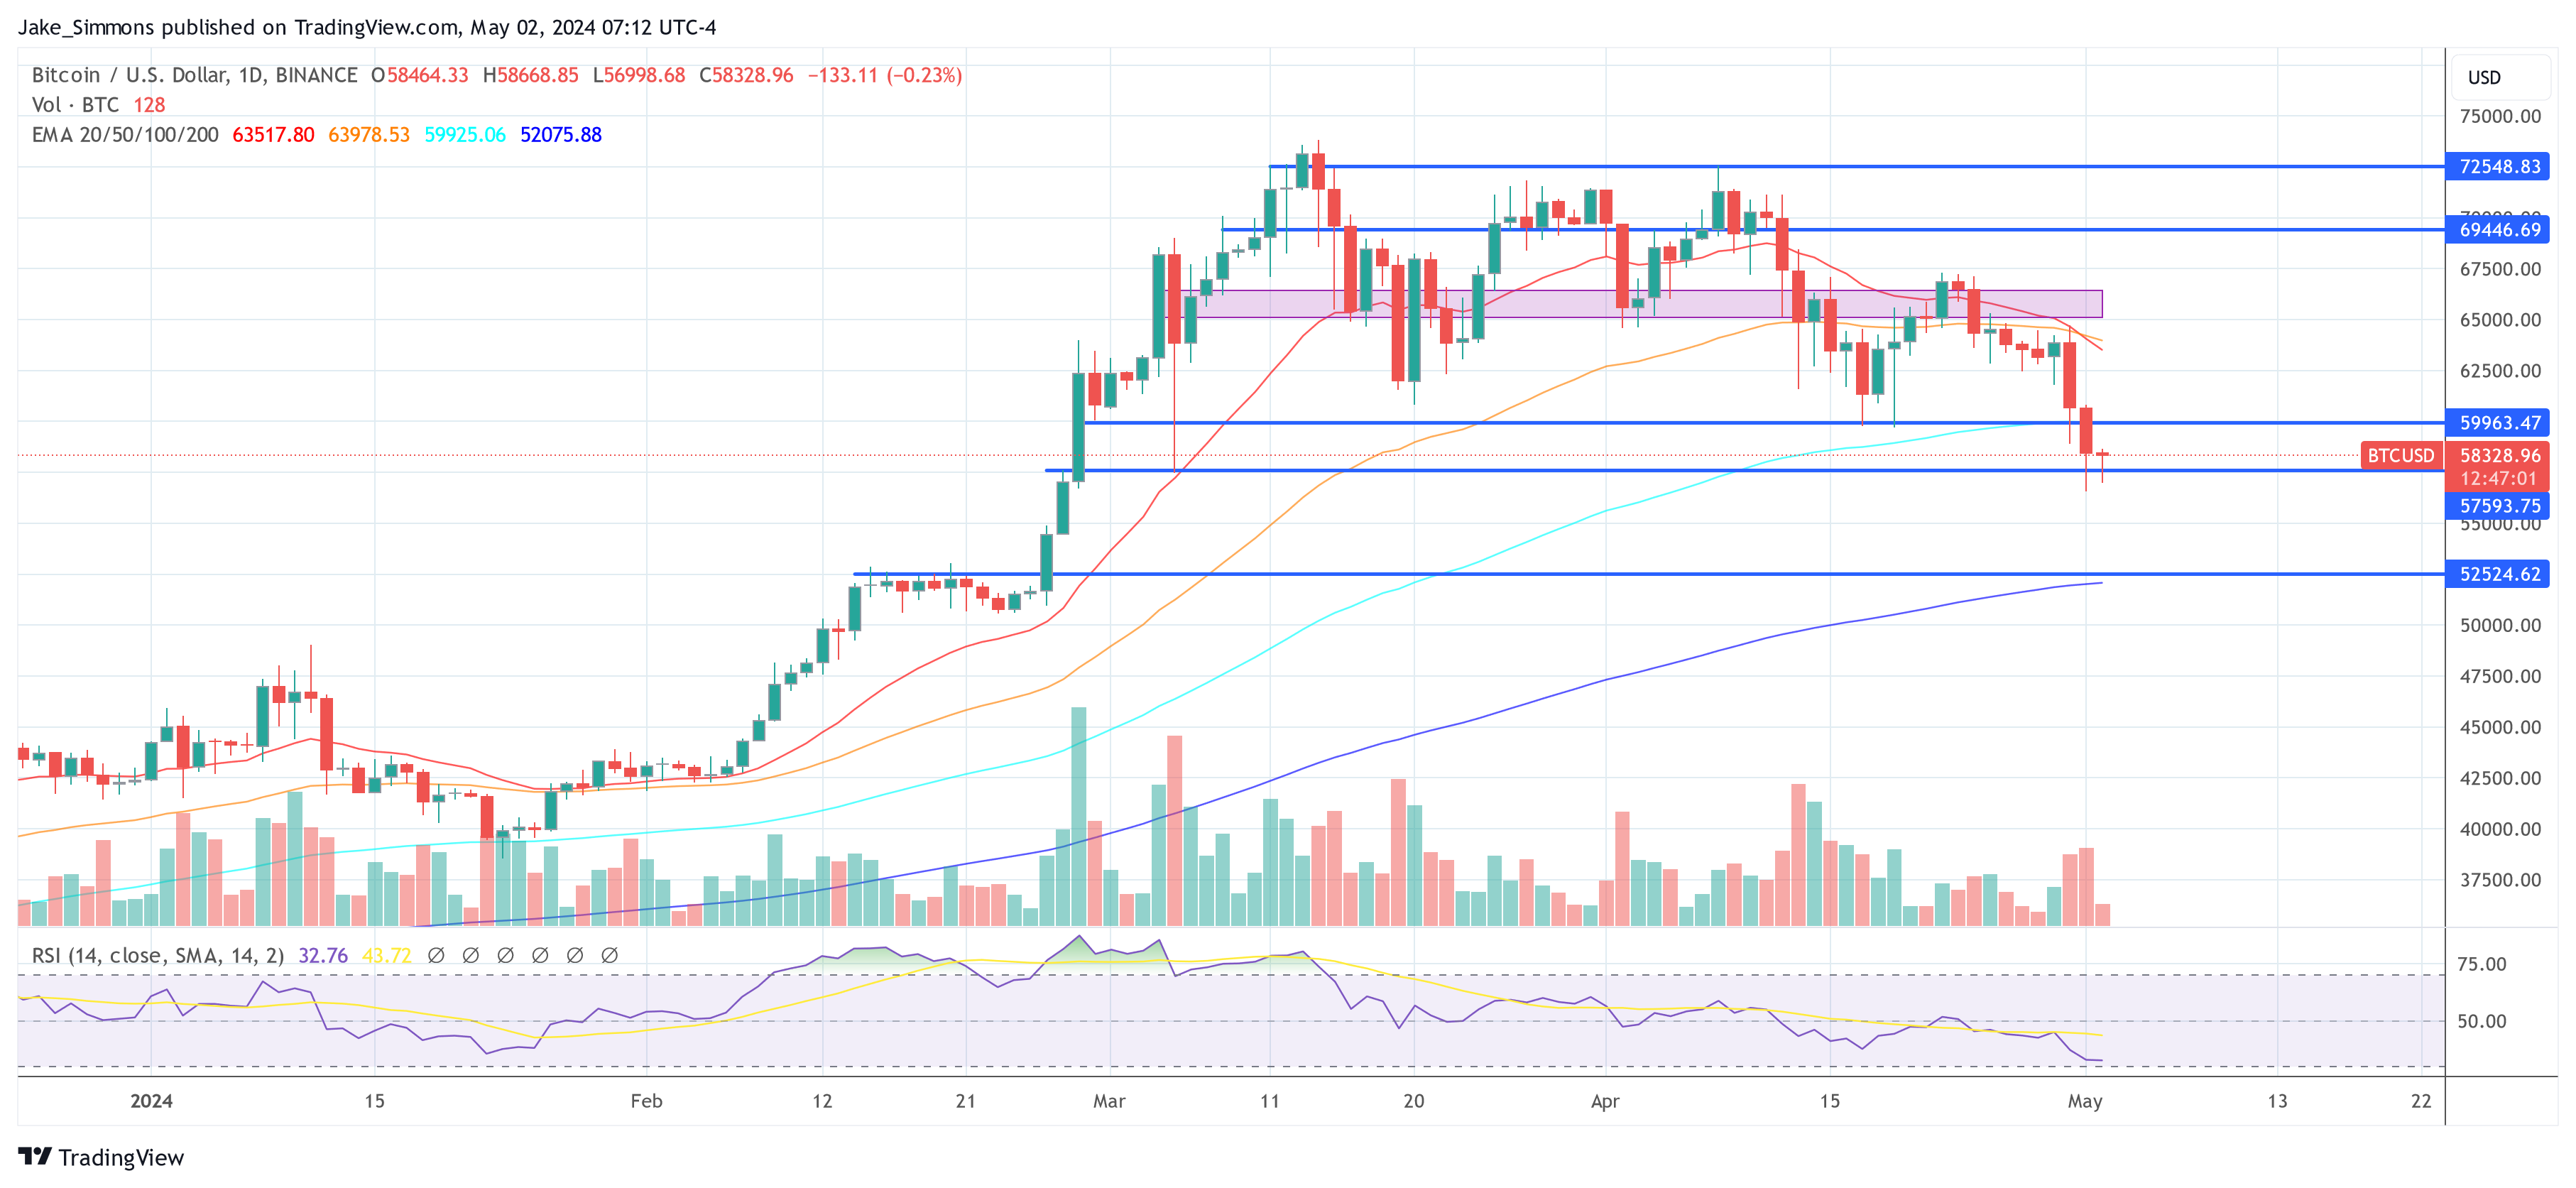
The full retest of the 20-week Exponential Moving Average (EMA) support at $56,700 and the return to indicator support zones, such as the Directional Movement Index, indicate a healthy price consolidation.

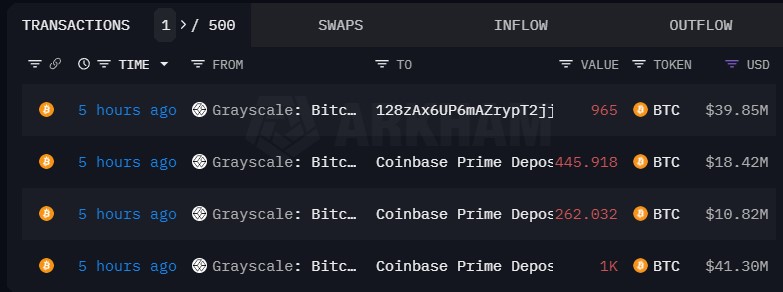
In addition to the technical indicators, on-chain and market data analytics firm CryptoQuant’s founder and CEO, Ki Young Ju, highlights the current bullish sentiment. 

Bitcoin price

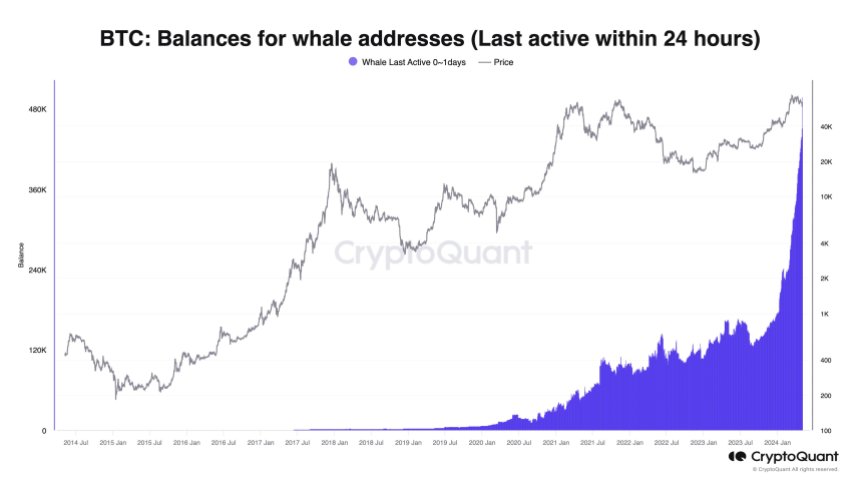
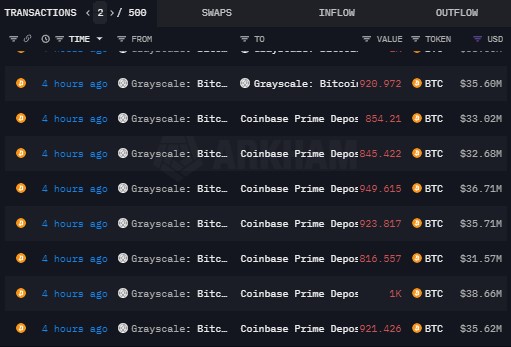
According to their data, whales accumulated a significant amount of Bitcoin, totaling 47,000 BTC, within the past 24 hours. This increased accumulation by large investors further bolsters the positive outlook for Bitcoin’s price.

Bitcoin Price Poised For Bullish Surge

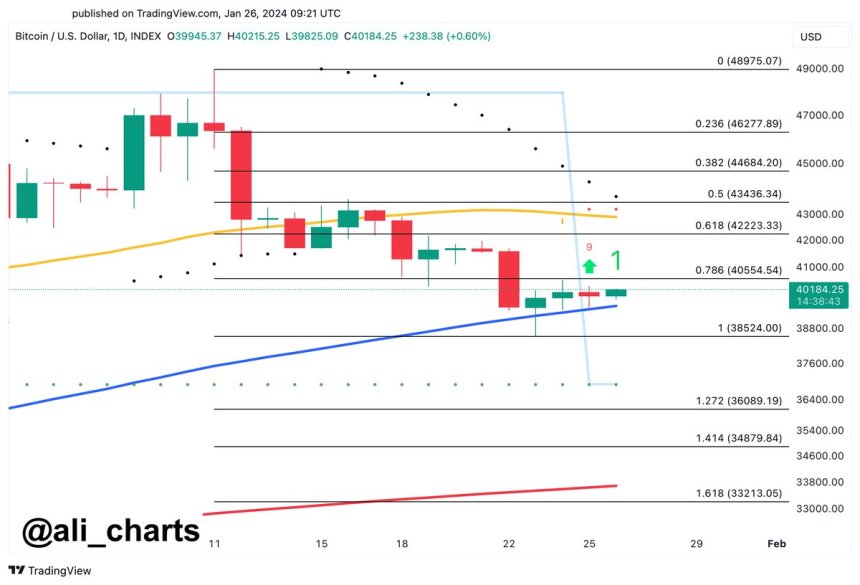
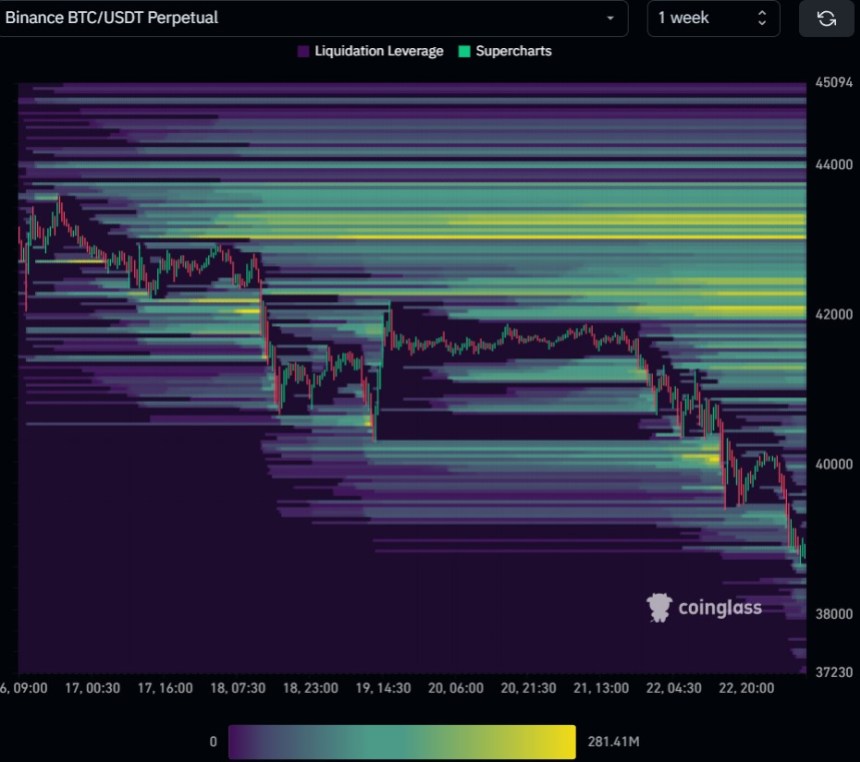
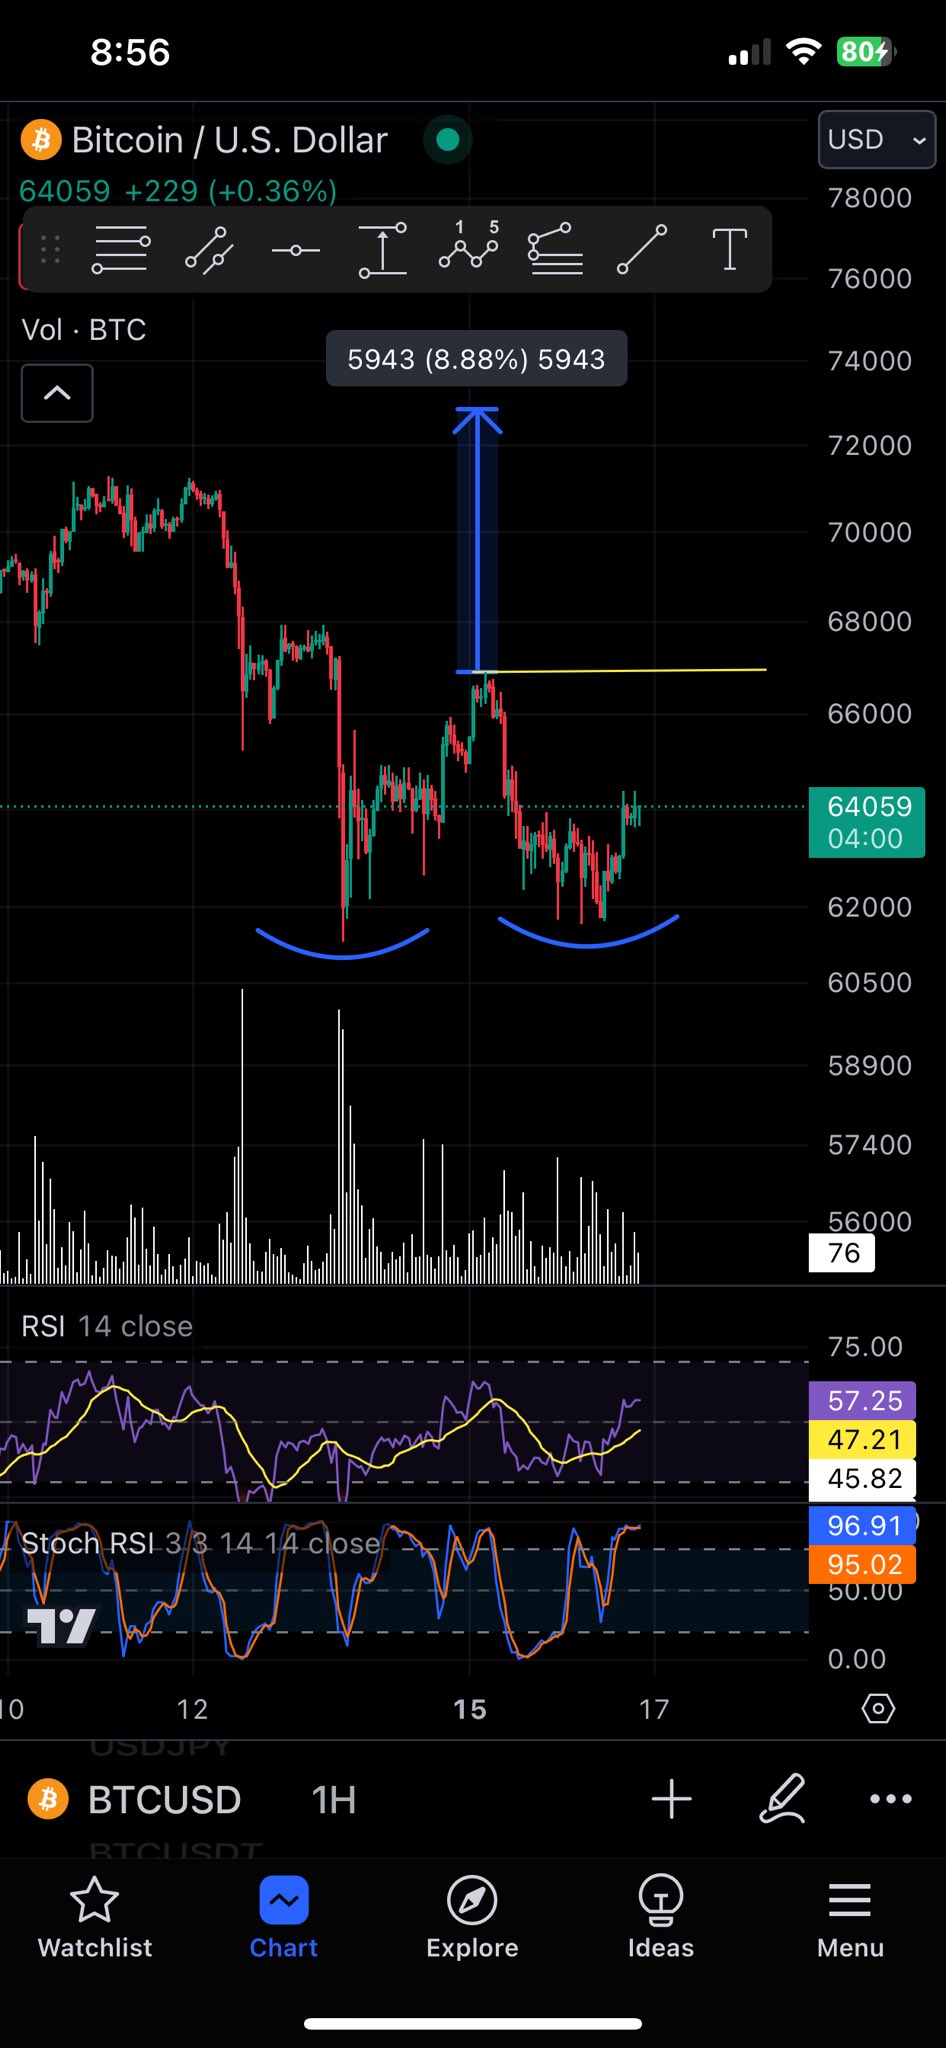
Crypto analyst Titan of Crypto has provided further bullish predictions for the Bitcoin price, suggesting that recent corrections have resulted in the grabbing of leverage longs liquidity. In addition, the Stochastic Relative Strength Index (RSI)on the 5-day chart is on the verge of crossing into bullish territory. 

This occurrence has historically been followed by an upward price movement in Bitcoin, leading to higher highs. Such a pattern has the potential to fuel renewed investor confidence and attract further buying pressure.

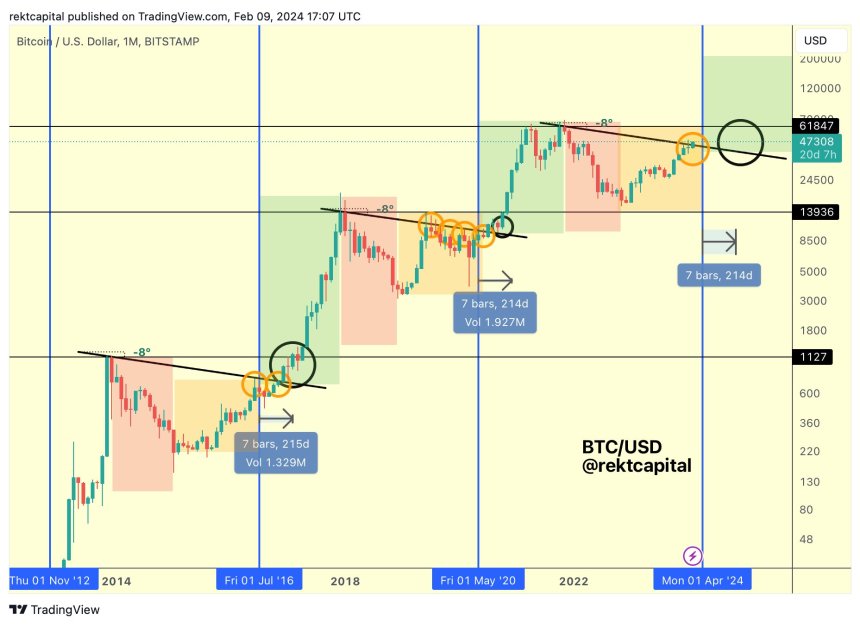
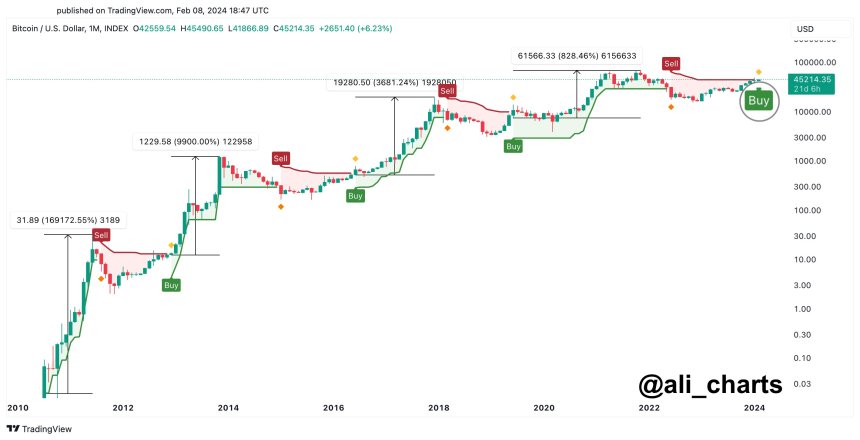
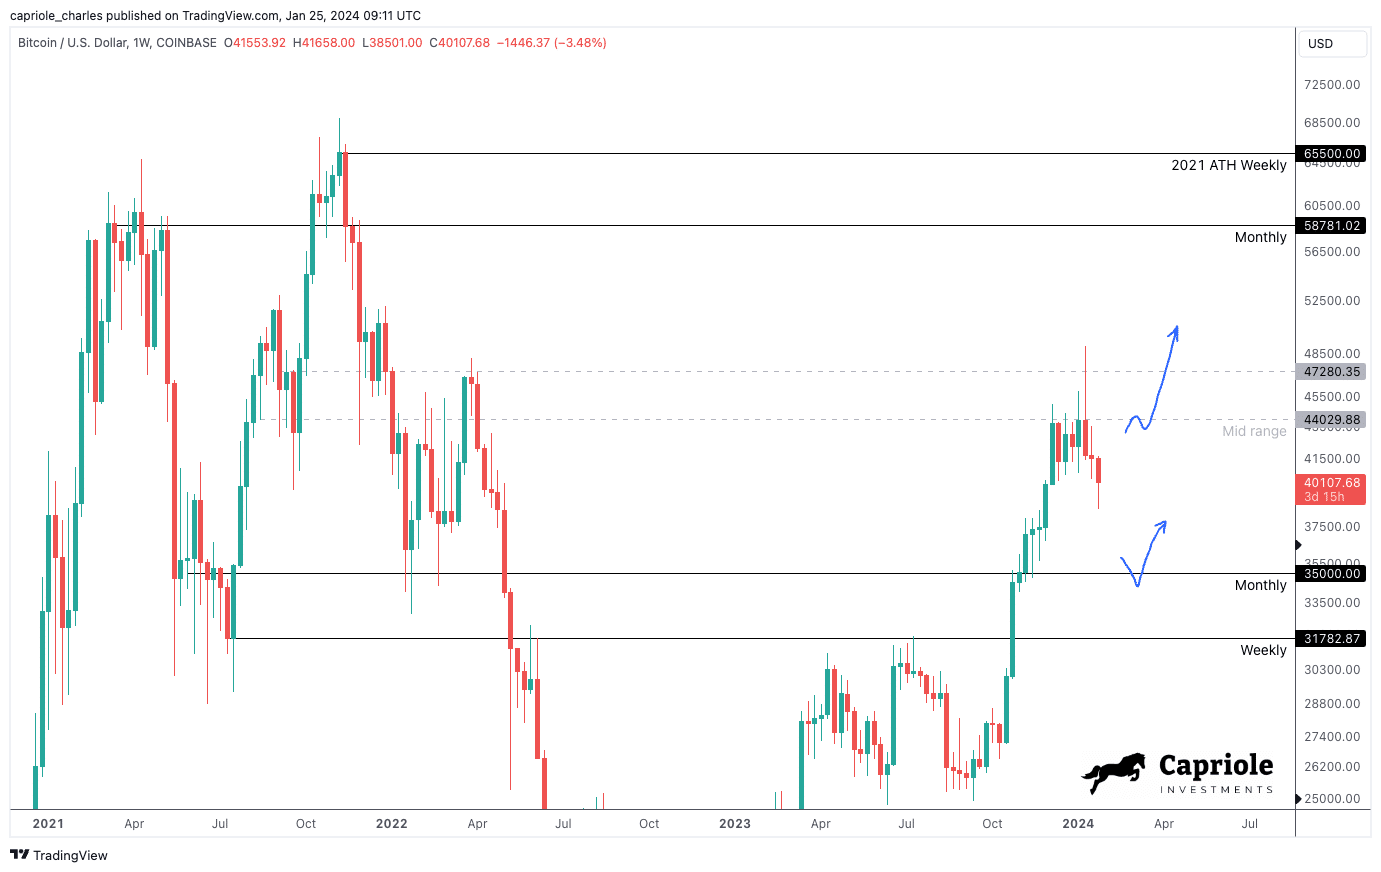
Another positive signal highlighted by Titan of Crypto is the recent buy signal generated by the Supertrend indicator, as seen in the chart below. This technical tool helps identify trends in an asset’s price movement. 

Bitcoin Price

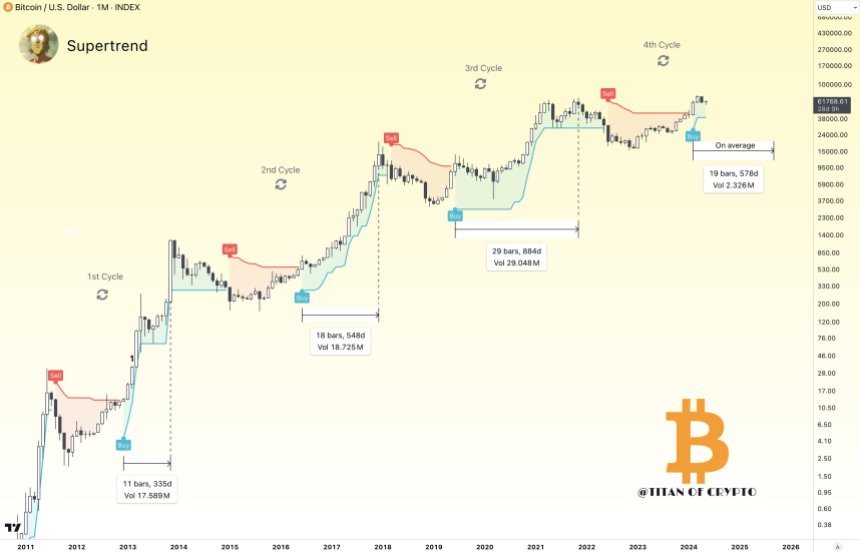
The buy signal, which occurred just three months ago, implies that Bitcoin may still have significant room for growth before reaching its cycle top. According to the analyst, historical data suggests that the average duration from the buy signal to the cycle top is approximately 19 months, indicating the potential for a sustained upward trend.

Bitcoin price

Currently trading at $61,600, Bitcoin has seen a significant increase of 4.7% in the last 24 hours alone. It remains to be seen if BTC will successfully break above resistance levels, while also challenging the ability of previously retested support levels to withstand potential future downtrends.

Featured image from Shutterstock, chart from TradingView.com

Bitcoin Bull Run Over? Analyst Predicts What To Expect Now

The recent plummet in Bitcoin’s value below the $60,000 mark has sparked widespread speculation within the crypto community, raising questions among investors and market watchers about the future direction of its price. Marco Johanning, a well-known crypto analyst and founder of The Summit Club, took to X (formerly Twitter) to provide his insights on the current market conditions and what might be expected next.

According to Johanning, the recent price action does not signify a market downturn but rather a correction within an ongoing bull market. He emphasizes, “Bitcoin lost the range. What now? First and foremost, a reminder: we are in a bull market, and this is a correction. This is not a rally in a bear market. Or in other words, the high time frame trend is up no matter what.”

He supported this assertion with several indicators of a continued bullish trend. First, Bitcoin reached its bear market bottom in November 2022 and subsequently broke above the 200-day moving average, a critical indicator of long-term market trends. Following a drop below the 200-day moving average, there was a significant breakout above this level and THE major high time frame resistance in October 2023.

Moreover, Bitcoin achieved a new all-time high in March 2024. Over the last 18 months, Bitcoin has consistently recorded higher highs and higher lows, which are typical characteristics of a bullish market.

“This can’t be a bear market,” Johanning explained. “These elements underscore a fundamental bias crucial for assuming that the current drop is part of a broader bull market trend. Therefore, Bitcoin will eventually find a local bottom and ascend higher.”

Bitcoin Price Analysis: What To Expect Next?

Johanning provided a detailed breakdown of possible future scenarios based on technical analysis. His first scenario is based on the monthly chart where the most crucial level is at $48,000-$49,000. This level is key because it was a major hurdle overcome in February 2024. Now, it might serve as the perfect point for a bullish retest.

Furthermore, there’s a significant market imbalance down to the $48,000-$49,000 range, coinciding with the 0.5 Fibonacci retracement level from the last monthly swing low. This setup suggests a strong potential for price stabilization and reversal at this level, according to Johanning.

Bitcoin price analysis

The second scenario grounds on the weekly chart where the important level is at $52,000. This level acts as a major high time frame support/resistance, marked by a weekly imbalance that extends up to $52,000, and it matches the 0.382 Fibonacci retracement from the bottom to the top of the last major rally, and the 0.618 level from the last swing low to the top.

Bitcoin price analysis

The third scenario is based on the lower timeframes. Here, the most significant level is at $57,000. This mark is critical as it represents the 0.5 Fibonacci level from the last swing low and was a key area during the February climb. This level might serve as the stage for a potential deviation or price trap.

Bitcoin price analysis

“The recent bearish engulfing pattern breaking the monthly levels, followed by a bearish retest, signals significant market shifts,” noted Johanning. “If Bitcoin swiftly reclaims these key levels, particularly the $57,000 mark, we could see a deviation scenario unfold. Otherwise, the $52,000 or $48,000-$49,000 levels will likely be tested, each representing a higher low in the ongoing uptrend.”

Impact on Altcoins And Market Strategy

Altcoins have displayed remarkable resilience in the face of Bitcoin’s volatility, which Johanning finds particularly promising. “Usually, a significant drop in Bitcoin accompanied by a loss of a higher time frame range would lead to severe declines in altcoins. However, their strength yesterday is a good indicator that the worst may be over for altcoins,” he commented.

Johanning concluded his analysis with an optimistic outlook for both Bitcoin and altcoins, expressing confidence in the continuation of the bull market. He is actively accumulating more at current prices, anticipating substantial returns: “No matter which scenario plays out, I am committed to this trend until proven otherwise. I’m investing heavily, and if we truly remain in a bull market, the potential for profit is tremendous.”

At press time, BTC traded at $58,328.

Bitcoin price

Market Expert Predicts New Paradigm For Bitcoin: ‘Days Under $100,000 Numbered’

As the Bitcoin (BTC) Halving event concluded for the fourth time, the cryptocurrency market witnessed notable changes in key metrics. 

These developments have led Charles Edwards, a market expert and founder of Capriole Invest, to issue bold predictions that hint at a paradigm shift in the BTC market. 

Bitcoin Trading At ‘Deep Discount’

One of the key metrics highlighted by Edwards is the staggering electrical cost associated with mining a single Bitcoin. Edwards reveals that this cost has now reached an astonishing $77,4000. This figure represents the raw electricity expenses required to power the Bitcoin network for every newly mined BTC.

Another significant metric that Edwards draws attention to is the Bitcoin Miner Price, which soared to $244,000 on Saturday. This metric encompasses the block reward and fees miners receive for every Bitcoin they successfully mine. 

Notably, this surge in miner price coincided with transaction fees skyrocketing to $230, marking a four-fold increase compared to the previous all-time high of $68 set in 2021.

Bitcoin

Considering the metrics above, Edwards suggests that BTC currently trades at a “deep discount.”  This is because BTC’s price is lower than the electrical costs of mining it.

Typically, this situation only lasts for a few days every four years, suggesting that the price will only take a short time to catch up and surpass this price level, which is slightly below BTC’s all-time high (ATH) of $73,7000, reached on March 14th. 

Edwards outlines three possible outcomes in the wake of these developments. First, he anticipates a scenario in which the price of Bitcoin experiences a significant surge. 

Secondly, there is a likelihood that approximately 15% of miners may be forced to shut down due to unfavorable economics. Finally, Edwards suggests that average transaction fees are expected to remain substantially higher.

Based on the analysis of these metrics and the potential scenarios, Edwards boldly predicts that Bitcoin’s days under the $100,000 mark are “numbered.” While it remains to be seen which of the three outcomes will prevail, Edwards expects a combination of all three factors to contribute to Bitcoin’s price appreciation.

Optimal Buying Opportunity? 

Bitcoin has demonstrated significant price consolidation above the $60,000 mark since Friday, following temporary drops below this threshold amid mounting anticipation for the Halving event. 

Crypto analyst Ali Martinez recently analyzed Bitcoin’s current price state, suggesting that a potential bottom may have formed above these levels, increasing the likelihood of surpassing upper resistance levels shortly.

According to Ali Martinez’s analysis, Bitcoin strives to establish the $66,000 price level as a crucial support zone. Data reveals that approximately 1.54 million addresses collectively purchased 747,000 BTC at this level. If Bitcoin successfully secures this support, it may pave the way for further upward movement.

Martinez identifies Bitcoin’s next critical resistance levels, between $69,900 and $71,200. These levels represent significant price barriers for BTC bulls, and Bitcoin may encounter selling pressure at these levels. 

In addition, the analyst points out that the Bitcoin MVRV ratio, a metric that compares the market value of Bitcoin to its realized value, has shown a promising pattern, as seen in the chart below. 

Bitcoin

Martinez highlights that whenever the MVRV ratio falls below its 90-day average since November 2022, it historically indicates an optimal buying opportunity for Bitcoin. Interestingly, such buying opportunities have resulted in average gains of approximately 67%.

According to Martinez, based on current market conditions and an analysis of the MVRV ratio, now may be an opportune time to consider buying Bitcoin. The historical data and the potential for significant price appreciation support this view. 

Bitcoin

BTC is trading at $66,100, up 1.6% in the past 24 hours. 

Featured image from Shutterstock, chart from TradingView.com

Bitcoin Displays Bullish Adam And Eve Double Bottom: What It Means

In his latest technical analysis, Christopher Inks, a recognized figure in the field of crypto analysis, points to the possible formation of a bullish Adam and Eve double bottom pattern for Bitcoin. This formation is spotted on the BTC/USD 1-hour chart and has significant implications for the cryptocurrency’s short-term price action.

The chart depicts Bitcoin’s price movement with a distinct pattern that resembles two troughs with a peak in between. The first trough, known as the “Adam,” is characterized by a sharp, V-shaped bottom, indicating a rapid price decline and equally swift rebound. This is followed by a more rounded, gradual, and wider “Eve” trough, suggesting a slower and more deliberate price recovery.

Bitcoin possible Adam and Eve double bottom in progress

Bitcoin Targets Its All-Time High

In this analysis, the price level to watch is marked by a horizontal yellow line, which Inks suggests is the neckline of the pattern. A breakout and close above this neckline would confirm the pattern, signaling a potential bullish reversal. The importance of this neckline, which lies around the $67,000 price level, cannot be overstated as it represents a key resistance point that the price needs to surpass to confirm the pattern.

To derive the target of the pattern, Inks uses the depth of the formation, measuring from the neckline to the lowest point of the Adam trough. This height (8.88%) is then projected upward from the breakout point, suggesting that the pattern target would be in the area of $73,000, close to Bitcoin’s all-time high (ATH).

Other technical indicators on the chart include volume, the Relative Strength Index (RSI), and the Stochastic RSI. Volume, denoted at the bottom of the chart, has shown a significant peak at the formation of the Adam bottom, followed by less pronounced volume during the formation of the Eve. This volume profile often accompanies the Adam and Eve pattern and can serve as a confirmation signal of the bullish sentiment.

The RSI, a momentum oscillator that measures the speed and change of price movements, is at 47, neutral territory, showing that neither bulls nor bears have gained full control yet. The Stochastic RSI, a more sensitive indicator that combines the features of stochastic oscillators and RSI, is indicating a strong upward momentum, with a reading above 95 out of 100, which could suggest potential for a short-term pullback due to overbought conditions.

Finally, it’s important to note that the Stochastic RSI is showing a crossover in the overbought territory, which can sometimes precede a price correction. However, given the bullish pattern indicated by the Adam and Eve formation, the sentiment appears to lean towards an optimistic outlook. If BTC price breaks above $67,000 and closes a hour-candle above this threshold, the bulls could target the all-time high at $73,780.

At press time, BTC traded at $63,571.

Bitcoin price

Bitcoin Price Eclipses $72,000: 5 Major Factors

In the early US hours of Monday, Bitcoin witnessed a significant surge, with its price climbing above the $72,000 mark. The ascent, marked by a more than 4.5% increase within a mere five-hour window from below $69,500 to an intra-day high of $72,579, can be attributed to a confluence of factors that have stirred the crypto market.

#1 Strong Bitcoin Spot Demand

The rally appears to be fueled by robust demand in the Bitcoin spot market, hinting at the potential sustainability of the move. Crypto analyst Daan Crypto Trades (@DaanCrypto) noted the healthy market dynamics, stating on X, “Funding rates still looking solid. Healthy reset, price slowly grinding up. That’s what we want and how we want to keep it. If longs start aping again while spot bid stops, then that will end up in another flush at some point. For now, all good.”

In tandem with the rising spot prices, data from Coinglass reveals that $40.7 million in BTC shorts were liquidated today, further propelling the price upwards.

#2 BTC Halving

The imminence of the next Bitcoin halving, slated to occur roughly 12 days from now on April 20, has also probably played a pivotal role. Historically, Bitcoin has experienced a pre-halving price retraction followed by a significant rally leading into the event.

The halving will reduce the Bitcoin reward from approximately 900 coins per day to 450 coins. Skybridge Capital’s Anthony Scaramucci shared his insights with CNBC recently, highlighting the unpriced nature of the upcoming halving and its potential to further drive Bitcoin’s price.

“They’re now saying that the halving is priced in. I don’t believe that. I think Bitcoin has a lot more to go here,” he stated. At current prices, roughly $65 million in Bitcoin ETF inflows per day are needed to buy up the daily mined supply. In 2.5 weeks, that’s only $32.5 million.

#3 BTC Follows Gold

The correlation between Bitcoin and gold, both considered safe-haven assets, is another factor contributing to Bitcoin’s price movement. Gold’s strong opening this week, reaching a new all-time high of $2.253, has been mirrored by Bitcoin’s price trajectory. Gold enthusiast Peter Schiff and crypto analyst Michaël van de Poppe have both remarked on the positive correlation between the two assets, suggesting a shared momentum amid economic uncertainties.

Gold bug Peter Schiff commented via X: “It’s been a volatile Sunday night for gold. After an early $27 sell off, it rallied over $45, hitting a new record high above $2,348. This is an early stage of a major repricing of gold to reflect much higher future inflation. It’s a warning that monetary policy is too loose.”

Crypto analyst Michaël van de Poppe remarked: “There we go. Gold opening up with a big new upwards candle and Bitcoin is back to $71,000. Given the strength on commodities and the current price action of Bitcoin, I suspect we’ll see a test of the all-time high coming up.”

#4 Strong Weekly Close

The significance of Bitcoin’s weekly candle close was highlighted by CRG, a renowned analyst, who pointed to it as a contributor to the rally. The ability of Bitcoin’s price to close sustainably above its 2021 high for the second consecutive week signals a strong bullish sentiment in the market.

#5 Hong Kong Readies For Spot ETF Launch

Finally, the anticipation of the launch of spot Bitcoin ETFs in Hong Kong may have injected optimism into the market. Reports indicate that major Chinese asset managers, such as Harvest Fund and Southern Fund, managing assets worth over $230 billion and $280 billion, respectively, are positioning themselves through Hong Kong subsidiaries to enter the Bitcoin ETF market, awaiting regulatory approval.

#6 Extra: The “Ethena-Effect”

Ethena Labs has started purchasing BTC as part of a cash-and-carry trade in order to create a “safer” USDe synthetic dollar product for users. The move is being critically observed by the crypto community.

At press time, BTC traded at $72,103.

Bitcoin price

Bitcoin Price Tumbles Below $66,000: 4 Major Reasons

The Bitcoin market has witnessed a significant downturn, with prices plummeting below the $66,000 mark. This abrupt -5.6% price movement can be attributed to four major factors: a long liquidation event, a rising US Dollar Index (DXY), profit-taking by investors, and spot Bitcoin ETF outflows.

#1 Long Liquidations

The main force leading to today’s downturn in Bitcoin’s price was a significant deleveraging event characterized by an unusually high level of long liquidations. Before the downturn, Bitcoin’s Open Interest (OI) Weighted Funding Rate was unusually high, indicating that leveraged traders were paying premiums to maintain long positions in anticipation of future price increases. This optimism, however, made the market vulnerable to sudden corrections.

Crypto analyst Ted, known as @tedtalksmacro on X (formerly Twitter), remarked, “Today was the largest long liquidation event since the 19th March.” He further elaborated on the effects of this correction by noting, “Nice reset in overall positioning today, even on just a 5% drop lower for Bitcoin… Next leg higher is loading I think.” This comment highlights the severity of the liquidations and suggests a potential rebound or restructuring within the market as it stabilizes.

Bitcoin Open Interest (OI) Weighted Funding Rate

Coinglass data reveals that over the last 24 hours, 120,569 traders were liquidated, amounting to $395.53 million in total liquidations, with $311.97 million being long positions. Bitcoin-specific long liquidations were at $87.42 million.

#2 DXY Puts Pressure On Bitcoin

With 105.037, the DXY closed at its highest level since November yesterday, evidencing a strengthening US dollar. Given Bitcoin’s inverse correlation with the DXY, the stronger dollar might have shifted investor preference towards safer assets, moving away from riskier investments like Bitcoin.

This correlation stems from the global market’s risk sentiment, where a rising DXY often signals a shift towards safer investments, detracting from riskier assets like Bitcoin. However, analyst Coosh Alemzadeh provided a counter perspective, suggesting through a Wyckoff redistribution schema that despite the DXY’s recent uptick, the next move could favor risk assets, potentially including Bitcoin.

#3 Profit Taking By Investors

Profit-taking by investors has also played a significant role in the recent price adjustments. The Bitcoin on-chain analysis platform Checkonchain reported a spike in profit-taking activities.

Glassnode’s lead on-chain analyst, Checkmatey, shared insights via X, stating, “The classic Bitcoin MVRV Ratio hits conditions we characterize as ‘heated, but not yet overcooked’. MVRV = above +0.5sd but below +1sd. This indicates that the average BTC holder is sitting on a significant unrealized profit, prompting an uptick in spending.”

Bitcoin MVRV Ratio

The profit-taking coincided with Bitcoin reaching a peak of $73,000, marking a cycle high in profit realization with over 352,000 BTC sold for profit. This selling behavior is typical in bull markets but plays a crucial role in creating resistance levels at local price tops.

#4 Bitcoin ETF Outflows

Lastly, the market witnessed notable outflows from Bitcoin ETFs, marking a reversal from last week’s substantial inflows. The total outflows amounted to $85.7 million in a single day, with Grayscale’s GBTC experiencing the most significant withdrawal of $302 million.

Meanwhile, Blackrock’s IBIT and Fidelity’s FBTC reported positive inflows, totaling $165.9 million and $44 million, respectively. Commenting on this, WhalePanda remarked, “Overall negative day but not as negative as the price implied. Closing of Q1 so taking profit here makes sense. Some fuckery around [the] new quarter and halving is to be expected.”

At press time, BTC traded at $66,647.

Bitcoin price

Bitcoin’s Rise To $52,000 Masks Potential Pitfalls Ahead, Analyst Warns

Crypto analyst Justin Bennett has laid out a bearish narrative for the flagship crypto token Bitcoin. Based on his analysis, Bitcoin will likely drop below the $50,000 level again before it moves further to the upside. 

Bitcoin Could Drop Back To As Low As $47,000

In an X (formerly Twitter) post, Bennett mentioned that the price range between $47,000 and $49,000 “is the land in the sand” for Bitcoin. This statement came from his belief that the crypto token will soon see a price retracement. He also reminded his followers of how “Bitcoin carves significant tops.”

The crypto analyst suggested that $52,000 was a ‘significant top’ and that a price correction could be imminent. Bennett added that his prediction could be invalidated if BTC saw a sustained break above $53,500. Meanwhile, he also compared Bitcoin and US stocks, stating that there was an ongoing correlation between them.  

Bennett also disagrees that Bitcoin’s rally could be longer this cycle, especially considering the demand that the Spot BTC ETFs are seeing. He stated his indifference about these funds and mocked how everyone predicted they would send Bitcoin to a potential all-time high (ATH). 

From a technical analysis perspective, the crypto analyst was more concerned about BTC’s price action and remarked that “the chart will tell the story.”

BTC Fundamentals Are Getting Stronger

While Bennett predicts that Bitcoin will drop soon enough, it is worth mentioning that the crypto token’s fundamentals are getting stronger, which could also dictate its price action. Citing data from Glassnode, crypto analyst Ali Martinez recently revealed that the amount of BTC held in known crypto exchange wallets has dropped to its lowest in six years.

As highlighted by Martinez, this suggests that the market sentiment around the flagship crypto is changing, with most investors looking to hold for the long term.

That is considered a positive development and bullish for Bitcoin’s price since the amount of BTC that can be acquired is further reduced, creating some form of scarcity. 

The crypto analyst had also recently mentioned how Bitcoin holders are currently in a phase of belief, which signals potential further gains ahead for BTC. 

According to CoinMarketCap data, Bitcoin is trading at around $51,900 at the time of writing, up over 2% in the last 24 hours.

bitcoin price btc btcusdt

Chart from Tradingview

These Developments Show That The Bitcoin Bullish Momentum Is Far From Over

Crypto analyst Ali Martinez has provided insights suggesting that the Bitcoin bullish momentum is just starting. Based on this, the flagship crypto token is still likely to keep hitting new highs before the peak of the imminent bull run

Market Sentiment Suggests More Gains Ahead For Bitcoin

In an X (formerly Twitter) post, Martinez revealed how long-term BTC holders go through a “cycle of emotions” during a bullish period. These investors usually start with capitulation before “progressing through hope, optimism, and belief.” This capitulation phase is when these BTC bulls succumb to the bears, with the Bitcoin bottom coming at some point.  

The crypto analyst also noted that these BTC holders experience “a brief period of anxiety” even after the belief phase, which leads to a price correction. However, the market again re-enters a phase of belief after then, which signals potential further gains ahead, Martinez added. 

The crypto analyst claims the market has “just merged from a period of anxiety and has re-entered a new phase of belief.” He further stated that this suggests the market will likely witness more momentum for Bitcoin before reaching the “peak of euphoria that characterizes the end of the bullish cycle.”

Going by Martinez’s analysis, there are still new highs for BTC. There is also every likelihood that Bitcoin will surpass its all-time high (ATH) of $68,000. The crypto token has consistently surpassed its previous ATH in every bull run. Interestingly, this always happens months after the Bitcoin Halving takes place. 

That is why it is no surprise that the BTC Halving is again predicted to be the event that will fully kickstart the next bull run. 

BTC Expected To See Influx Of New Investors

In a subsequent X post, Ali Martinez highlighted how Bitcoin is far from obtaining peak popularity among the general populace. This is based on a Google Search Trends metric, which shows how popular a term like ‘Bitcoin’ is. Currently, BTC is said to have a score of 18, meaning that it hasn’t even reached “mid-popularity.”

The silver lining in this data is that it shows how much more investors Bitcoin could see in the next bull run. Moreover, introducing the Spot Bitcoin ETFs is believed to be perfect timing as these funds could contribute to onboarding the next generation of Bitcoin holders into the crypto space. 

A search engine like Google could also have a role to play when these investors become interested in the flagship crypto token. Thankfully, the platform has already blessed the advertisement of crypto-related funds, meaning it will be easy for these users to invest when the time comes.  

At the time of writing, BTC trades at around $51,400, up over 2% in the last 24 hours, according to data from CoinMarketCap. 

bitcoin btc btcusdt ark ceo spot etf sec gary gensler

Cover image from Dall-E, Chart from Tradingview

Can Bitcoin Overcome Past Trends? Examining The Pre-Halving Rally And Resistance Levels

Bitcoin (BTC), the largest cryptocurrency in the market by trading volume and capitalization, has embarked on a renewed bullish uptrend, reclaiming previously lost territories and surpassing resistance levels, igniting optimism among investors. 

Currently trading just below its 25-month high of $49,000 at $47,900, Bitcoin has experienced a remarkable price increase of over 6% within 24 hours and a significant 11% surge over the past seven days. 

Mapping BTC’s Path Amidst Pre-Halving Rally

However, amidst the market’s excitement, it is crucial to consider historical tendencies and their potential impact on Bitcoin’s trajectory leading up to the upcoming halving event. Market expert and analyst Rekt Capital highlights two noteworthy historical patterns:

Firstly, the “Pre-Halving Rally” phase appears to be commencing. This phase refers to a period where Bitcoin experiences a surge in price before the halving event takes place. 

Secondly, historical data reveals that Bitcoin has struggled to break beyond the macro diagonal resistance before the halving, which Rekt places at $47,000. Additionally, it has encountered difficulty surpassing its Four Year Cycle resistance, which is approximately $46,000 in the current cycle.

It is worth noting that even though the price has surpassed these resistance levels, a consolidation or continuation of the uptrend must be seen, as a retracement could take place and leave the BTC price stuck between these resistances.

Bitcoin

Given these historical trends, exploring how Bitcoin could potentially reconcile these patterns is interesting. Rekt Capital offers insights into one possible path that Bitcoin could take:

During the pre-halving rally phase, Bitcoin may produce limited upside, resulting in an upside wick at the end of February. This pattern has been observed in previous months and 2019. 

Following this, Bitcoin might establish another range at higher price levels in March, potentially allowing altcoin rallies to take center stage. Finally, a few weeks before the halving event, Bitcoin could experience a pullback, creating a pre-halving retrace.

This proposed path suggests that Bitcoin could surpass the Macro Diagonal resistance with an upside wick but remain below it in terms of end-of-month monthly candle closes during this gradually concluding pre-halving period.

Bitcoin Bull Run Indicator Flashing Buy Signal

Crypto analyst Ali Martinez has added to the growing bullish sentiment surrounding Bitcoin by highlighting a key indicator that suggests potential upside movement. 

According to Martinez, the Super Trend indicator flashed a buy signal on the BTC monthly chart. This tool is renowned for its precision in predicting bullish trends in Bitcoin markets.

The indicator’s track record underscores the significance of this buy signal. Martinez points out that the Super Trend has issued four buy signals since Bitcoin’s inception, and all four have been validated, leading to substantial gains. These gains amount to an impressive 169,172%, 9,900%, 3,680%, and 828%, respectively.

Bitcoin

However, amidst the bullish outlook, Martinez also highlights a potential strategy that may soon impact Bitcoin’s price.

According to the Bitcoin liquidation heatmap, a scenario is unfolding where liquidity hunters could drive the price of Bitcoin down to $45,810. The intention behind this move would be to trigger liquidations amounting to a substantial $54.73 million.

It is important to understand that liquidity hunters aim to exploit price movements to trigger forced liquidations among overleveraged traders. By strategically driving the price down, they can force these traders to sell their positions, resulting in cascading liquidations that potentially amplify price downward movements.

Bitcoin

Featured image from Shutterstock, chart from TradingView.com 

Expert Predicts Bitcoin Price Rally To $58,000, Here’s Why

Charles Edwards, the founder of Capriole Investments, has recently provided an analysis in Capriole’s Update #13, predicting a significant upswing in the Bitcoin price to $58,000. His forecast is rooted in a detailed examination of market trends, ETF developments, technical patterns, and fundamental indicators.

In-Depth Market Analysis Of The Bitcoin Market

The analysis begins with a detailed look at the market’s recent behavior, focusing on the aftermath of Bitcoin ETF launches. Edwards points out, “Two months of chop and ETF readings under the microscope appears to be resolving to the upside as of writing.”

He highlights the significant shift in momentum following the initial “sell the news” reaction to the ETF launches, noting a considerable decrease in outflows from the Grayscale Bitcoin ETF. This change, according to Edwards, aligns with his previous predictions.

Furthermore, Edwards highlights the massive success of Blackrock and Fidelity’s Bitcoin ETFs (IBIT and FBTC), which have collectively absorbed over $6 billion in assets in less than a month. This achievement not only underscores the ETFs’ historic launch success but also signals a broader acceptance of Bitcoin within the traditional finance sector.

“Bitcoin [is] the most successful ETF launch in history by a very wide margin,” Edwards notes, referencing data from Eric Balchunas to emphasize the unprecedented scale of Bitcoin’s entry into the ETF market.

A major milestone in Bitcoin’s institutional adoption is Fidelity’s decision to include Bitcoin in its “All-in-One Conservative ETF.” Edwards considers this move a significant endorsement of Bitcoin’s value as an investment asset, stating, “Bitcoin is finally being acknowledged in traditional investment vehicles.”

He predicts that this could set a precedent, with most major ETFs likely to allocate between 1-5% to Bitcoin in the next 12-24 months, emphasizing the critical importance of this development for Bitcoin’s mainstream acceptance.

Technical Outlook And BTC Price Prediction

Turning to the technical analysis, Edwards points out the bullish trend that has taken shape, with Bitcoin breaking past the $44,000 resistance level. This breakout, according to Edwards, is a strong indicator of the market’s bullish sentiment and a precursor to further gains.

He notes, “The Weekly closing above $47K mid-range bound on Sunday would give a great technical confirmation of a new bullish trend,” highlighting the significance of this level as a determinant of the market’s direction.

Bitcoin price analysis

Furthermore, Edwards elaborates on the low timeframe technicals, indicating a measured move towards the monthly resistance, which presents an attractive risk-to-reward (R:R) setup for investors. This technical breakout, combined with the strategic management of risk, underscores the potential for significant price appreciation in the near term.

A clean breakout on the daily timeframe of the $44K resistance is suggestive of a measured move to Monthly resistance. This is a good R:R setup. ‘Risk’ can be easily managed (a close back into the range at $44K would be a logic stop) with “Reward” 3-4X higher at $58-65K.

Fundamentals Turn Bullish

The foundation of Edwards’ bullish outlook is also built on a robust analysis of fundamentals and on-chain data. The Capriole’s Bitcoin Macro Index, which aggregates over 50 Bitcoin-related metrics into a single model, plays a crucial role in this analysis.

“The fundamental uptrend resumed on Wednesday which is also supportive of continuation of the technical move. We want to see on-chain fundamental growth continue with price to support confirmation of this mid-range breakout. Monday’s reading will be particularly important,” Edwards states.

Capriole Bitcoin Macro Index

Edwards’ analysis concludes on a bullish note, with a clear technical breakout and a transition of on-chain fundamentals into growth territory. “ETF FUD cleared. A Technical breakout on the daily timeframe and on-chain fundamentals transitioning into growth,” he summarizes, pointing towards a strong start to February and setting an optimistic tone for Bitcoin’s short-term future.

At press time, BTC traded at $46,790.

Bitcoin price

Bitcoin Price Soars, Smashing Through $45,000 On The Back Of Two Key Factors

In the past 14 days, the Bitcoin price has displayed a significant uptrend of 14.5%, signaling a resurgence in bullish sentiment. This rally comes as Bitcoin spot exchange-traded funds (ETFs) have been trading for nearly a month, with the market already factoring in this development. As a result, Bitcoin is back on its natural course, gaining momentum ahead of the scheduled halving in April.

Currently, Bitcoin has not only regained its bullish momentum after a brief dip to the $38,500 level but has also surpassed the $45,300 mark. It now edges closer to its 25-month high of $49,000, with the $50,000 milestone within reach. 

Achieving this level would significantly narrow the gap between the current price and Bitcoin’s all-time high (ATH) of $69,000. However, what are the main catalysts behind this uptrend, and how far can the Bitcoin price climb?

Reduction Of GBTC Flows And Net Positive BTC Spot ETF Inflows

According to the latest analysis by QCP Capital, two key factors are driving Bitcoin’s upward trajectory: 

Daily outflows from the Grayscale Bitcoin Trust (GBTC) have decreased from $500-600 million to $100-200 million. Simultaneously, total inflows across all Bitcoin ETFs are now positive. This shift in the GBTC flows, and the emergence of net positive BTC spot ETF inflows contribute to the current bullish trend, according to the crypto trading firm’s analysis

Additionally, notable price movements have been observed around “spot ETF fixings.” Between 3-4 pm EST, QCP has recorded that the Bitcoin price tends to tick higher, possibly due to the one-hour observation window used by the BlackRock ETF (IBIT) to calculate its Net Asset Value (NAV). 

Conversely, downward pressure is typically observed after 4 pm EST as GBTC employs a point fix, leading market makers to sell around and after the fix.

Strong Performance In US Equities

Despite the Federal Reserve’s hawkish stance and higher US yields driven by robust February Non-Farm Payroll data (353k actual vs. 180k expected), US equities continue outperforming. 

Companies like NVDA and META have rallied due to strong earnings and positive headlines. Underallocated investors will likely continue buying any equities dips as they chase returns. 

According to the analysis, this bullish sentiment is expected to “spill” over into BTC and Ethereum (ETH), further fueled by the upcoming BTC halving and the ETH spot ETF narratives.

Ultimately, the trading firm assesses significant interest in accumulators, which enable investors to purchase Bitcoin or ETH at a “substantial discount” to the current spot price. This strategy is believed to present an attractive opportunity for bullish investors looking to build long positions throughout the year.

Bitcoin Price Faces Strong Barriers On Its Way To $50,000

Despite the uptrend, notable resistance levels could impede further upward movement and potentially lead to a consolidation phase for Bitcoin. 

To assess the nearest-term resistances accurately, the 1-hour chart indicates potential price paths for Bitcoin in the coming days if these bearish thresholds are breached.

In the immediate time frame, the $45,500 level emerges as Bitcoin’s next resistance level. This level previously marked a correction in the Bitcoin price shortly after the introduction of ETF trading.

Bitcoin price

Subsequently, the next target would be the $46,600 level if the immediate resistance at $45,500 is surpassed. However, while these two thresholds may present challenges, no significant resistance levels are evident on Bitcoin’s hourly chart until the $48,500 level. 

This particular level represents the final hurdle for Bitcoin before reclaiming its previous high reached on January 11, immediately following the approval of ETFs by the US Securities and Exchange Commission (SEC).

Considering the combined factors of Grayscale’s reduced sell-off and the overall performance of the equity market, alongside renewed investor sentiment, Bitcoin could potentially surge to previous highs and even surpass them, marking new highs since the end of the crypto winter. 

The key factor to be seen is how Bitcoin’s price will respond when encountering these highlighted resistance walls and whether the buying pressure will be sufficient to propel Bitcoin back on track toward the bullish momentum observed at the beginning of 2024.

Featured image from Shutterstock, chart from TradingView.com

Expert Analysis: Bitcoin ‘Bottom Is Not In’, Potential $30K Retest On The Horizon

Bitcoin (BTC), the largest cryptocurrency by market capitalization, closed January above the $40,000 threshold, signaling positive price action. However, market expert Justin Bennett suggests that Bitcoin’s bottom has yet to be reached. 

Bennett’s analysis highlights the possibility of further price declines, with Tether’s stablecoin USDT dominance (USDT.D) chart indicating potential downward movements. 

Tether Dominance Signals Concerns For BTC’s Price

Bitcoin’s recent price recovery and ability to surpass the $40,000 level have provided optimism among investors. Nevertheless, Bennett believes further price declines could follow a retest of the mid $44,000 range. 

Bennett highlights the inverse relationship between Tether dominance and Bitcoin. According to his analysis, the levels on the Tether dominance chart since October have been reliable indicators for Bitcoin’s price movements. 

Bitcoin

According to Bennett’s analysis, as depicted in the chart above, Tether’s dominance may experience a potential increase from its current level of 6%. This increase could bring it closer to the 8% mark. 

In such a scenario, Bitcoin’s performance would likely move in the opposite direction, indicating potential price declines soon.

On January 25, Bennett suggested that Bitcoin could drop another 20% from its current levels, which would place it around $30,000. If this scenario plays out, it would be crucial for Bitcoin bulls to defend the $30,000 level to maintain the current bullish structure.

A drop below $29,000 would give bears a stronger position, with only three major support lines remaining at $28,400, $25,900, and $24,000 before a potential retest of the $20,000 mark. 

The performance of these support levels and Bitcoin’s ability to withstand increased selling pressure will be key factors to monitor. The future market sentiment will also play a significant role in determining Bitcoin’s price trajectory.

Bitcoin Witnesses Stellar Accumulation Trend

Despite the possibility of further price drops, renowned crypto analyst Ali Martinez has shed light on a notable trend in BTC’s recent accumulation streak by investors.

According to Ali Martinez’s analysis, Bitcoin is experiencing a significant accumulation streak, rivaling some of the most notable periods observed over the past few years. 

The Accumulation Trend Score, a metric that gauges the buying activity of larger entities, has remained consistently high, hovering near 1 for the past four months.

Bitcoin

This suggests that influential market participants are actively accumulating Bitcoin, signaling their confidence in the long-term potential of the cryptocurrency. 

Martinez’s observations further indicate that Bitcoin’s price range around $42,560 has emerged as a highly significant interest zone. 

Within this range, an impressive total of 912,626 BTC has been transacted. This is expected to be a significant support level, potentially preventing further downside movements and fostering increased buying interest.

These trends collectively contribute to a positive market outlook, suggesting that despite potential price drops, Bitcoin remains an attractive asset for long-term investment.

Bitcoin

Featured image from Shutterstock, chart from TradingView.com 

Bitcoin Crash Ahead: Expert Predicts Testing $20K Before Rebound

Bitcoin, the largest cryptocurrency in the market, experienced a price recovery on Friday; however, industry experts anticipate a further test of sub-$30,000 levels in the near term. 

The prolonged downtrend observed over the past fourteen days, coupled with mounting selling pressure, has raised concerns about the sustainability of the recent rebound.

BTC’s Local Bottom Predicted

Chris Burniske, co-founder of a New York-based venture crypto firm, highlights several factors contributing to the anticipated downward movement of Bitcoin. 

Burniske suggests that the consolidation phase may extend longer than expected due to many variables, including crypto-market dynamics, macroeconomic conditions, adoption trends, and new product developments. 

Burniske offers his outlook on Bitcoin, stating that a local bottom could be reached in the $30,000 to $36,000 range. However, he wouldn’t be surprised if the cryptocurrency tests the mid-to-high $20,000 before recovery occurs, leading to a renewed push toward previous all-time highs. 

Burniske cautions that the path to such a recovery will likely be volatile, marked by potential fakeouts, and may span several months.

The market expert advises investors to exercise patience during this period of uncertainty. Burniske suggests that other cryptocurrencies may experience more significant percentage declines if his predictions hold Bitcoin. Burniske further stated:

Before you get mad with, “We’re just getting this cycle started, Chris!!!” Mostly agree, ~called the cycle bottom in Nov 2022 and continue to believe the long-term trend remains robust. Have also seen a lot of crypto volatility over the last decade+…. recently, I’ve specifically been discussing a local top and local low, not a cycle-wide top and low. 

Buy Signal For Bitcoin

Crypto analyst Ali Martinez has provided insights into potential price movements for Bitcoin in its latest analysis conducted on the social media platform X (formerly Twitter). 

Martinez’s assessment indicates that the TD Sequential indicator recently flashed a buy signal on the daily chart, coinciding with Bitcoin’s current position above the 100-day Simple Moving Average (SMA) at approximately the $40,000 level. 

Bitcoin

According to Martinez, if Bitcoin surpasses the $40,550 resistance level, it may trigger an upswing with a target price of $43,000. This bullish scenario implies a potential price rally for Bitcoin soon. 

However, the analyst also highlights the importance of closely monitoring the 100SMA support level, as a breach of this level could have significant implications for the cryptocurrency’s price trajectory.

Martinez cautions that if the 100SMA support level is breached, it might result in Bitcoin experiencing a downward move toward the $33,300 level. This potential downside scenario indicates a critical support level that, if broken, could lead to increased selling pressure and a bearish sentiment in the market.

Bitcoin

At the time of writing, BTC’s price has recovered 3.8% over the past 24 hours, resulting in a current trading price of $41,400.

Featured image from Shutterstock, chart from TradingView.com

Bitcoin Price: Head Fund Manager Predicts ‘Opportunity Of The Year’ Soon

Charles Edwards, the founder of hedge fund Capriole Investments, offered an in-depth analysis of the Bitcoin market yesterday. His review offers a granular perspective on the aftermath of the historic ETF launches, the pivotal role of major players like Grayscale, and the interplay of market mechanics shaping Bitcoin’s trajectory.

Bitcoin Market Summary: ETF Launch

Edwards acknowledged the ETF launches as a pivotal moment, characterizing it as “ETF Mania.” He emphasized the hindsight realization that the ETF launch triggered a short-term “sell the news event.” Edwards elucidated, “A portion of this can be attributed to the Grayscale outflows of over $4B, approximately half of which was forced selling by the FTX bankruptcy estate and another couple billion likely to cover Grayscale’s debt obligations.”

However, he projects a shift in the outflow rate from Grayscale, stating, “I expect the current rate of outflow will drop to a more sustainable trickle over the next few weeks (after another few billion out).” Edwards also highlighted the end of Grayscale’s multi-year lock-up period, allowing long-term investors to finally close their GBTC positions at market prices.

Regarding Blackrock and Fidelity ETFs, Edwards noted their significance, saying, “The brand names of these two behemoths in the traditional asset management space means every billion they bring in, adds an order of magnitude more credibility (and therefore flows) into Bitcoin and crypto as a whole.”

BTC Technical Analysis

In his high timeframe technicals (HTF) analysis, Edwards observed a strong rejection at mid-range resistance during the ETF launch. He pointed out, “The nearest HTF support at $35K would likely represent a great opportunity to get long for the 2024 Halving year (if we are lucky enough to get there).” Edwards also mentioned, “Alternatively, a strong close above $44K will likely see the trend continue to range highs ($60K).”

Bitcoin price

For low timeframe technicals (LTF), he dissected the December/January consolidation and the $44K “fakeout” during the ETF launch. Edwards explained, “Fakeouts often resolve in price movements to the other side of the range, as we saw.” He added:

Therefore, the most interesting price point locally is $41K. A daily close above $41K would likely represent a downtrend fakeout and a swift return to range high at $44K (+). If we simply wick into $41K and start trending back down, that would be a great risk-off trigger for a potential move lower toward $35K HTF support.

Fundamentals: The Role Of On-Chain Data

Edwards underscored the importance of fundamentals and on-chain data in understanding market dynamics. He introduced Capriole’s Bitcoin Macro Index, stating, “This Index includes over 50 of the most powerful Bitcoin on-chain, macro market and equities metrics combined into a single machine learning model. This is a pure fundamentals-only value investing approach to Bitcoin. Price isn’t an input.”

According to him, fundamentals have entered a period of slowdown which aligned with the near top at the ETF launch. “That fundamental slowdown continues today with price down -20% from the highs in January so far,” Edwards remarked.

Chart Of The Week

The hedge fund manager also introduced the Advance-Decline (AD) Line as a chart of the week. He explained, “The AD Line is calculated as the cumulative sum through time of each day’s count of advances less declines.” Edwards highlighted its relevance, stating, “Today we are seeing the first such breakout since 2016.”

He drew parallels between the AD Line’s breakout and Bitcoin’s historical performance, noting, “During these periods in 2013 and 2016, Bitcoin was also in a drawdown from all-time-highs (like today) and began two of its largest cyclical rallies in history.”

The Opportunity Of The Year

In conclusion, Edwards offered a nuanced outlook. He cautioned, “Bitcoin at $39-40K is not a screaming buy today.” However, he projected, “The opportunity of the year likely awaits in the $32-35K region, which if we are lucky enough to see, will probably be the last time we ever see it.”

Edwards concluded with a forward-looking perspective, stating, “Pending that, we await patiently for a momentum breakout of $41K (aggressive) and $44K (conservative) for resumption of the meat of the primary 2024 trend. Up.”

At press time, BTC traded at $40,003.

Bitcoin price

Bitcoin Price At Risk? Grayscale’s $335M Coinbase Transfer Stirs $30,000 Plunge Potential

The Bitcoin price has experienced a notable shift as selling pressure mounts, with BTC bears gaining the upper hand. Asset manager Grayscale, the owner and manager of the Grayscale Bitcoin Trust (GBTC), is a significant contributor to this trend. 

Since the trading of spot Bitcoin exchange-traded funds (ETFs) began on January 12, Grayscale has been on a selling spree, as evidenced by substantial transfers of BTC to the United States-based crypto exchange Coinbase.

Bitcoin Price Under Pressure As Grayscale Selling Spree Continues

According to Akrham Intelligence data, in addition to the previously reported 69,994 BTC ($2.9 billion) transfers, Grayscale sent an additional 8,593,075 BTC (approximately $335.19 million) to the exchange on Tuesday, suggesting the possibility of further selling activities.

Bitcoin price

These developments have affected the Bitcoin price, which has experienced a significant downtrend, declining by 20% over the past week and a half. 

On Tuesday, the largest cryptocurrency dropped as low as $38,500, placing considerable pressure on a crucial support level. Despite the bearish pressure, the $38,500 support level has demonstrated resilience so far, with the cryptocurrency rebounding to $39,300 at the time of writing. 

Nevertheless, the duration of Grayscale’s selling spree remains uncertain, and if market sentiment continues to turn negative, Bitcoin could potentially revisit the $30,000 mark. This figure is just above the key $29,000 level that marked the beginning of the bull run that took Bitcoin to its 22-month high of $49,000 on January 11th.

Bears On The Rise

If the $38,500 threshold succumbs to Grayscale’s selling pressure and profit-taking, market observers should closely monitor the $37,750 level as the next resistance. 

Failure to hold above this level would open the door to a potential decline toward the major resistance at $35,600, which could further prevent a dip to the next support level at $33,000.

However, if these support levels are breached and the Bitcoin price continues its downtrend, the next significant key levels to watch for bullish momentum would be $29,000 to $30,000. A breakdown below these levels could signal an end to the current bull market structure and grant the bears the upper hand in the mid-term, at least until the anticipated halving event in April. 

Historically, halving events have acted as major catalysts for the Bitcoin price, and their influence has been demonstrated.

As the Bitcoin market faces intensified selling pressure and Grayscale’s ongoing selling spree, market participants remain cautious about the potential for a significant price plunge. The coming days and weeks will be critical in determining whether Bitcoin can regain its bullish momentum or if it will succumb to further downward pressure.

Bitcoin price

Featured image from Shutterstock, chart from TradingView.com

Expert Analysis: Six Factors Suggest Bitcoin Price Won’t Drop Below $37,800

In the past month, the Bitcoin price has experienced a significant decline after reaching a 22-month high of $49,000. Currently, the largest cryptocurrency has fallen below the crucial $40,000 mark, raising concerns about the prospects of the ongoing bull run and the overall bullish market structure. 

However, there are indications that the bottom of the current downtrend may be near, potentially setting the stage for a potential price reversal.

Bitcoin Price To Avoid Plummeting To Low $30,000s

Market analyst Marco Johanning sheds light on the situation, offering insights into the Bitcoin price movement. Johanning suggests that it won’t be long until Bitcoin reclaims the $41,500 level or potentially rises from a lower level if a specific scenario unfolds. 

According to Johanning, Bitcoin will finally encounter significant liquidity on the downside. Notably, the price has touched around below $39,000 multiple times, indicating the presence of substantial liquidity at these lows. 

Moreover, Johanning addresses the skepticism surrounding the price of around $37,800, arguing against widespread expectations of a drop into the low $30,000 range. 

Johanning emphasizes that the primary liquidity lies below $40,000 and is not in the low $30,000 range. Traders profited from the low $30,000 range have likely adjusted their stop orders to protect their gains, creating a layer of support below the recent equal lows. 

As the price starts hitting these stop orders, automatic selling occurs, further down the price until it encounters significant buy pressure. The analyst points out a daily order block at $37,700 and high timeframe (HTF) support at $38,5000, indicating the potential for notable buy pressure in these price regions. 

Johanning also highlights the likelihood of filling Chicago Mercantile Exchange (CME) gaps and Imbalances, with the next imbalance anticipated below $33,000.

Short Squeeze Rally Imminent? 

According to Johanning, the prevailing sentiment reveals many bears waiting to short a market dump. Johanning predicts that a short squeeze could occur once the price reverses, leading to a rapid price increase.

In terms of Fibonacci retracement levels, Johanning suggests that since the Bitcoin price has already lost the $40,200 level, it could potentially fall to the 0.5% Fibonacci level, which coincides with those above the $37,800 level. 

Johanning speculates that the price may briefly touch $37,800 before closing above the HTF support level of $38,500, setting the stage for a potential upward movement.

The recent downtrend in Bitcoin’s price has raised concerns about continuing the bull run. However, market analyst Marco Johanning presents several key arguments supporting the possibility of a price reversal. 

Bitcoin price

With Bitcoin’s current price at $38,900, there is a possibility of increased buying pressure in this region. The support wall at $38,5000 has demonstrated resilience thus far, and its performance will be closely observed. 

If the support wall fails to hold, the market will observe how the $37,800 price level performs and whether it aligns with the analyst’s thesis.

Featured image from Shutterstock, chart from TradingView.com

Bitcoin Long Positions Surge On Bitfinex: Whales Add 4,230 BTC, Signaling Potential Price Reversal

In a surprising turn of events, the approval of spot Bitcoin (BTC) exchange-traded funds (ETFs) has not yielded the anticipated immediate upside impact on the Bitcoin price. 

Contrary to expectations within the crypto community, BTC has experienced a sharp drop of over 16% since the ETF approval on Wednesday, January 11, dipping below the key $40,000 level. The failure of BTC bulls to hold the support level has led to a testing phase at the $38,000 level, accompanied by a 4.5% price drop within the past 24 hours.

Bitfinex Whales Buck The Trend

Amidst the market volatility, according to Datamish, Bitfinex whales have accumulated Bitcoin long positions since November 2023. This accumulation of approximately 4,230 BTC since January 17 marks the first sustained increase in Bitfinex BTC long positions following a sharp decline in November last year. 

Bitcoin

However, the recent downturn in the BTC price can be partly attributed to increased selling pressure from miners and asset manager Grayscale. Grayscale has notably increased its BTC sell-off since the ETF trading commenced. 

Transferring a significant amount of BTC from the Grayscale Trust address to Coinbase, totaling 69,994 BTC ($2.9 billion), has influenced the market dynamics. 

Additionally, reports indicate substantial sell-offs of Grayscale’s Bitcoin Trust GBTC shares, including a notable sale of 22 million GBTC shares by the FTX estate, worth nearly $1 billion. 

Bitcoin Liquidation Zones Wiped Off

The impact of Grayscale’s sell-off is evident in CoinGlass’ liquidation heatmap, which shows notable liquidation zones being wiped off in the 1-week chart. 

While Grayscale’s BTC dump has contributed to the price drop, the increased accumulation of BTC long positions on Bitfinex indicates a potential change in sentiment. A price reversal could occur if the $38,000 support line holds, pushing BTC back above $40,000.

Bitcoin

Furthermore, excluding Grayscale, institutional investors and asset managers involved in the ETF market have collectively acquired over 86,320 BTC at an average price of $42,000, representing a substantial $3.63 billion investment. 

Market experts such as Ali Martinez suggest that these institutions are likely to adopt a strategic, long-term view rather than engage in peak purchases. This level of institutional investment underscores the growing recognition of Bitcoin as a legitimate asset class and signifies confidence in its long-term growth potential.

Bitcoin

Currently, the Bitcoin price is at $38,800, reflecting a substantial year-to-date decline of over 12% and a 9.7% drop in the past seven days. The duration and extent of the selling pressure caused by Grayscale’s BTC dump remain uncertain, leaving the question of how much further the BTC price may decline.

Featured image from Shutterstock, chart from TradingView.com 

Bitcoin Expected To Mirror Historical Trends: Glassnode Sets $120K Price Prediction For 2024

Bitcoin (BTC), the largest cryptocurrency in the market, has encountered a significant downturn following the waning hype around exchange-traded funds (ETFs), resulting in a 9% decline over the past fourteen days. 

However, Glassnode co-founders remain optimistic, asserting that the recent price corrections align with historical patterns and could propel Bitcoin to new heights, nearly doubling its current all-time high (ATH) of $69,000.

Healthy Market Correction?

In their latest analysis, the co-founders of the blockchain analytics firm posted on X (formerly Twitter), highlighting Bitcoin’s movement to the 6.618 Fibonacci Extension after a Bull Flag Correction. 

They draw parallels between the current correction and similar market conditions observed in late 2017 and 2020. The question arises: Will history repeat itself in 2024, and will Bitcoin reach its 6.618 Fibonacci Extension during this bullish market, setting a target of approximately $120K?

Bitcoin

Examining the chart above, the analysis by the Glassnode co-founders reveals a comparable price correction following Bitcoin’s breakout above the $10,000 price level, which initiated the bull trend that propelled the cryptocurrency to a $15,000 increase before reaching its current ATH of $69,000.

Likewise, Bitcoin exhibited a similar bull flag pattern after surpassing the $29,000 price level, leading to a 22-month high of $48,900 on January 11. Notably, this surge occurred shortly after the approval of Bitcoin spot ETFs by the U.S. Securities and Exchange Commission (SEC).

Considering these developments, the key to Bitcoin’s future trajectory lies in maintaining support around the $40,000 level and further consolidation above it. If these conditions are met in the coming months, Bitcoin has the potential to reach the 6.618 Fibonacci extension, pushing its price as high as $120,000.

New All-Time Highs Expected For Bitcoin

Like Glassnode co-founder’s recent price analysis, crypto analyst Crypto Con also relies on historical patterns to gauge the future price action of BTC. According to Crypto Con, the mid-top of this Bitcoin price cycle occurred slightly faster than previous cycles but slower than the third cycle. 

Notably, this mid-top represents the only instance where it occurred outside of an early top, as indicated by the purple and yellow dots on the chart provided by the analyst.

Bitcoin

Despite the 2019 mid-top occurring a year earlier than expected, the cycle top still manifested within the usual timeframe, plus or minus 21 days from November 28th, 2021. 

Crypto Con stresses that there is currently no evidence apart from complex theories to support the notion of an accelerated cycle. The analyst cautions against assuming that ETFs prevent potential Bitcoin price corrections. 

After November 28th, 2024, Crypto Con predicts the emergence of new all-time highs for the Bitcoin price of $90,000 or $130,000 and significant growth for the cryptocurrency market. 

Bitcoin

At the time of writing, BTC is trading at $40,590, down 2.5% in the past 24 hours. If this level is breached, Bitcoin could drop towards the $37,650 level as it is the next major support for the cryptocurrency.

Featured image from Shutterstock, chart from TradingView.com

Bloodbath For Bitcoin: Grayscale’s $529 Million BTC Move To Coinbase Pushes Price Below $41,000

Bitcoin (BTC), the largest cryptocurrency in the market, has experienced a sharp drop below the $41,000 mark as exchange-traded funds (ETFs) for Bitcoin went live on January 12. 

The subsequent profit-taking, selling pressure, and outflows from Grayscale’s Bitcoin Trust ETF (GBTC) played a significant role in the downward trend.

Grayscale’s Bitcoin Transfers To Coinbase Intensify

On Tuesday, NewsBTC reported that six days ago, Grayscale initiated the first batch of BTC outflows from their holdings to a Coinbase, totaling 4,000 BTC (approximately $183 million) over six days. 

However, the asset manager resumed outflows from the Trust to the exchange on Tuesday, sending an additional 11,700 BTC (equivalent to $491.4 million) to Coinbase. 

Furthermore, on Friday, data from Arkham Intelligence revealed that 12,865 BTC ($529 million) were transferred from the Grayscale Trust address to Coinbase Prime. 

Bitcoin

In total, the Grayscale Trust address has transferred 54,343 BTC ($2.313 billion) to Coinbase Prime during the opening hours of the US stock market over five consecutive trading days since January 12, which has undoubtedly contributed to the downtrend in Bitcoin’s price.

Selling Frenzy Among BTC Miners

In addition to Grayscale’s selling spree, there has been increased selling activity by Bitcoin miners ahead of the upcoming Bitcoin halving. 

Crypto analyst Ali Martinez highlights that on-chain data from CryptoQuant indicates a substantial increase in selling activity by BTC miners. In the past 24 hours, miners offloaded nearly 10,600 BTC, with a value of approximately $455.8 million.

The persistent selling pressure has caused BTC to trade at $40,900, reflecting a slight 0.2% decrease over the past 24 hours. 

Bitcoin

The downtrend has been evident across various time frames, with declines of 5%, 6%, and 7% over the seven, fourteen, and thirty-day periods, respectively. However, despite these recent setbacks, Bitcoin remains remarkably positive year-to-date, with an impressive 98% gain.

Overall, the combined impact of Grayscale’s Bitcoin Trust ETF outflows and increased selling activity by miners has intensified the downward pressure on Bitcoin’s price, breaching the critical support level of $41,000. 

The focus now turns to how Bitcoin bulls will defend the crucial $40,000 support level, which stands as the last line of defense before a potential dip toward the $37,700 mark.

Bitcoin

Should this support level fail to hold, the Bitcoin market could witness further price declines, potentially pushing the price down to the $35,800 mark. However, with the Bitcoin halving scheduled for April, bullish investors are hopeful that this event will catalyze a significant bull run.

Featured image from Shutterstock, chart from TradingView.com

Crypto Analyst Sounds Alarm: Bitcoin Price Set To Plunge Even Lower

The Bitcoin price experienced a further sell-off yesterday and fell by more than 5% intraday to as low as $40,660. Since the year-to-date high of $49,000 on January 11, the BTC price has dropped by as much as 17%. However, according to renowned crypto analyst Jacob Canfield, this may not be the end of the correction. In a recent analysis, Canfield warned that more downside could be on the cards in the short-term.

The analyst, known for accurately predicting the local top of Bitcoin, addressed the prevailing uncertainty in the market. “The question that everyone is asking now is ‘where do we go from here?’” the analyst posed, acknowledging the community’s growing concern.

A significant factor in the current market dynamics is the approval of a Bitcoin ETF, which has led to speculation about Grayscale Bitcoin Trust (GBTC) investors selling their holdings to evade the associated fees. The narrative is compounded by revelations from court filings that the FTX bankruptcy estate holds a substantial number of GBTC shares, approximately 22,280,720 (worth $744 million), poised for liquidation.

Conversely, signs of market optimism emerge with BlackRock’s ETF, IBIT, reportedly accumulating spot Bitcoin aggressively, adding up to 25,067 bitcoins in under a week. The analyst suggests that this buying momentum from BlackRock may eventually counterbalance the selling pressure from GBTC, especially when considering the impact of the upcoming Bitcoin halving, creating a ‘delayed impact’ event potentially tipping the scale towards demand over supply.

How Low Can Bitcoin Price Drop?

The chart analysis provides a more immediate and grim perspective. The Bitcoin 4-hour chart indicates a lost trend that’s now acting as resistance, historically a foreboding sign for short to mid-term price movements.

“The 4 hour trend on bitcoin has been lost and tested as resistance. This is not great as the 4 hour trend historically has been a good indicator for short term/mid term price movements, the analyst remarked.

Canfield further points out, “If I was looking for a level for a short term bounce, it would probably be at a sweep of the $40,000 liquidity,” hinting at potential downward pressure on the price.

The Bitcoin daily chart presents a narrow path, with significant levels at $48.7k, marked by the 61.8% Fibonacci retracement and weekly resistance, and a notable support level at $38.7k. “As I’ve noticed in former posts, after BTC taps the 61.8, it tends to sell off 18-22%, which would give us another crack at that $38.7k level as well,” warns Canfield.

Bitcoin price analysis

Furthermore, the daily 200’s (EMA/MA) are currently trending upwards, having previously acted as support, suggesting they might cushion a further price fall.

The analyst concludes with a word of caution, emphasizing the need for vigilance in the current market characterized by low volume and volatility, conditions that often precede substantial market movements: “Biggest thing I can stress is that caution is needed during low volume/low volatility environments as a big move typically follows.”

At press time, BTC traded at $41,178.

Bitcoin price