Expert Analysis: Bitcoin ‘Bottom Is Not In’, Potential $30K Retest On The Horizon

Bitcoin (BTC), the largest cryptocurrency by market capitalization, closed January above the $40,000 threshold, signaling positive price action. However, market expert Justin Bennett suggests that Bitcoin’s bottom has yet to be reached. 

Bennett’s analysis highlights the possibility of further price declines, with Tether’s stablecoin USDT dominance (USDT.D) chart indicating potential downward movements. 

Tether Dominance Signals Concerns For BTC’s Price

Bitcoin’s recent price recovery and ability to surpass the $40,000 level have provided optimism among investors. Nevertheless, Bennett believes further price declines could follow a retest of the mid $44,000 range. 

Bennett highlights the inverse relationship between Tether dominance and Bitcoin. According to his analysis, the levels on the Tether dominance chart since October have been reliable indicators for Bitcoin’s price movements. 

Bitcoin

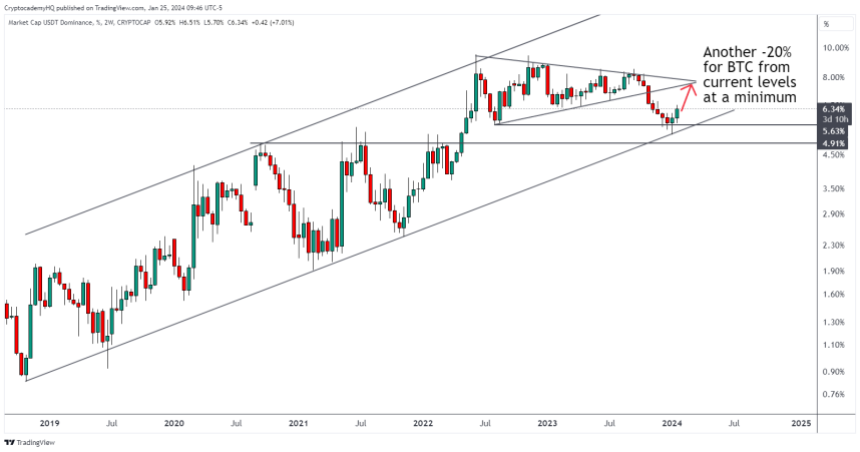
According to Bennett’s analysis, as depicted in the chart above, Tether’s dominance may experience a potential increase from its current level of 6%. This increase could bring it closer to the 8% mark. 

In such a scenario, Bitcoin’s performance would likely move in the opposite direction, indicating potential price declines soon.

On January 25, Bennett suggested that Bitcoin could drop another 20% from its current levels, which would place it around $30,000. If this scenario plays out, it would be crucial for Bitcoin bulls to defend the $30,000 level to maintain the current bullish structure.

A drop below $29,000 would give bears a stronger position, with only three major support lines remaining at $28,400, $25,900, and $24,000 before a potential retest of the $20,000 mark. 

The performance of these support levels and Bitcoin’s ability to withstand increased selling pressure will be key factors to monitor. The future market sentiment will also play a significant role in determining Bitcoin’s price trajectory.

Bitcoin Witnesses Stellar Accumulation Trend

Despite the possibility of further price drops, renowned crypto analyst Ali Martinez has shed light on a notable trend in BTC’s recent accumulation streak by investors.

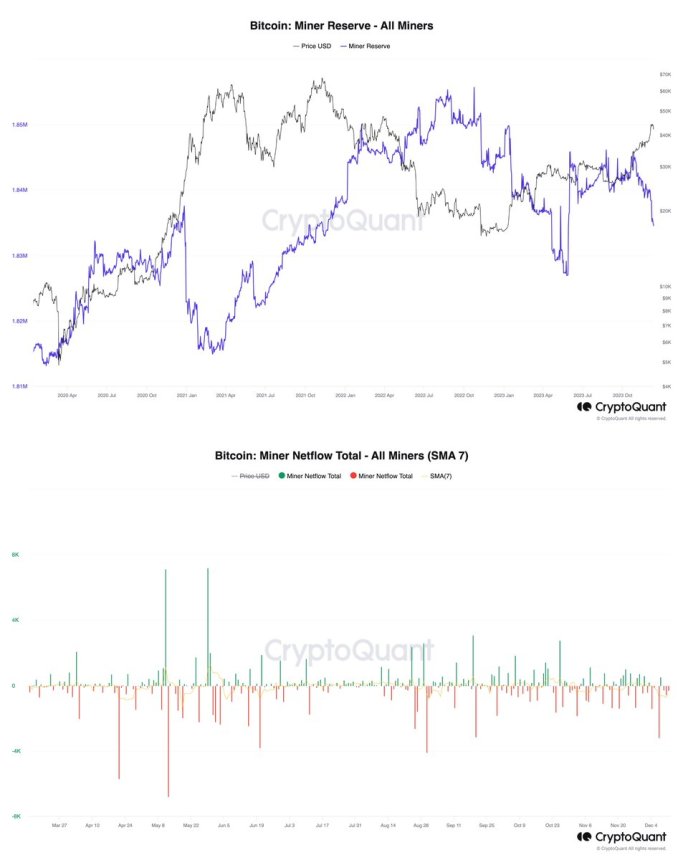
According to Ali Martinez’s analysis, Bitcoin is experiencing a significant accumulation streak, rivaling some of the most notable periods observed over the past few years. 

The Accumulation Trend Score, a metric that gauges the buying activity of larger entities, has remained consistently high, hovering near 1 for the past four months.

Bitcoin

This suggests that influential market participants are actively accumulating Bitcoin, signaling their confidence in the long-term potential of the cryptocurrency. 

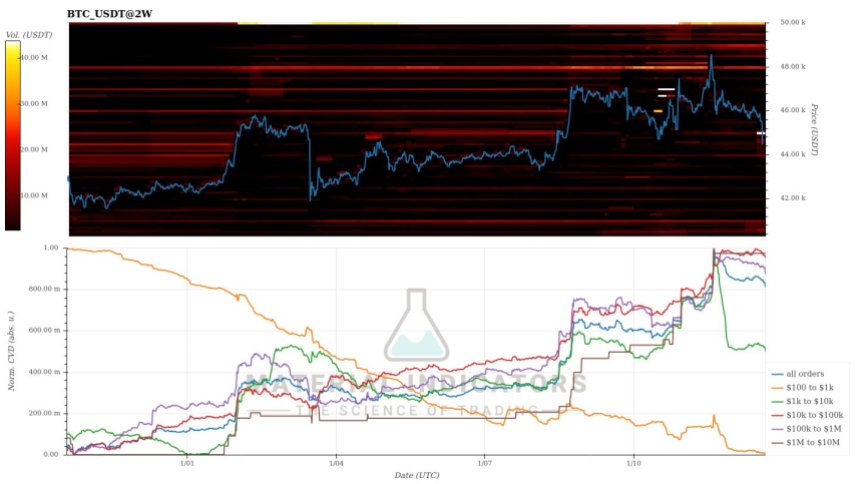
Martinez’s observations further indicate that Bitcoin’s price range around $42,560 has emerged as a highly significant interest zone. 

Within this range, an impressive total of 912,626 BTC has been transacted. This is expected to be a significant support level, potentially preventing further downside movements and fostering increased buying interest.

These trends collectively contribute to a positive market outlook, suggesting that despite potential price drops, Bitcoin remains an attractive asset for long-term investment.

Bitcoin

Featured image from Shutterstock, chart from TradingView.com 

Bitcoin Price Suffers Post-Spot ETF Blues, Drops 7% To $43,200

The introduction of Bitcoin (BTC) exchange-traded funds (ETFs) has triggered a significant sell-off, leading to a sharp decline in the Bitcoin price.

After gaining approval and commencing trading on Thursday, the ETFs have prompted a “sell the news” event, causing Bitcoin’s value to plummet from its initial trading price of $46,500 at the time of approval to a low of $43,200 within a matter of hours on Friday.

Over the past 24 hours, Bitcoin, the largest cryptocurrency by market capitalization, has experienced a 7% drop. Its gains over the past 30 days have been limited to a mere 4%, erasing much of the progress made during that period. 

Additionally, as selling pressure continues to mount following the approval, there are indications that the Bitcoin price may face further downward pressure.

Bitcoin Price Under Pressure

CryptoQuant analyst J.A. Maartunn observed significant sell orders in Bitcoin’s two-week chart on Wednesday. Notably, three clusters of sell orders were positioned between $46,100 and $48,000, comprising stacks of 755, 1,031, and 794 BTC, respectively.

According to the CryptoQuant analyst, such patterns are typically associated with market tops, unless these orders are later withdrawn or executed.

This influx of sell orders may help explain the lackluster response to the ETF approvals until now, as it appears that selling pressure has been building up. However, the situation has intensified even further. 

According to Maartunn, additional sell orders were detected on Friday, indicating that the seller is not yet finished. Two substantial sell orders have been placed just above the current Bitcoin price: one for 894 BTC at $44,000 and another for 1,071 BTC at $45,100.

Bitcoin price

These developments suggest that market participants are taking advantage of the ETF news to offload their Bitcoin holdings, leading to increased selling pressure and a subsequent price decline. 

The market’s stabilization following this period of heightened selling pressure remains uncertain. The introduction of ETFs was believed to bring about heightened institutional interest and potentially drive up the Bitcoin price. 

However, it is important to note that the impact of these ETFs is expected to unfold over the long term, rather than being evident within days, weeks, or even months. It will likely take years to fully gauge the effects and consequences of ETF integration on the Bitcoin market.

Bitcoin’s Bullish Structure Remains Intact

Amidst the ongoing selling pressure, several support lines may potentially halt the downtrend and bring positive news for the Bitcoin price and BTC bulls.

Although Bitcoin has already lost its $44,000 support level, there is another crucial threshold at $42,700 that could prevent further decline. If this level holds, there is a chance for Bitcoin to regain the $43,000 mark and reverse the downward momentum.

Bitcoin price

If the $42,700 support is breached, additional support lines come into play. These include $42,300, $41,700, and $41,200, which act as the last barriers before a potential test of the $40,000 support level. The $40,000 mark holds significance as it represents the final support before a potential dip towards $38,000.

However, there is a positive aspect for Bitcoin bulls to consider. The current bullish structure of the cryptocurrency remains intact as long as the dip does not breach the $29,900 mark.

This level marked the beginning of the current bullish uptrend, and its preservation would ensure the maintenance of the overall positive market structure.

Featured image from Shutterstock, chart from TradingView.com 

Bitcoin $42,000 Support Under Pressure As Short Position Inflows Soar

Bitcoin (BTC) recently experienced a sharp decline, tumbling towards $40,000 amid a broader sell-off across the cryptocurrency market. While the most significant token managed to recover some losses, currently trading 4% lower at $42,000, concerns persist regarding the potential for further downside price action before a potential recovery.

Investors Show Caution With Short-BTC Position Inflows

According to a recent CoinShares report, digital asset investment products witnessed their 11th consecutive week of inflows, totaling $43 million. Notably, there was a significant increase in short position inflows due to recent price appreciation and perceived downside risks. 

Europe led with $43 million in inflows, followed by the US with $14 million (with half in short positions). On the other hand, Hong Kong and Brazil experienced outflows of $8 million and $4.6 million, respectively. 

Bitcoin remained the primary focus for investors, attracting $20 million in inflows, bringing the year-to-date inflows to $1.7 billion. Short-Bitcoin positions saw $8.6 million in inflows, suggesting some investors view the current price rises as unsustainable. 

Ethereum (ETH) also saw increased interest, with its sixth week of inflows totaling $10 million, marking a turnaround from previous outflows.

Selling Pressure Mounts As Miners Decrease Bitcoin Holdings

According to Satoshi Club, there are indications that miners are selling their Bitcoin holdings following the recent price drop. Data shows a significant decrease in miners’ BTC holdings, with increasing flows to exchanges, suggesting selling pressure in the market. 

Satoshi Club’s analysis highlights that this trend could be attributed to the anticipated halving in 2024, which will reduce miners’ rewards by half. 

Bitcoin

Additionally, Bitcoin’s net unrealized profit/loss, which indicates the investor profit ratio, has surpassed 0.5 for the first time since December 2021. This suggests that a significant portion of Bitcoin investments are currently profitable, potentially leading to increased selling pressure at current price highs.

BTC’s Bullish Structure Intact, But Deep Correction Threatens Run

In the 1-day chart for Bitcoin, the current trading price is closely aligned with a support level. Despite briefly dipping below this level, Bitcoin has managed to recover and trade above it, mitigating further declines.

However, in the event of continued selling pressure and an inability to maintain its current price level, Bitcoin’s next critical level of support would be $39,990. 

Bitcoin

It is worth noting that during the previous hype surrounding Bitcoin’s milestone, many traders entered long positions below the current levels. This influx of long positions could trigger a liquidation hunt before a recovery ensues.

If such a scenario unfolds, the hunt for liquidations could drive Bitcoin’s price further down, potentially testing support levels at $38,700 and $37,800.

On a positive note, Bitcoin’s current bullish structure would remain intact unless a significant correction occurs, pushing the price below the $29,900 level. This level began Bitcoin’s current bull run in late October.

The future outcome hinges on whether Bitcoin can successfully hold its nearest support levels and facilitate a recovery that shifts the focus from hunting long positions to hunting short sellers, eventually regaining previously conquered territories.

Featured image from Shutterstock, chart from TradingView.com