This Bitcoin Metric Foreshadowed Recent Price Drops, Quant Reveals

A quant has pointed out how a Bitcoin metric may have detected selling pressure in the market, and therefore, the subsequent price drops, in advance.

Bitcoin CDD Registered Spikes Before Recent Price Plunges

In a new post on X, an analyst has discussed about how the Coin Days Destroyed (CDD) on-chain indicator may be used to identify selling pressure in the market early.

A “coin day” refers to the quantity that 1 BTC accumulates after staying still on the blockchain for 1 day. When a token stays dormant for a while, it naturally accumulates some number of coin days, and once it’s finally transferred on the network, its coin days counter resets back to zero.

The coin days that this token had been carrying prior to this movement are said to be “destroyed” by the transaction. The CDD keeps track of the total number of such days being reset across the network on any given day.

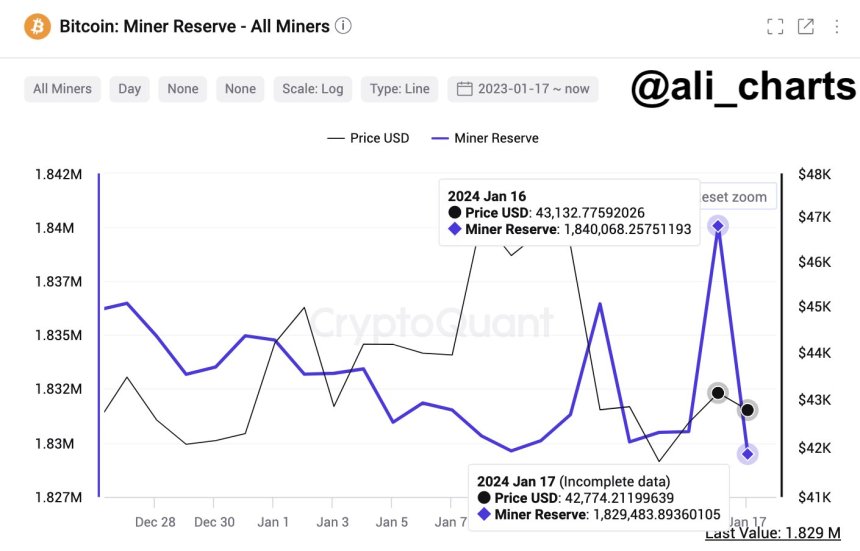
Now, here is a chart that shows the trend in the CDD for Bitcoin over the last couple of months:

Bitcoin CDD

As displayed in the above graph, the Bitcoin CDD observed a large spike just a few days ago. Whenever this metric’s value shoots up, it means that a large amount of coins previously dormant are now on the move.

Such transfers are generally correlated with the long-term holder whales, who are large entities who carry their coins for significant periods, and thus, accumulate a large number of coin days.

Often, when these dormant entities finally break their silence, it’s for selling-related purposes. As such, spikes in the CDD can be an indication that the HODLer whales have decided to do some selling.

In the chart, the quant has highlighted the major spikes that the indicator observed during the last two months. It would appear that following the onset of such spikes, the asset’s price has generally gone on to witness some bearish action.

The aforementioned spike from a few days ago, too, has proven to be bearish for the asset so far as it occurred when Bitcoin had recovered towards $67,000, and the price has since erased this recovery. It would appear that some of these diamond hands had looked at this surge as an exit opportunity.

Last month, the CDD had seen two spikes even larger than this recent one. These spikes had occurred near what continues to be the top for the rally so far. Thus, the selling pressure from HODLers may have played a role in this top and the subsequent drawdown that followed.

Given the relationship that this metric has appeared to have held with the Bitcoin price, it may be worth keeping an eye on it, as it may continue to indicate the onset of selling pressure in the near future as well.

BTC Price

Bitcoin has continued its bearish trajectory during the past day as it has now slipped towards the $62,300 level.

Bitcoin Price Chart

Bitcoin Price At Risk? Grayscale’s $335M Coinbase Transfer Stirs $30,000 Plunge Potential

The Bitcoin price has experienced a notable shift as selling pressure mounts, with BTC bears gaining the upper hand. Asset manager Grayscale, the owner and manager of the Grayscale Bitcoin Trust (GBTC), is a significant contributor to this trend. 

Since the trading of spot Bitcoin exchange-traded funds (ETFs) began on January 12, Grayscale has been on a selling spree, as evidenced by substantial transfers of BTC to the United States-based crypto exchange Coinbase.

Bitcoin Price Under Pressure As Grayscale Selling Spree Continues

According to Akrham Intelligence data, in addition to the previously reported 69,994 BTC ($2.9 billion) transfers, Grayscale sent an additional 8,593,075 BTC (approximately $335.19 million) to the exchange on Tuesday, suggesting the possibility of further selling activities.

Bitcoin price

These developments have affected the Bitcoin price, which has experienced a significant downtrend, declining by 20% over the past week and a half. 

On Tuesday, the largest cryptocurrency dropped as low as $38,500, placing considerable pressure on a crucial support level. Despite the bearish pressure, the $38,500 support level has demonstrated resilience so far, with the cryptocurrency rebounding to $39,300 at the time of writing. 

Nevertheless, the duration of Grayscale’s selling spree remains uncertain, and if market sentiment continues to turn negative, Bitcoin could potentially revisit the $30,000 mark. This figure is just above the key $29,000 level that marked the beginning of the bull run that took Bitcoin to its 22-month high of $49,000 on January 11th.

Bears On The Rise

If the $38,500 threshold succumbs to Grayscale’s selling pressure and profit-taking, market observers should closely monitor the $37,750 level as the next resistance. 

Failure to hold above this level would open the door to a potential decline toward the major resistance at $35,600, which could further prevent a dip to the next support level at $33,000.

However, if these support levels are breached and the Bitcoin price continues its downtrend, the next significant key levels to watch for bullish momentum would be $29,000 to $30,000. A breakdown below these levels could signal an end to the current bull market structure and grant the bears the upper hand in the mid-term, at least until the anticipated halving event in April. 

Historically, halving events have acted as major catalysts for the Bitcoin price, and their influence has been demonstrated.

As the Bitcoin market faces intensified selling pressure and Grayscale’s ongoing selling spree, market participants remain cautious about the potential for a significant price plunge. The coming days and weeks will be critical in determining whether Bitcoin can regain its bullish momentum or if it will succumb to further downward pressure.

Bitcoin price

Featured image from Shutterstock, chart from TradingView.com

Expert Analysis: Six Factors Suggest Bitcoin Price Won’t Drop Below $37,800

In the past month, the Bitcoin price has experienced a significant decline after reaching a 22-month high of $49,000. Currently, the largest cryptocurrency has fallen below the crucial $40,000 mark, raising concerns about the prospects of the ongoing bull run and the overall bullish market structure. 

However, there are indications that the bottom of the current downtrend may be near, potentially setting the stage for a potential price reversal.

Bitcoin Price To Avoid Plummeting To Low $30,000s

Market analyst Marco Johanning sheds light on the situation, offering insights into the Bitcoin price movement. Johanning suggests that it won’t be long until Bitcoin reclaims the $41,500 level or potentially rises from a lower level if a specific scenario unfolds. 

According to Johanning, Bitcoin will finally encounter significant liquidity on the downside. Notably, the price has touched around below $39,000 multiple times, indicating the presence of substantial liquidity at these lows. 

Moreover, Johanning addresses the skepticism surrounding the price of around $37,800, arguing against widespread expectations of a drop into the low $30,000 range. 

Johanning emphasizes that the primary liquidity lies below $40,000 and is not in the low $30,000 range. Traders profited from the low $30,000 range have likely adjusted their stop orders to protect their gains, creating a layer of support below the recent equal lows. 

As the price starts hitting these stop orders, automatic selling occurs, further down the price until it encounters significant buy pressure. The analyst points out a daily order block at $37,700 and high timeframe (HTF) support at $38,5000, indicating the potential for notable buy pressure in these price regions. 

Johanning also highlights the likelihood of filling Chicago Mercantile Exchange (CME) gaps and Imbalances, with the next imbalance anticipated below $33,000.

Short Squeeze Rally Imminent? 

According to Johanning, the prevailing sentiment reveals many bears waiting to short a market dump. Johanning predicts that a short squeeze could occur once the price reverses, leading to a rapid price increase.

In terms of Fibonacci retracement levels, Johanning suggests that since the Bitcoin price has already lost the $40,200 level, it could potentially fall to the 0.5% Fibonacci level, which coincides with those above the $37,800 level. 

Johanning speculates that the price may briefly touch $37,800 before closing above the HTF support level of $38,500, setting the stage for a potential upward movement.

The recent downtrend in Bitcoin’s price has raised concerns about continuing the bull run. However, market analyst Marco Johanning presents several key arguments supporting the possibility of a price reversal. 

Bitcoin price

With Bitcoin’s current price at $38,900, there is a possibility of increased buying pressure in this region. The support wall at $38,5000 has demonstrated resilience thus far, and its performance will be closely observed. 

If the support wall fails to hold, the market will observe how the $37,800 price level performs and whether it aligns with the analyst’s thesis.

Featured image from Shutterstock, chart from TradingView.com

Bitcoin Long Positions Surge On Bitfinex: Whales Add 4,230 BTC, Signaling Potential Price Reversal

In a surprising turn of events, the approval of spot Bitcoin (BTC) exchange-traded funds (ETFs) has not yielded the anticipated immediate upside impact on the Bitcoin price. 

Contrary to expectations within the crypto community, BTC has experienced a sharp drop of over 16% since the ETF approval on Wednesday, January 11, dipping below the key $40,000 level. The failure of BTC bulls to hold the support level has led to a testing phase at the $38,000 level, accompanied by a 4.5% price drop within the past 24 hours.

Bitfinex Whales Buck The Trend

Amidst the market volatility, according to Datamish, Bitfinex whales have accumulated Bitcoin long positions since November 2023. This accumulation of approximately 4,230 BTC since January 17 marks the first sustained increase in Bitfinex BTC long positions following a sharp decline in November last year. 

Bitcoin

However, the recent downturn in the BTC price can be partly attributed to increased selling pressure from miners and asset manager Grayscale. Grayscale has notably increased its BTC sell-off since the ETF trading commenced. 

Transferring a significant amount of BTC from the Grayscale Trust address to Coinbase, totaling 69,994 BTC ($2.9 billion), has influenced the market dynamics. 

Additionally, reports indicate substantial sell-offs of Grayscale’s Bitcoin Trust GBTC shares, including a notable sale of 22 million GBTC shares by the FTX estate, worth nearly $1 billion. 

Bitcoin Liquidation Zones Wiped Off

The impact of Grayscale’s sell-off is evident in CoinGlass’ liquidation heatmap, which shows notable liquidation zones being wiped off in the 1-week chart. 

While Grayscale’s BTC dump has contributed to the price drop, the increased accumulation of BTC long positions on Bitfinex indicates a potential change in sentiment. A price reversal could occur if the $38,000 support line holds, pushing BTC back above $40,000.

Bitcoin

Furthermore, excluding Grayscale, institutional investors and asset managers involved in the ETF market have collectively acquired over 86,320 BTC at an average price of $42,000, representing a substantial $3.63 billion investment. 

Market experts such as Ali Martinez suggest that these institutions are likely to adopt a strategic, long-term view rather than engage in peak purchases. This level of institutional investment underscores the growing recognition of Bitcoin as a legitimate asset class and signifies confidence in its long-term growth potential.

Bitcoin

Currently, the Bitcoin price is at $38,800, reflecting a substantial year-to-date decline of over 12% and a 9.7% drop in the past seven days. The duration and extent of the selling pressure caused by Grayscale’s BTC dump remain uncertain, leaving the question of how much further the BTC price may decline.

Featured image from Shutterstock, chart from TradingView.com 

Bitcoin Expected To Mirror Historical Trends: Glassnode Sets $120K Price Prediction For 2024

Bitcoin (BTC), the largest cryptocurrency in the market, has encountered a significant downturn following the waning hype around exchange-traded funds (ETFs), resulting in a 9% decline over the past fourteen days. 

However, Glassnode co-founders remain optimistic, asserting that the recent price corrections align with historical patterns and could propel Bitcoin to new heights, nearly doubling its current all-time high (ATH) of $69,000.

Healthy Market Correction?

In their latest analysis, the co-founders of the blockchain analytics firm posted on X (formerly Twitter), highlighting Bitcoin’s movement to the 6.618 Fibonacci Extension after a Bull Flag Correction. 

They draw parallels between the current correction and similar market conditions observed in late 2017 and 2020. The question arises: Will history repeat itself in 2024, and will Bitcoin reach its 6.618 Fibonacci Extension during this bullish market, setting a target of approximately $120K?

Bitcoin

Examining the chart above, the analysis by the Glassnode co-founders reveals a comparable price correction following Bitcoin’s breakout above the $10,000 price level, which initiated the bull trend that propelled the cryptocurrency to a $15,000 increase before reaching its current ATH of $69,000.

Likewise, Bitcoin exhibited a similar bull flag pattern after surpassing the $29,000 price level, leading to a 22-month high of $48,900 on January 11. Notably, this surge occurred shortly after the approval of Bitcoin spot ETFs by the U.S. Securities and Exchange Commission (SEC).

Considering these developments, the key to Bitcoin’s future trajectory lies in maintaining support around the $40,000 level and further consolidation above it. If these conditions are met in the coming months, Bitcoin has the potential to reach the 6.618 Fibonacci extension, pushing its price as high as $120,000.

New All-Time Highs Expected For Bitcoin

Like Glassnode co-founder’s recent price analysis, crypto analyst Crypto Con also relies on historical patterns to gauge the future price action of BTC. According to Crypto Con, the mid-top of this Bitcoin price cycle occurred slightly faster than previous cycles but slower than the third cycle. 

Notably, this mid-top represents the only instance where it occurred outside of an early top, as indicated by the purple and yellow dots on the chart provided by the analyst.

Bitcoin

Despite the 2019 mid-top occurring a year earlier than expected, the cycle top still manifested within the usual timeframe, plus or minus 21 days from November 28th, 2021. 

Crypto Con stresses that there is currently no evidence apart from complex theories to support the notion of an accelerated cycle. The analyst cautions against assuming that ETFs prevent potential Bitcoin price corrections. 

After November 28th, 2024, Crypto Con predicts the emergence of new all-time highs for the Bitcoin price of $90,000 or $130,000 and significant growth for the cryptocurrency market. 

Bitcoin

At the time of writing, BTC is trading at $40,590, down 2.5% in the past 24 hours. If this level is breached, Bitcoin could drop towards the $37,650 level as it is the next major support for the cryptocurrency.

Featured image from Shutterstock, chart from TradingView.com

Bloodbath For Bitcoin: Grayscale’s $529 Million BTC Move To Coinbase Pushes Price Below $41,000

Bitcoin (BTC), the largest cryptocurrency in the market, has experienced a sharp drop below the $41,000 mark as exchange-traded funds (ETFs) for Bitcoin went live on January 12. 

The subsequent profit-taking, selling pressure, and outflows from Grayscale’s Bitcoin Trust ETF (GBTC) played a significant role in the downward trend.

Grayscale’s Bitcoin Transfers To Coinbase Intensify

On Tuesday, NewsBTC reported that six days ago, Grayscale initiated the first batch of BTC outflows from their holdings to a Coinbase, totaling 4,000 BTC (approximately $183 million) over six days. 

However, the asset manager resumed outflows from the Trust to the exchange on Tuesday, sending an additional 11,700 BTC (equivalent to $491.4 million) to Coinbase. 

Furthermore, on Friday, data from Arkham Intelligence revealed that 12,865 BTC ($529 million) were transferred from the Grayscale Trust address to Coinbase Prime. 

Bitcoin

In total, the Grayscale Trust address has transferred 54,343 BTC ($2.313 billion) to Coinbase Prime during the opening hours of the US stock market over five consecutive trading days since January 12, which has undoubtedly contributed to the downtrend in Bitcoin’s price.

Selling Frenzy Among BTC Miners

In addition to Grayscale’s selling spree, there has been increased selling activity by Bitcoin miners ahead of the upcoming Bitcoin halving. 

Crypto analyst Ali Martinez highlights that on-chain data from CryptoQuant indicates a substantial increase in selling activity by BTC miners. In the past 24 hours, miners offloaded nearly 10,600 BTC, with a value of approximately $455.8 million.

The persistent selling pressure has caused BTC to trade at $40,900, reflecting a slight 0.2% decrease over the past 24 hours. 

Bitcoin

The downtrend has been evident across various time frames, with declines of 5%, 6%, and 7% over the seven, fourteen, and thirty-day periods, respectively. However, despite these recent setbacks, Bitcoin remains remarkably positive year-to-date, with an impressive 98% gain.

Overall, the combined impact of Grayscale’s Bitcoin Trust ETF outflows and increased selling activity by miners has intensified the downward pressure on Bitcoin’s price, breaching the critical support level of $41,000. 

The focus now turns to how Bitcoin bulls will defend the crucial $40,000 support level, which stands as the last line of defense before a potential dip toward the $37,700 mark.

Bitcoin

Should this support level fail to hold, the Bitcoin market could witness further price declines, potentially pushing the price down to the $35,800 mark. However, with the Bitcoin halving scheduled for April, bullish investors are hopeful that this event will catalyze a significant bull run.

Featured image from Shutterstock, chart from TradingView.com

Bitcoin Price Suffers Post-Spot ETF Blues, Drops 7% To $43,200

The introduction of Bitcoin (BTC) exchange-traded funds (ETFs) has triggered a significant sell-off, leading to a sharp decline in the Bitcoin price.

After gaining approval and commencing trading on Thursday, the ETFs have prompted a “sell the news” event, causing Bitcoin’s value to plummet from its initial trading price of $46,500 at the time of approval to a low of $43,200 within a matter of hours on Friday.

Over the past 24 hours, Bitcoin, the largest cryptocurrency by market capitalization, has experienced a 7% drop. Its gains over the past 30 days have been limited to a mere 4%, erasing much of the progress made during that period. 

Additionally, as selling pressure continues to mount following the approval, there are indications that the Bitcoin price may face further downward pressure.

Bitcoin Price Under Pressure

CryptoQuant analyst J.A. Maartunn observed significant sell orders in Bitcoin’s two-week chart on Wednesday. Notably, three clusters of sell orders were positioned between $46,100 and $48,000, comprising stacks of 755, 1,031, and 794 BTC, respectively.

According to the CryptoQuant analyst, such patterns are typically associated with market tops, unless these orders are later withdrawn or executed.

This influx of sell orders may help explain the lackluster response to the ETF approvals until now, as it appears that selling pressure has been building up. However, the situation has intensified even further. 

According to Maartunn, additional sell orders were detected on Friday, indicating that the seller is not yet finished. Two substantial sell orders have been placed just above the current Bitcoin price: one for 894 BTC at $44,000 and another for 1,071 BTC at $45,100.

Bitcoin price

These developments suggest that market participants are taking advantage of the ETF news to offload their Bitcoin holdings, leading to increased selling pressure and a subsequent price decline. 

The market’s stabilization following this period of heightened selling pressure remains uncertain. The introduction of ETFs was believed to bring about heightened institutional interest and potentially drive up the Bitcoin price. 

However, it is important to note that the impact of these ETFs is expected to unfold over the long term, rather than being evident within days, weeks, or even months. It will likely take years to fully gauge the effects and consequences of ETF integration on the Bitcoin market.

Bitcoin’s Bullish Structure Remains Intact

Amidst the ongoing selling pressure, several support lines may potentially halt the downtrend and bring positive news for the Bitcoin price and BTC bulls.

Although Bitcoin has already lost its $44,000 support level, there is another crucial threshold at $42,700 that could prevent further decline. If this level holds, there is a chance for Bitcoin to regain the $43,000 mark and reverse the downward momentum.

Bitcoin price

If the $42,700 support is breached, additional support lines come into play. These include $42,300, $41,700, and $41,200, which act as the last barriers before a potential test of the $40,000 support level. The $40,000 mark holds significance as it represents the final support before a potential dip towards $38,000.

However, there is a positive aspect for Bitcoin bulls to consider. The current bullish structure of the cryptocurrency remains intact as long as the dip does not breach the $29,900 mark.

This level marked the beginning of the current bullish uptrend, and its preservation would ensure the maintenance of the overall positive market structure.

Featured image from Shutterstock, chart from TradingView.com 

Bitcoin Price Targets: MVRV Points To $52,000 And $70,000 Levels For BTC, Expert Suggests

In a recent development, the Bitcoin price witnessed a remarkable surge of 7% within 24 hours, reaching a high point of $45,300. This significant price increase coincides with the anticipation surrounding the potential approval of a Bitcoin spot exchange-traded fund (ETF) by the US Securities and Exchange Commission (SEC). 

In addition, market experts, backed by multiple models aligning to indicate increased price action and bullish momentum, suggest that Bitcoin could soon reach the $50,000 level and potentially establish a new all-time high (ATH).

Bitcoin Price Poised To Reach New All-Time High? 

At the forefront of this analysis is Ali Martinez, a renowned crypto analyst, who emphasizes the valuable insights provided by the Bitcoin Market Value to Realized Value (MVRV) pricing bands. 

These bands serve as a metric to analyze the price movement and potential levels of Bitcoin, or any other cryptocurrency, by comparing the market value to the average value at which coins were last moved on-chain. The MVRV ratio assesses whether Bitcoin is overvalued or undervalued relative to its historical on-chain activity. 

A high MVRV ratio suggests that the market value of Bitcoin has surpassed the average value at which coins were last moved, indicating a potential overvaluation. Conversely, a low MVRV ratio may indicate that Bitcoin is undervalued.

Bitcoin price

Considering these factors, Martinez highlights the significance of the MVRV pricing bands, which reveal key price targets for Bitcoin at $52,680 and $70,250, surpassing its previous ATH of $69,000. 

This analysis presents an optimistic outlook for Bitcoin’s future performance and reinforces the belief among investors that the cryptocurrency’s upward momentum is likely to continue.

However, despite these Bitcoin price projections that could propel the largest cryptocurrency on the market into uncharted waters, another analyst points to a more prudent prediction.

Cooling Period For BTC? 

According to renowned crypto analyst Crypto Con, despite a year-long bullish stance, he believes it is time for a cooldown as the new year, 2024, begins.

Crypto Con predicts a 30% correction from the directional movement index (DMI) overheat zone, projecting prices around $30,000. The overheat zone mentioned by Crypto Con suggests that the price of Bitcoin has experienced a significant upward movement and may be due to a correction or cooling period. 

Bitcoin price

As seen in the chart above, when the price enters this zone, it is seen as a signal that the trend may have become overextended and could potentially reverse or experience a pullback.

Drawing parallels to the example in 2019, characterized by a double peak in red, Crypto Con anticipates a drawdown that is both smaller in magnitude and shorter in duration. 

Furthermore, the analyst points to the consistent support offered by diagonal green zones throughout each cycle, suggesting a pattern that has been held thus far.

While some analysts project a new all-time high for the Bitcoin price, reaching uncharted waters above $70,000, others, such as Crypto Con, advocate for a cooling period and anticipate a correction in the near term.

Bitcoin price

Featured image from Shutterstock, chart from TradingView.com

Mt. Gox Repayment Rumors Cause Bitcoin Price To Drop To $42,000, Market In Turmoil

Mt. Gox, the infamous Bitcoin exchange that suffered a major hack over a decade ago, has allegedly finally begun the process of repaying its customers for the 850,000 lost Bitcoin. This news has sent shockwaves through the market, causing a momentary disruption in the Bitcoin price uptrend.

As a result of these developments, the current price of Bitcoin stands at $42,625, with a 24-hour trading volume of $22,655,498,534.64. 

However, the market has witnessed a -2.40% decline in the past 24 hours, reflecting the uncertainty caused by the Mt. Gox repayment proceedings.

Bitcoin Price Plunges Amidst Mounting Speculation

Reports from participants in the mtgoxinsolvency subreddit group indicate that some individuals have already received payouts in yen via PayPal. 

However, those who opted for cash deposits into their bank accounts have not reported any inflows as of yet. Several users have shared notifications they received, alerting them to a system error that resulted in double payments. 

These users are now allegedly being requested to return the excess funds to the Rehabilitation Trustee promptly.

Moreover, the Rehabilitation Trustee has reached out to affected individuals to refund the mistakenly transferred amount, which was the second transfer, as the first transfer was the official repayment. 

Bitcoin price

Users have been instructed to use PayPal’s “Refund” feature to return the funds to the Rehabilitation Trustee’s account. Alternatively, they can transfer an equivalent amount of money to the Rehabilitation Trustee’s PayPal account if the “Refund” feature is unavailable.

While some users have confirmed receiving their repayments, there is uncertainty surrounding the timing of Bitcoin reimbursements or if they are taking effect.

No Bitcoin Outflows Detected From Mt. Gox?

In a recent statement by CryptoQuant co-founder and CEO, Ki Young Ju, it has been confirmed that “no Bitcoin outflows have been recorded from the Mt. Gox Trustee wallet at this time.” 

Furthermore, the trustee responsible for managing the rehabilitation proceedings of Mt. Gox, the now-defunct Bitcoin exchange, has yet to provide any official statements explaining the absence of outflows from the wallet. 

Consequently, the cryptocurrency community finds itself on edge, eagerly awaiting updates regarding the timing and method of Bitcoin reimbursements.

Once again, the cryptocurrency community has been hit by another bout of misinformation surrounding the long-awaited Mt. Gox exchange repayment to its customers. 

The spread of this news has had a notable impact on market sentiment and has stirred volatility in the Bitcoin price. The future timeline and potential effects of the exchange’s repayment, slated for 2024, remain uncertain.

Bitcoin price

Featured image from Shutterstock, chart from TradingView.com  

Countdown To Bitcoin ETF 2024 Decision: Traders Employ Hedging Tactics, Bloomberg Unveils

As the long-awaited deadline for a positive or negative decision on spot Bitcoin ETF applications approaches, Bloomberg reports that the BTC options market is seeing increased hedging activity as traders prepare for a crucial decision on January 10th.

The report indicates a surge in open interest for put options expiring on Jan. 12, suggesting that market participants are taking steps to mitigate potential losses in the event of a negative verdict by the US Securities and Exchange Commission (SEC) regarding these index funds holding the cryptocurrency. 

Market Readies For Bitcoin ETF Verdict

The Bloomberg report highlights that the open interest for put options, which allow holders to sell Bitcoin, has seen a significant increase for contracts expiring on January 12. 

This surge in open interest has resulted in a higher put-to-call ratio for these specific options compared to contracts with expiration dates further out from the January 10 deadline. 

As seen in the chart below, the most prominent strike prices for the put contracts are $44,000, $42,000, and $40,000, respectively, indicating that put holders could exercise their options to minimize losses in case of a negative market reaction to the SEC decision.

Bitcoin ETF

The put-to-call ratio, considered a measure of overall market sentiment, stands at 0.67 for the January 12 options contracts, indicating a more cautious approach among traders. 

Ryan Kim, head of derivatives at FalconX, suggests that leveraged/speculative traders are employing Bitcoin put options to protect their leveraged longs, anticipating significant price movements in either direction. 

The higher put-call ratio for January 12 options further reflects the market’s desire for protection against a potential negative decision.

The surge in open interest for put options expiring on January 12 indicates a growing need for protection in case of an unfavorable ruling. While Bitcoin’s rally has softened the impact of its 2022 decline, market expectations for ETF approval may already be priced in, posing potential risks for the market. 

BTC’s Price Resistance And Potential Dip 

Bitcoin has experienced a remarkable rally this year, with expectations for ETF approval driving its price up by more than 60% since mid-October. 

However, the Bloomberg report suggests that the surge in demand for the anticipated ETFs may already be factored into the token’s price, potentially exposing the market to a “sell the news” scenario in the second week of January. 

Furthermore, QCP Capital, a Singapore-based crypto asset trading firm, predicts topside resistance for Bitcoin in the range of $45,000 to $48,500 and a possible retracement to $36,000 levels before the uptrend resumes.

Bitcoin ETF

Bitcoin is currently trading at $43,400, experiencing a 1% decline over the past 24 hours. Over the past 14 days, the cryptocurrency has shown a sideways price movement with a slight decrease of 0.4%. 

Given Bitcoin’s well-known volatility, it remains uncertain how the market will react as the looming decision and potential catalysts draw near, and how these factors will impact its price dynamics.

However, the upcoming decision is not the sole catalyst that can potentially drive Bitcoin’s price in 2024. The cryptocurrency is also anticipated to experience a significant catalyst in April 2024, known as the halving event

This event has historically resulted in an upward surge in Bitcoin’s price, and it is predicted to propel the cryptocurrency beyond its previous all-time high (ATH) of $69,000 throughout the upcoming year.

Featured image from Shutterstock, chart from TradingView.com 

Bitcoin Price Surges On Positive News: FASB’s Fair Value Recognition Reignites $42,000 Support Recovery

The Bitcoin price experienced a notable downturn as selling pressure intensified, resulting in a decline of over 4% from its annual peak of $44,500. This downturn was further exacerbated by the loss of the crucial $42,000 support level. 

However, the largest cryptocurrency in the market received a substantial uplift from the US Financial Accounting Standards Board (FASB), which has spurred a rapid 1.8% surge in BTC’s value within the past two hours. As a result, Bitcoin has successfully recovered the $42,000 support level.

FASB’s Fair Value Recognition Brings Clarity To BTC?

In a significant development for the cryptocurrency industry, the FASB has announced new accounting rules that require companies, including prominent entities like MicroStrategy, Tesla, and Block, to measure their cryptocurrency holdings at fair value. 

These rules, set to go into effect in 2025, allow businesses to capture the real-time highs and lows of their Bitcoin and Ethereum (ETH) assets, providing a more accurate representation of their holdings.

Under the previous accounting practices, companies were only allowed to record the lows, resulting in a one-sided accounting treatment that often led to reduced valuations and diminished earnings for businesses holding cryptocurrencies. The highly volatile nature of crypto values further exacerbated the issue.

The FASB’s new rules address these concerns by mandating the recording of cryptocurrencies at fair value, a measurement technique aimed at reflecting the most up-to-date value of these assets. 

Changes in fair value will now be recorded in net income, allowing companies to account for fluctuations in the value of their crypto holdings more comprehensively.

The positive news for BTC lies in the fact that the new FASB rules provide greater transparency and accuracy in assessing the true value of cryptocurrency assets. By capturing fluctuations in fair value, companies will have a more realistic representation of their holdings, enabling better decision-making and financial reporting.

Bitcoin, being the most widely recognized and valuable cryptocurrency, stands to benefit significantly from these changes. The recognition of its fair value allows companies to showcase the true worth of their BTC holdings, potentially boosting investor confidence and attracting further institutional interest.

Turbulent Times Ahead For Bitcoin Price

Following these recent developments, the Bitcoin price has successfully rebounded to previously lost levels, demonstrating heightened volatility after a brief consolidation phase just below $42,000.

However, according to CoinGlass’ liquidation heatmap, Bitcoin’s price may be facing further volatility that could lead to a significant amount of liquidation of both long and short positions. 

Bitcoin price

The liquidation heatmap from CoinGlass highlights substantial indications of liquidation leverage exceeding $200 million both above and below the current Bitcoin price. 

Of particular concern is the thick liquidation leverage below $41,000, as seen in the chart above, which, combined with the prevailing trend, could become a probable target for the Bitcoin price in the coming days.

Conversely, following BTC’s correction, additional liquidation leverage has emerged in CoinGlass’s heatmap, particularly in the $42,000 and $43,000 range of short positions. This added selling pressure has contributed to the retracement of the Bitcoin price.

This potential scenario suggests a potential price swing up and down before a stable continuation of either the downward or upward momentum. The outcome remains uncertain as to which side will give way first and what prevailing trend will shape the latter part of the year.

Bitcoin price

Featured image from Shutterstock, chart from TradingView.com

Bitcoin $42,000 Support Under Pressure As Short Position Inflows Soar

Bitcoin (BTC) recently experienced a sharp decline, tumbling towards $40,000 amid a broader sell-off across the cryptocurrency market. While the most significant token managed to recover some losses, currently trading 4% lower at $42,000, concerns persist regarding the potential for further downside price action before a potential recovery.

Investors Show Caution With Short-BTC Position Inflows

According to a recent CoinShares report, digital asset investment products witnessed their 11th consecutive week of inflows, totaling $43 million. Notably, there was a significant increase in short position inflows due to recent price appreciation and perceived downside risks. 

Europe led with $43 million in inflows, followed by the US with $14 million (with half in short positions). On the other hand, Hong Kong and Brazil experienced outflows of $8 million and $4.6 million, respectively. 

Bitcoin remained the primary focus for investors, attracting $20 million in inflows, bringing the year-to-date inflows to $1.7 billion. Short-Bitcoin positions saw $8.6 million in inflows, suggesting some investors view the current price rises as unsustainable. 

Ethereum (ETH) also saw increased interest, with its sixth week of inflows totaling $10 million, marking a turnaround from previous outflows.

Selling Pressure Mounts As Miners Decrease Bitcoin Holdings

According to Satoshi Club, there are indications that miners are selling their Bitcoin holdings following the recent price drop. Data shows a significant decrease in miners’ BTC holdings, with increasing flows to exchanges, suggesting selling pressure in the market. 

Satoshi Club’s analysis highlights that this trend could be attributed to the anticipated halving in 2024, which will reduce miners’ rewards by half. 

Bitcoin

Additionally, Bitcoin’s net unrealized profit/loss, which indicates the investor profit ratio, has surpassed 0.5 for the first time since December 2021. This suggests that a significant portion of Bitcoin investments are currently profitable, potentially leading to increased selling pressure at current price highs.

BTC’s Bullish Structure Intact, But Deep Correction Threatens Run

In the 1-day chart for Bitcoin, the current trading price is closely aligned with a support level. Despite briefly dipping below this level, Bitcoin has managed to recover and trade above it, mitigating further declines.

However, in the event of continued selling pressure and an inability to maintain its current price level, Bitcoin’s next critical level of support would be $39,990. 

Bitcoin

It is worth noting that during the previous hype surrounding Bitcoin’s milestone, many traders entered long positions below the current levels. This influx of long positions could trigger a liquidation hunt before a recovery ensues.

If such a scenario unfolds, the hunt for liquidations could drive Bitcoin’s price further down, potentially testing support levels at $38,700 and $37,800.

On a positive note, Bitcoin’s current bullish structure would remain intact unless a significant correction occurs, pushing the price below the $29,900 level. This level began Bitcoin’s current bull run in late October.

The future outcome hinges on whether Bitcoin can successfully hold its nearest support levels and facilitate a recovery that shifts the focus from hunting long positions to hunting short sellers, eventually regaining previously conquered territories.

Featured image from Shutterstock, chart from TradingView.com

SEC’s “Crypto Asset Securities” Alert Boosts Spot Bitcoin ETF Prospects – Here’s Why

As anticipation builds for the long-awaited approval of a spot Bitcoin ETF by the US Securities and Exchange Commission (SEC), an encouraging sign has emerged, further increasing the likelihood of approval

The SEC issued an investor alert regarding “crypto asset securities,” prompting speculation that the spot Bitcoin ETF may be closer than ever. 

Spot Bitcoin ETF Approval On The Horizon?

The recent investor alert issued by the SEC has garnered significant attention in the cryptocurrency community. While the alert does not explicitly mention the spot Bitcoin ETF, many market participants believe it is a positive indicator for its potential approval.

The parallel between the investor alert and the approval of Bitcoin Futures adds to the growing optimism surrounding the spot Bitcoin ETF. Before approving Bitcoin Futures, the SEC issued similar alerts and warnings, indicating their concern and engagement with the underlying asset class. 

Consequently, market observers, including Bloomberg’s ETF expert Erich Balchunas, are interpreting the investor alert on “crypto asset securities” as a potential precursor to the approval of a spot Bitcoin ETF. Balchunas stated: 

Oh snap, SEC tweeting out educational materials, warnings on crypto investing, which is something they also did ahead of $BITO

It is important to note that the SEC will evaluate various factors, including investor protection, market integrity, and compliance with existing regulations, before making a final determination on the spot Bitcoin ETF. 

However, given the increased attention and progress in cryptocurrency, the issuance of the investor alert signifies a step in the right direction.

Potential BTC Surge To $48,000 

Renowned crypto analyst, Crypto Con, has made interesting observations regarding BTC’s current market dynamics that shed light on the potential next steps for the largest cryptocurrency on the market.

According to Crypto Con, money has been pouring into BTC at a rate not witnessed since the last cycle’s peak, with historical data indicating similar patterns on only five prior occasions. 

This influx of funds has heightened the market’s sentiment and created anticipation for potential further price gains. Crypto Con highlights the significance of Bitcoin’s Money Flow Index (MFI), a technical indicator used to measure the strength and volume of funds flowing into or out of an asset, which reached a value of 91.57, historically indicating the presence of additional bullish momentum.

Bitcoin ETF

Furthermore, the analyst identifies the .618 cycle retrace of weekly candle bodies as a point of interest for potential target ranges. This level aligns with other significant price regions, further bolstering its importance. 

Crypto Con suggests that Bitcoin’s price could likely reach the range of $47,000-$48,000 based on these target ranges. However, the analyst also notes that significant price increases are often followed by retracements at this stage in the market cycle.

Crypto Con highlights the potential for a retracement after the completion of the current price rise. The analyst identifies the $31,000-$32,000 range as an area of interest for a potential retracement based on long-term data. 

Bitcoin ETF

As of the time of writing, Bitcoin (BTC) is being traded at $43,800, showcasing a noteworthy recovery within the past 24 hours following a retracement below $42,900 on Thursday. 

While this price rebound is encouraging, it remains uncertain whether the prevailing market dynamics possess sufficient strength to propel Bitcoin beyond its current yearly high of $44,500. There is a possibility that Bitcoin may experience another failed attempt to surpass this level, which could subsequently result in a deeper retracement before witnessing another upward movement.

Featured image from Shutterstock, chart from TradingView.com 

Sam Altman-Backed Crypto Startup Looks To Secure $100 Million For Bitcoin Private Credit Fund

Meanwhile Advisors, a crypto startup backed by the American entrepreneur Sam Altman, has announced plans to raise $100 million for a Bitcoin (BTC) private credit fund. 

The fund, known as Meanwhile Private Credit Fund aims to provide institutional investors with access to BTC while targeting an additional 5% yield denominated in the cryptocurrency.

Bitcoin Rally Sparks Launch Of Meanwhile Advisors Fund

According to a report by The Block, Meanwhile Advisors has launched the fund as Bitcoin continues its recent rally, with prices currently falling from the $44,000 level down to the $43,200 mark. 

Zac Townsend, the co-founder and CEO of Meanwhile Group, stated that the belief is that Bitcoin will appreciate significantly in the future, and the fund offers investors a unique opportunity to increase their exposure to digital assets.

The Meanwhile BTC Private Credit Fund adopts a single-close, closed-end structure. Participating limited partners (LPs) will contribute US dollars to the fund, which will be immediately converted to Bitcoin following the single close. 

Meanwhile will lend this BTC to borrowers to generate the targeted 5% return in Bitcoin. This structure allows LPs to accumulate more Bitcoin if its price appreciates during the fund’s lifecycle without requiring additional principal investment.

Townsend mentioned that the minimum investment amount per LP is $250,000, with no maximum limit. The fund’s investment period spans three years, followed by a four-year harvest period, resulting in a total term of seven years. 

However, capital is returned to investors during harvest, meaning a significant portion of the invested capital may be returned well before the seven-year mark.

Innovative Fee Approach? 

Per the report, the Meanwhile BTC Private Credit Fund charges a 2% management fee and a 20% carried interest fee, both in Bitcoin. The carried interest fee only applies when the LP’s Bitcoin holdings are increased. 

This fee structure ensures that if Bitcoin experiences substantial price appreciation, Meanwhile does not benefit from the price appreciation itself but rather from generating more Bitcoin for the LPs.

Addressing concerns about risk management, Townsend highlighted that the closed structure of the fund eliminates the risk of a “bank run” scenario that can lead to insolvency. Moreover, the fund focuses on making conservative loans to “creditworthy institutional borrowers”, mitigating risks associated with lending to retail investors at higher rates.

The Block also reported that Anchorage Digital serves as the fund’s custodian. Meanwhile Group’s insurance unit has previously launched a Bitcoin-denominated life insurance policy, and Townsend mentioned plans to introduce an accidental death coverage policy in Bitcoin as well.

Bitcoin

When writing, the leading cryptocurrency in the market is trading at $43,200, marking a decrease of nearly 2% within the last 24 hours. This decline follows an unsuccessful attempt to solidify its position above the significant $44,000 milestone. 

Nevertheless, Bitcoin has managed to maintain a 14% increase over the past seven days and is currently holding strong at the support level of $43,000, as it sets its sights on achieving a new annual peak.

Featured image from iStock, chart from TradingView.com

Warning Signals Flash As Bitcoin Surges: Expert Spotlights Potential $25,000 Liquidity Sweep

Bitcoin (BTC), the world’s leading cryptocurrency, has recently witnessed a surge in price, reaching a new yearly high of $42,100 on Monday. However, this significant price increase has raised concerns among market participants about the possibility of a potential correction and a subsequent liquidation sweep, which could drive the price down to as low as $25,000.

Second Capitulation And Liquidity Sweep For Bitcoin?

Justin Bennett, a prominent technical analysis expert, acknowledges the remarkable performance of Bitcoin, stating, “It’s been a hell of a run from BTC, and it may very well continue without a significant correction in the short term.” 

However, Bennett highlights that the previous two bear markets concluded with a second capitulation, suggesting the possibility of a similar scenario occurring this time. Bennet cautions against ruling out a liquidity sweep that could drive the price down to $25,000.

To provide further context, liquidity sweep refers to a sudden and drastic move in price that aims to clear out excess leverage and trigger liquidations of overleveraged positions. 

Such a move could lead to a cascading effect, causing the price to drop further as more positions get forcefully closed. The occurrence of a liquidity sweep at the $25,000 level would not only test the resilience of Bitcoin but also serve as a crucial moment for market sentiment.

Bitcoin

As seen in the 2-week chart above shared by Bennet, despite the potential correction in BTC, this could be the last difficulty that Bitcoin bulls experience before the continuation of the bull run; this will be further fueled by the potential approval of Bitcoin spot exchange-traded funds (ETFs) applications by the US Securities and Exchange Commission (SEC), which is expected to push prices even higher. 

A boost from the halving of Bitcoin will further add to the bullish momentum and sentiment in the market, which could push the price of BTC to new all-time highs (ATH).

Additionally, historical trends indicate a promising outlook for Bitcoin. Analyst Ali Martinez points out that in the past, strong BTC performance during October and November has been followed by a bullish December. According to Martinez, market participants can anticipate a bullish December ahead if this pattern holds. 

El Salvador’s BTC Investments Prove Profitable

El Salvador’s President Nayib Bukele recently announced that the nation’s investments in Bitcoin have yielded significant profits, refuting previous claims of losses made by critics. 

President Bukele revealed that if El Salvador were to sell its Bitcoin holdings at the current market price, the country would not only fully recover its initial investment but also make a profit of $3,620,277.13.

Bitcoin

Addressing the numerous articles and hit pieces that had ridiculed El Salvador’s Bitcoin investment strategy, President Bukele emphasized that these assessments were based on the cryptocurrency’s market price at the time of evaluation. With Bitcoin’s recent surge in value, the country’s investment has turned profitable.

While acknowledging that the price of Bitcoin will continue to fluctuate, President Bukele reaffirmed that El Salvador remains committed to its long-term strategy and has no intention of selling its Bitcoin holdings. President Bukele stated: 

Of course, we have no intention of selling; that has never been our objective. We are fully aware that the price will continue to fluctuate in the future, this doesn’t affect our long-term strategy.

Bitcoin

At the time of writing, BTC is trading at $41,200, reflecting a notable price increase of 3.8% over the past 24 hours and 12% over the past seven days.

Featured image from Shutterstock, chart from TradingView.com 

MicroStrategy Boosts Bitcoin Holdings With $590 Million Purchase, Totaling 174,530 BTC

In a testament to its unwavering confidence in Bitcoin (BTC), MicroStrategy, one of the largest Bitcoin holding companies, has once again expanded its cryptocurrency portfolio. 

The company’s former CEO, Michael Saylor, announced the acquisition of an additional 16,130 BTC, valued at approximately $593 million. This strategic move comes as Bitcoin enters a phase of accumulation above the $37,000 mark.

MicroStrategy Adds To Bitcoin Stash

As announced, MicroStrategy’s latest purchase was made at an average price of $36,700 per Bitcoin. With this acquisition, the company’s total Bitcoin holdings now stand at an impressive 174,530 BTC. 

Throughout 2023 and previous years, MicroStrategy has consistently demonstrated its commitment to BTC, accumulating a substantial amount of the cryptocurrency. 

The total cost of MicroStrategy’s Bitcoin investments exceeds $5.20 billion, with an average purchase price of $30,252 per Bitcoin. This significant investment reflects the company’s long-term bullish outlook on Bitcoin’s potential as a store of value and hedge against inflation.

As reported by NewsBTC, the company has reaped substantial gains from the recent uptrend in the overall cryptocurrency market and Bitcoin’s impressive price surge. With BTC experiencing a 36% increase since October, Microstrategy has now amassed over $1 billion in unrealized profits.

Bitcoin

Notably, Bitcoin’s positive performance has directly impacted Microstrategy’s stock, traded under the ticker name MSTR. The stock has witnessed a significant surge in value, closely tied to the ongoing bullish momentum of BTC. 

On November 9, as Bitcoin reached its previous yearly high of $38,000, the price of MSTR stock also soared to an all-time high (ATH) of $533 per share. This milestone further proves Microstrategy’s successful investment strategy over the past three years.

Michael Saylor, a prominent advocate for Bitcoin, has been a vocal proponent of the cryptocurrency, emphasizing its superior qualities compared to traditional fiat currencies. 

MicroStrategy’s continued accumulation of Bitcoin reinforces Saylor’s conviction in its long-term prospects and serves as a testament to the company’s belief in the digital asset’s store-of-value properties.

Potential For Short-Term Pullback Looms

In a recent market update by the CryptoQuant author IT Tech, short-term insights on the Bitcoin derivatives market shed light on the current upward momentum and the potential for a minor pullback. 

According to the analysis, the ongoing upward momentum in the Bitcoin market heavily relies on perpetual movement. The rising price of Bitcoin has been a key driving force, contributing to the bullish sentiment. 

However, the Crypto Volatility Divergence (CVD) Spot indicator suggests a relatively flat movement in spot demand. This indicates that a significant increase in immediate spot demand may not support the current price surge.

In the absence of strong spot demand materializing in the market, IT Tech suggests a possible minor pullback in the near term. 

This potential pullback could be attributed to several factors, including profit-taking by traders or a lack of sustained buying pressure from spot investors.

Bitcoin

The analysis also highlights the possibility of Bitcoin liquidations in the short term, which could indicate further upward movement to liquidate late short positions. 

This suggests that additional buying pressure may be from those who have taken short positions on Bitcoin. As these shorts are liquidated, it could continue the upward trend.

Bitcoin

As of the latest update, Bitcoin (BTC) is trading at $37,600, showing a slight decrease of 0.5% over the past 24 hours. However, it has maintained a gain of 1.5% over the past seven days, indicating a period of consolidation for the cryptocurrency

Featured image from Shutterstock, chart from TradingView.com 

Bitcoin Bulls Buckle Up: Seasonal Trends Point To $50,000 Target

Bitcoin (BTC), the largest cryptocurrency on the market, has again failed to consolidate and reach the $38,000 level for the third time, as it is currently experiencing a 3% pullback. This has led the community to speculate that a significant retracement may occur before the bullish momentum resumes and the next uptrend begins. 

However, renowned crypto analyst Adrian Zduńczyk has recently shed light on Bitcoin’s potential next target of $50,000. Zduńczyk’s analysis considers several crucial factors, including the prevailing bullish market sentiment, the ongoing uptrend, the short-term outlook, miner sentiment, and seasonal trends. 

Evidence Of Dominant Bull Market

Zduńczyk notes that the cryptocurrency industry is in a bull market, with Bitcoin reaching a new 52-week high close and experiencing the third wave of the bullish cycle. The correlation between Bitcoin and the S&P 500 has risen, indicating a favorable environment for Bitcoin. High time frame trends are also rising.

Zduńczyk identifies key macro support levels for Bitcoin at $29,000 and $27,000, highlighting growing demand fueled by the anticipation of the approval of spot Bitcoin exchange-traded funds (ETFs) and the upcoming halving event expected in April 2024.

Notably, the daily chart for BTC remains in an uptrend, according to Zduńczyk. He points to a target of $40,000, supported by the appearance of a “golden cross” pattern.

Furthermore, Zduńczyk believes that the rising Simple Moving Average (SMA) 200 serves as “irrefutable evidence” of a dominant bull market since January. These indicators suggest a continuation of the upward trajectory for Bitcoin.

Zduńczyk also identifies key support levels at $35,000 to $35,800, emphasizing that a bullish sentiment prevails as long as Bitcoin remains above these levels. 

Zduńczyk Eyes Bitcoin November Target Of $50,000

Currently, Bitcoin is ranging between $35,500 and $38,000, Zduńczyk notes that the momentum bands are widening, indicating an increase in volatility. The rising 50-day Average True Range (ATR) trend supports this observation.

Fear & Greed Index stands at 69, indicating a mixed sentiment among market participants. Miners, on average, are enjoying a profit increase of 23%. Zduńczyk maintains a positive outlook based on these factors. 

Regarding seasonal trends, October demonstrated a gain of 27%, exceeding the average performance. Historically, November has been the best month for Bitcoin, which has an average gain of 43%, with a target of around $50,000. Notably, December typically adds 7% to November’s closing price.

Bitcoin

Currently, BTC is trading at $36,400, reflecting a 5% and 22% profit over the past fourteen and thirty days, respectively. The focus now shifts to whether BTC’s price can maintain its crucial support levels and sustain its bullish uptrend, potentially reaching the $50,000 milestone supported by historical patterns.

Featured image from Shutterstock, chart from TradingView.com 

Analyst Raises Red Flag On Bitcoin Rally, Predicts Imminent Retreat After 35% Spike

As Bitcoin (BTC) continues to consolidate above the $34,000 mark, aiming to surpass and reclaim its yearly high, theories suggest that a retracement may follow the current upward spike in the coming weeks. 

On this matter, the renowned crypto analyst known by the pseudonym “Crypto Soulz” recently shared insights on the potential short-term retracement for Bitcoin in a recent post on X (formerly Twitter).

BTC’s Local Top At $36,000 Signals Potential Reversal

According to Crypto Soulz, a key resistance level for Bitcoin is identified at $37,370. The analyst suggests that this resistance level will not likely be retested from the current position. 

Additionally, Soulz highlights that liquidity has been absorbed around $36,000, which he considers a “trigger” for taking short positions.

The analyst points out that the local top for BTC was observed at $36,000, where a long wick was formed, followed by a retracement. This price action is seen as a potential indication of a reversal.

Moreover, Crypto Soulz emphasizes using on-chain data as a confluence for BTC positions. Soulz highlights that the spot market showed an uptrend before the perpetual futures contracts followed suit. 

The spot order book (OB) is stated to be increasing but expected to decrease, along with the perpetual market. If $36,000 indeed serves as a local top, the analyst suggests that both spot and perpetual should subsequently decrease.

Furthermore, Soulz highlighted that BTC successfully broke through key technical indicators, such as the 200-day simple moving average (SMA), the 200-week SMA, and the 365-day SMA, which is currently acting as support. 

Bitcoin

Ultimately, Soulz further states that there is no substantial liquidity available above $38,000. The analyst identifies two liquidity pools, as seen in the chart above: the first at $33,000, which he considers its initial target, and the second at $31,000, where a slight bounce may occur.

Bitcoin Potential As Store Of Value

In another development, Jurrien Timmer, Fidelity’s Director of Global Macro, delved into the characteristics of Bitcoin and its potential to serve as a store of value and hedge against monetary debasement.

Drawing parallels to gold, Timmer highlighted Bitcoin’s “unique attributes” and its ability to potentially gain market share in times of inflation and excessive money supply growth.

Timmer acknowledged that Bitcoin had followed a pattern of “boom-bust cycles,” much like its previous market behavior. However, he also emphasized Bitcoin’s evolving role as a commodity currency that aspires to be a store of value. 

Bitcoin

Furthermore, Timmer described Bitcoin as “exponential gold,” suggesting that it shares similarities with gold but with additional growth potential.

While gold has traditionally been recognized as a store of value, Timmer noted its limitations as a medium of exchange due to its deflationary nature and lack of efficiency. 

Timmer drew attention to historical periods, such as the 1970s and 2000s, when gold exhibited strength and gained market share. These periods coincided with structural regimes marked by high inflation, negative real rates, and excessive money supply growth. 

Timmer hinted that Bitcoin, with its potential to serve as a hedge against inflation and debasement, could play a similar role in such environments.

Considering Bitcoin’s attributes and the changing macroeconomic landscape, Timmer expressed optimism about its potential to join the ranks of gold as a valuable asset. 

While acknowledging the volatility and speculative nature of cryptocurrencies, Timmer believes that Bitcoin’s unique characteristics position it as a viable contender in the store of value space.

Bitcoin

Currently, BTC is trading at $34,700, reflecting a 1.5% increase over the past 24 hours as it persists in reaching the $35,000 mark.

Featured image from Shutterstock, chart from TradingView.com 

Bitcoin Leverage Ratio Remains High Despite Recent Drop

On-chain data shows the Bitcoin leverage ratio has continued to stay at high values despite the recent decline in the crypto’s price.

Bitcoin Leverage Ratio Hasn’t Budged Much In Response To Price Plunge

As pointed out by an analyst in a CryptoQuant post, the BTC leverage ratio has remained at high values recently, despite the price declining to $41k.

The “estimated leverage ratio” is an indicator that’s calculated by dividing the open interest with the exchange reserve. In simpler terms, what this metric tells us about is how much leverage Bitcoin futures investors are using at the moment.

Here, “open interest” is the measure of the total amount of futures contracts open on derivatives exchanges. And the “exchange reserve” is the total amount of coins currently present in wallets of all derivative exchanges.

When the value of the Bitcoin leverage ratio goes up, it means investors have started to add more leverage to their positions.

On the other hand, a decline shows futures holders are closing up their positions. This may be due to mass liquidations or because of investors opting to take less risk right now.

A mass liquidation event (often called a long or short squeeze) occurs when the price of Bitcoin makes a sharp swing, leading to a cascade of liquidations in the market.

Now, here is a chart that shows the trend in the indicator over the past week:

Looks like the ratio has been at high values recently | Source: CryptoQuant

As you can see in the above graph, while the price of the coin has gone down, the leverage ratio has remained at high values.

Related Reading | Bitcoin Prices Dragged Down By Geopolitical Tensions, Ukraine Nuke Plant Fire

The open interest has also declined slightly, which means there are fewer positions open currently. This implies that the average leverage per position has actually gone up.

The quant in the post believes that this trend may show that Bitcoin investors are now getting bolder and taking more risks.

Since the funding rate is about neutral right now (another indicator that can help us estimate the ratio between longs and shorts), it implies there are about as many long positions as short positions.

Related Reading | Bitcoin Bearish Signal: Exchanges Observe Huge Inflow From Long-Term Holders

The price action in the near future may be of interest as a sharp move in either direction can cause a squeeze and push the value of Bitcoin further in that direction.

BTC Price

At the time of writing, Bitcoin’s price floats around $41.4k, up 5% in the last week.

BTC’s price seems to have plunged down over the past day | Source: BTCUSD on TradingView
Featured image from Unsplash.com, charts from TradingView.com, CryptoQuant.com

December Turns Red For Bitcoin As Market-Wide Sell-Offs Continue

December has turned out to be a red month for bitcoin and other indexes as sell-offs have rocked the crypto space. Bitcoin and altcoins alike have recorded numerous losses tied to investors selling off their holdings and hunkering down for what looks to be the beginning of a drawn-out bear market. Some have however suffered more than others in a more that has turned bloody for investors.

All across the market, indexes continue to record double-digit drops, signaling no improvement from the previous week as losses had also risen to the double digits. Losses have run even higher for the past seven days with the small cap index taking the biggest hit of all.

Related Reading | Despite Crackdown, Bitcoin Mining Is Still Alive And Well In China

Double-Digit Losses Rocks The Market

Bitcoin has suffered significant losses since the crash at the beginning of the month. The digital asset was pushed towards the low $40,000s and has struggled to move out of this price range since then. On the index front, the asset has not done too well either as it has recorded losses up into the double-digits and much higher than that recorded for the previous week.

Bitcoin alone saw a 20% loss for a seven-day period, up 5% from the previous week’s loss of 15%. This has made it one of the hardest-hit digital assets in the space despite maintaining the largest market share.

BTC drops 20% in seven days | Source: Arcane Research

The other indexes were not left out of the onslaught, all continuing the trend of double-digit losses. For a seven-day period, the Mid Cap Index held up best out of all the indexes but not by a wide margin. The Large Cap Index mirrored bitcoin’s losses with a 20% loss for the week.

The Small Cap Index saw the most losses for the week with a 28% loss, marking the worst performance of all the indexes for the month of December.

Bitcoin Market Dominance Drops

Bitcoin has maintained the largest share of the cryptocurrency market. However, this number has continued to drop as months go by. Five years ago, bitcoin had controlled about 90% of the total market share. Today, it has dropped to less than 50% of the market share it used to command, evidenced in the market dominance of the digital asset.

BTC begins another recovery trend | Source: BTCUSD on TradingView.com

Some of the biggest coins by market cap have outperformed bitcoin for the last week. This outperformance has translated to an encroachment on the market dominance of bitcoin. Once again, BTC’s market dominance has dropped close to 40%, a crucial point that altcoins have not been able to break.

Related Reading | Bitcoin Leads As Markets Sees Record Outflows. Bear Market Incoming?

Nevertheless, altcoins have enjoyed significant growth in the way of market dominance given that at the start of the year, bitcoin’s market dominance was as high as 73%. With the year drawing to a close, altcoins have managed to steal over 30% dominance from BTC, and 2022 may be the year that it finally breaks below the 40% resistance point.

Featured image from CNBC, charts from Arcane Research and TradingView.com