Top Analyst Predicts Bitcoin To Reach $150,000 In 2025 – Here’s Why

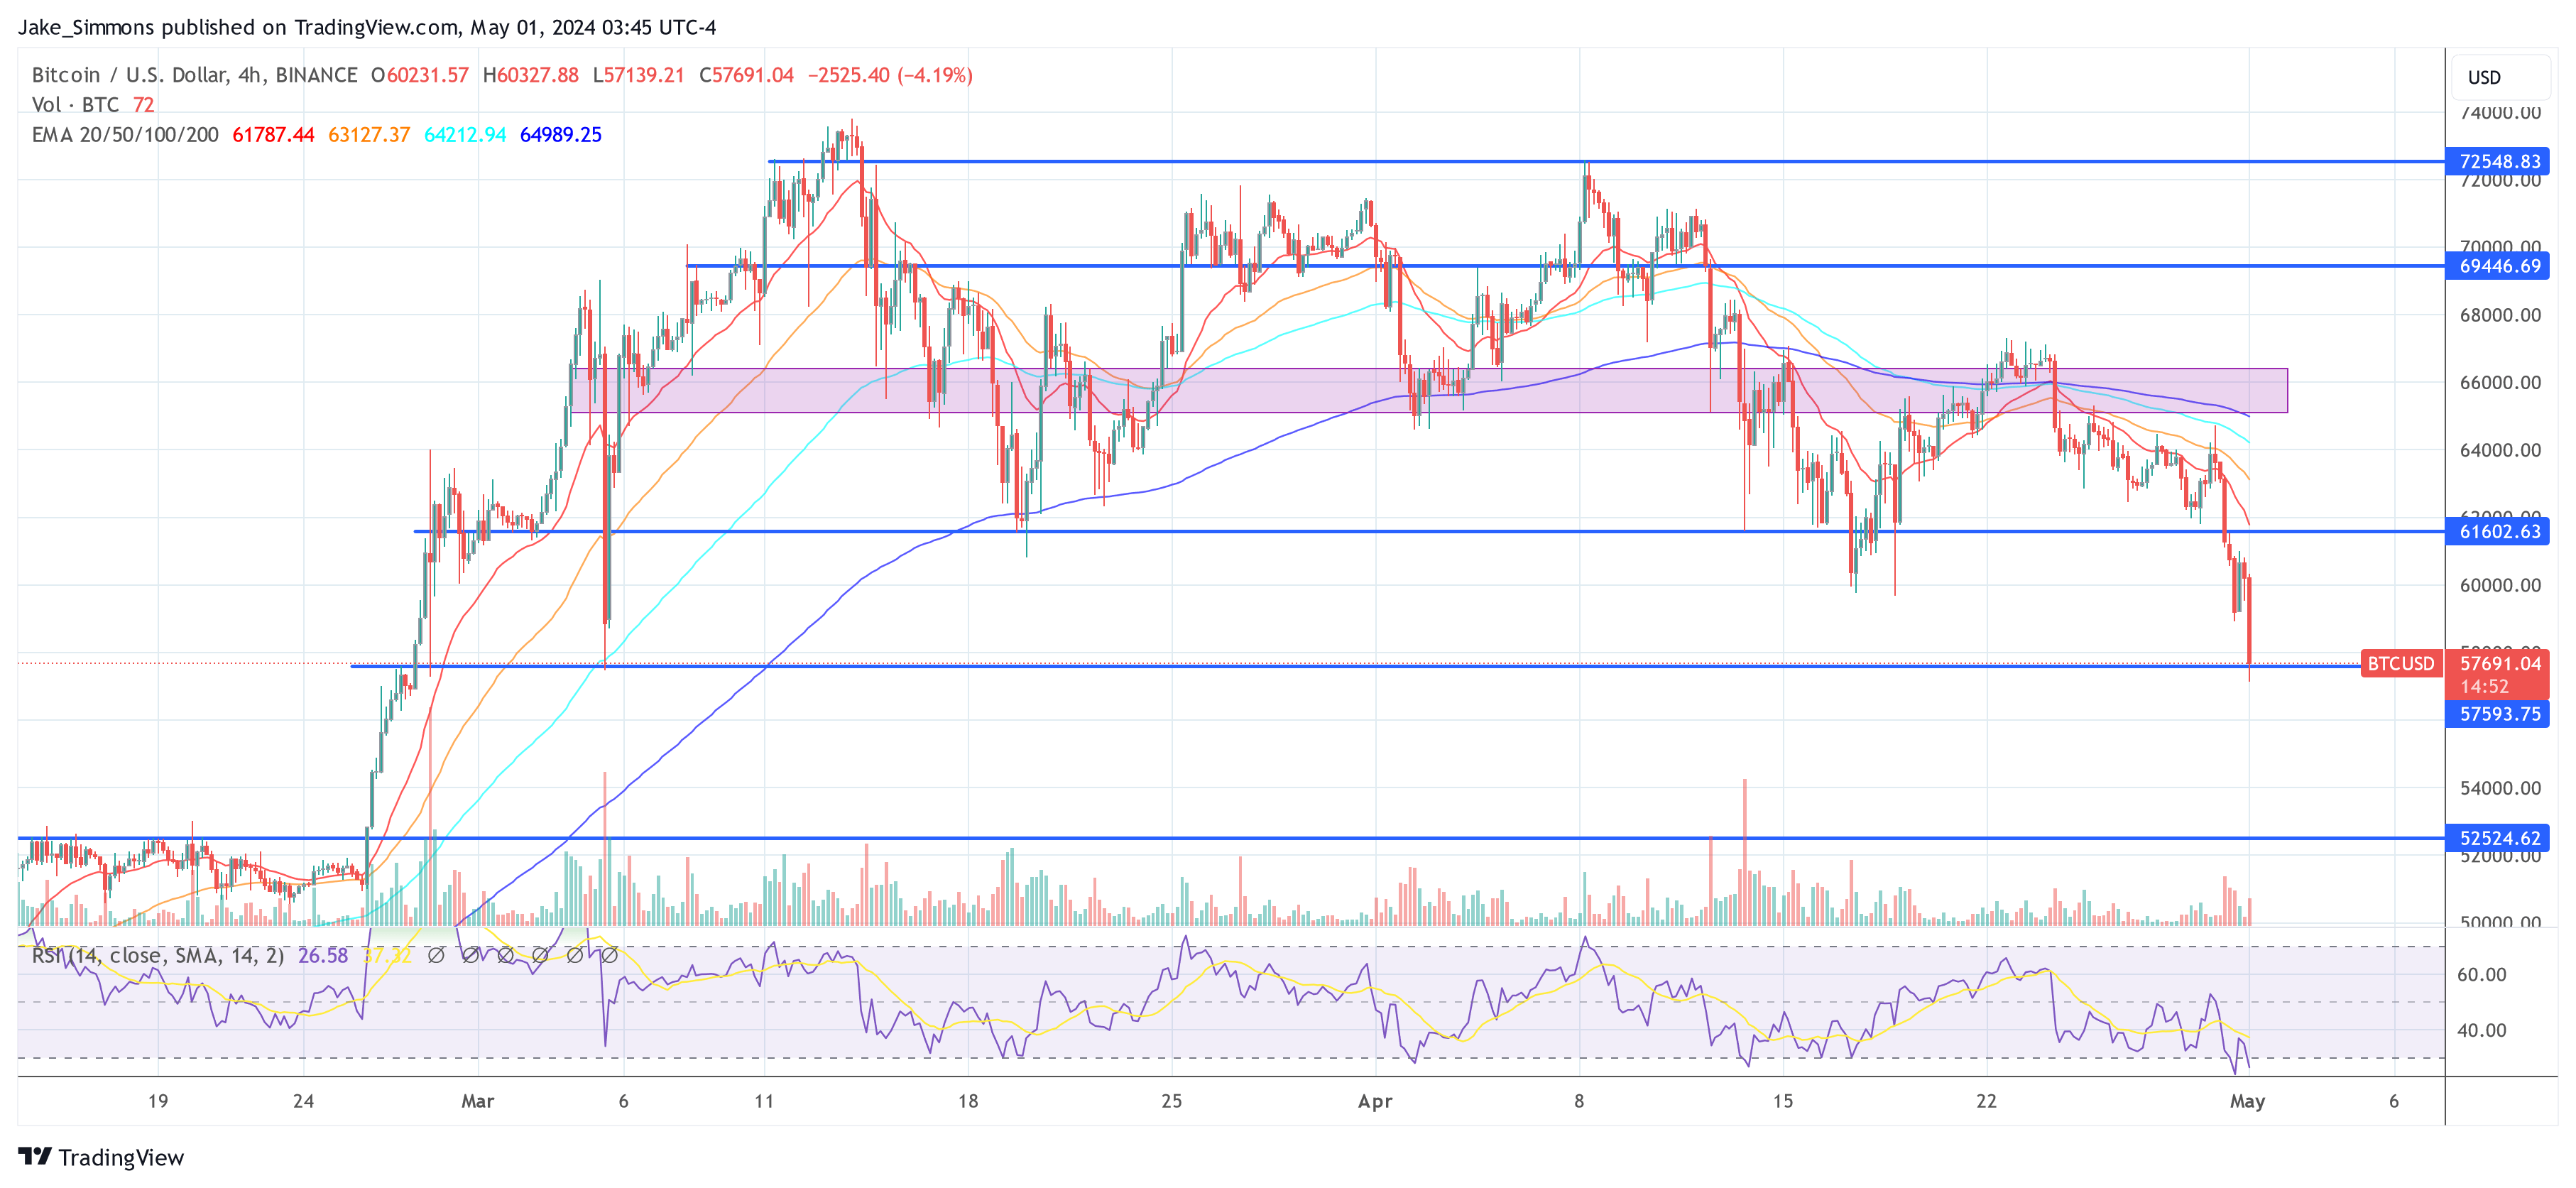
In the last week, Bitcoin has shown much resilience bouncing back above the $60,000 zone after a significant decline to below the $57,000 price zone. As Bitcoin bulls gather momentum to possibly initiate the crypto bull run, top analyst and market expert Peter Brandt has backed BTC to attain a particular six-figure digit value by 2025.

No Other Market Like Bitcoin, Brandt Says

In a blog post on May 3, Peter Brandt shared some insights on Bitcoin in celebration of his 50th anniversary in future markets trading. The veteran analyst described his experience with the maiden cryptocurrency as a “once-in-a-lifetime trade, never to be equaled”.

Brandt states that Bitcoin is a unique asset in comparison to commodities such as gold, cattle, iron ore, copper,  and even other cryptocurrencies such as altcoins and meme coins. He claims that BTC owes this uniqueness to its operational nature as well as its price behavior.

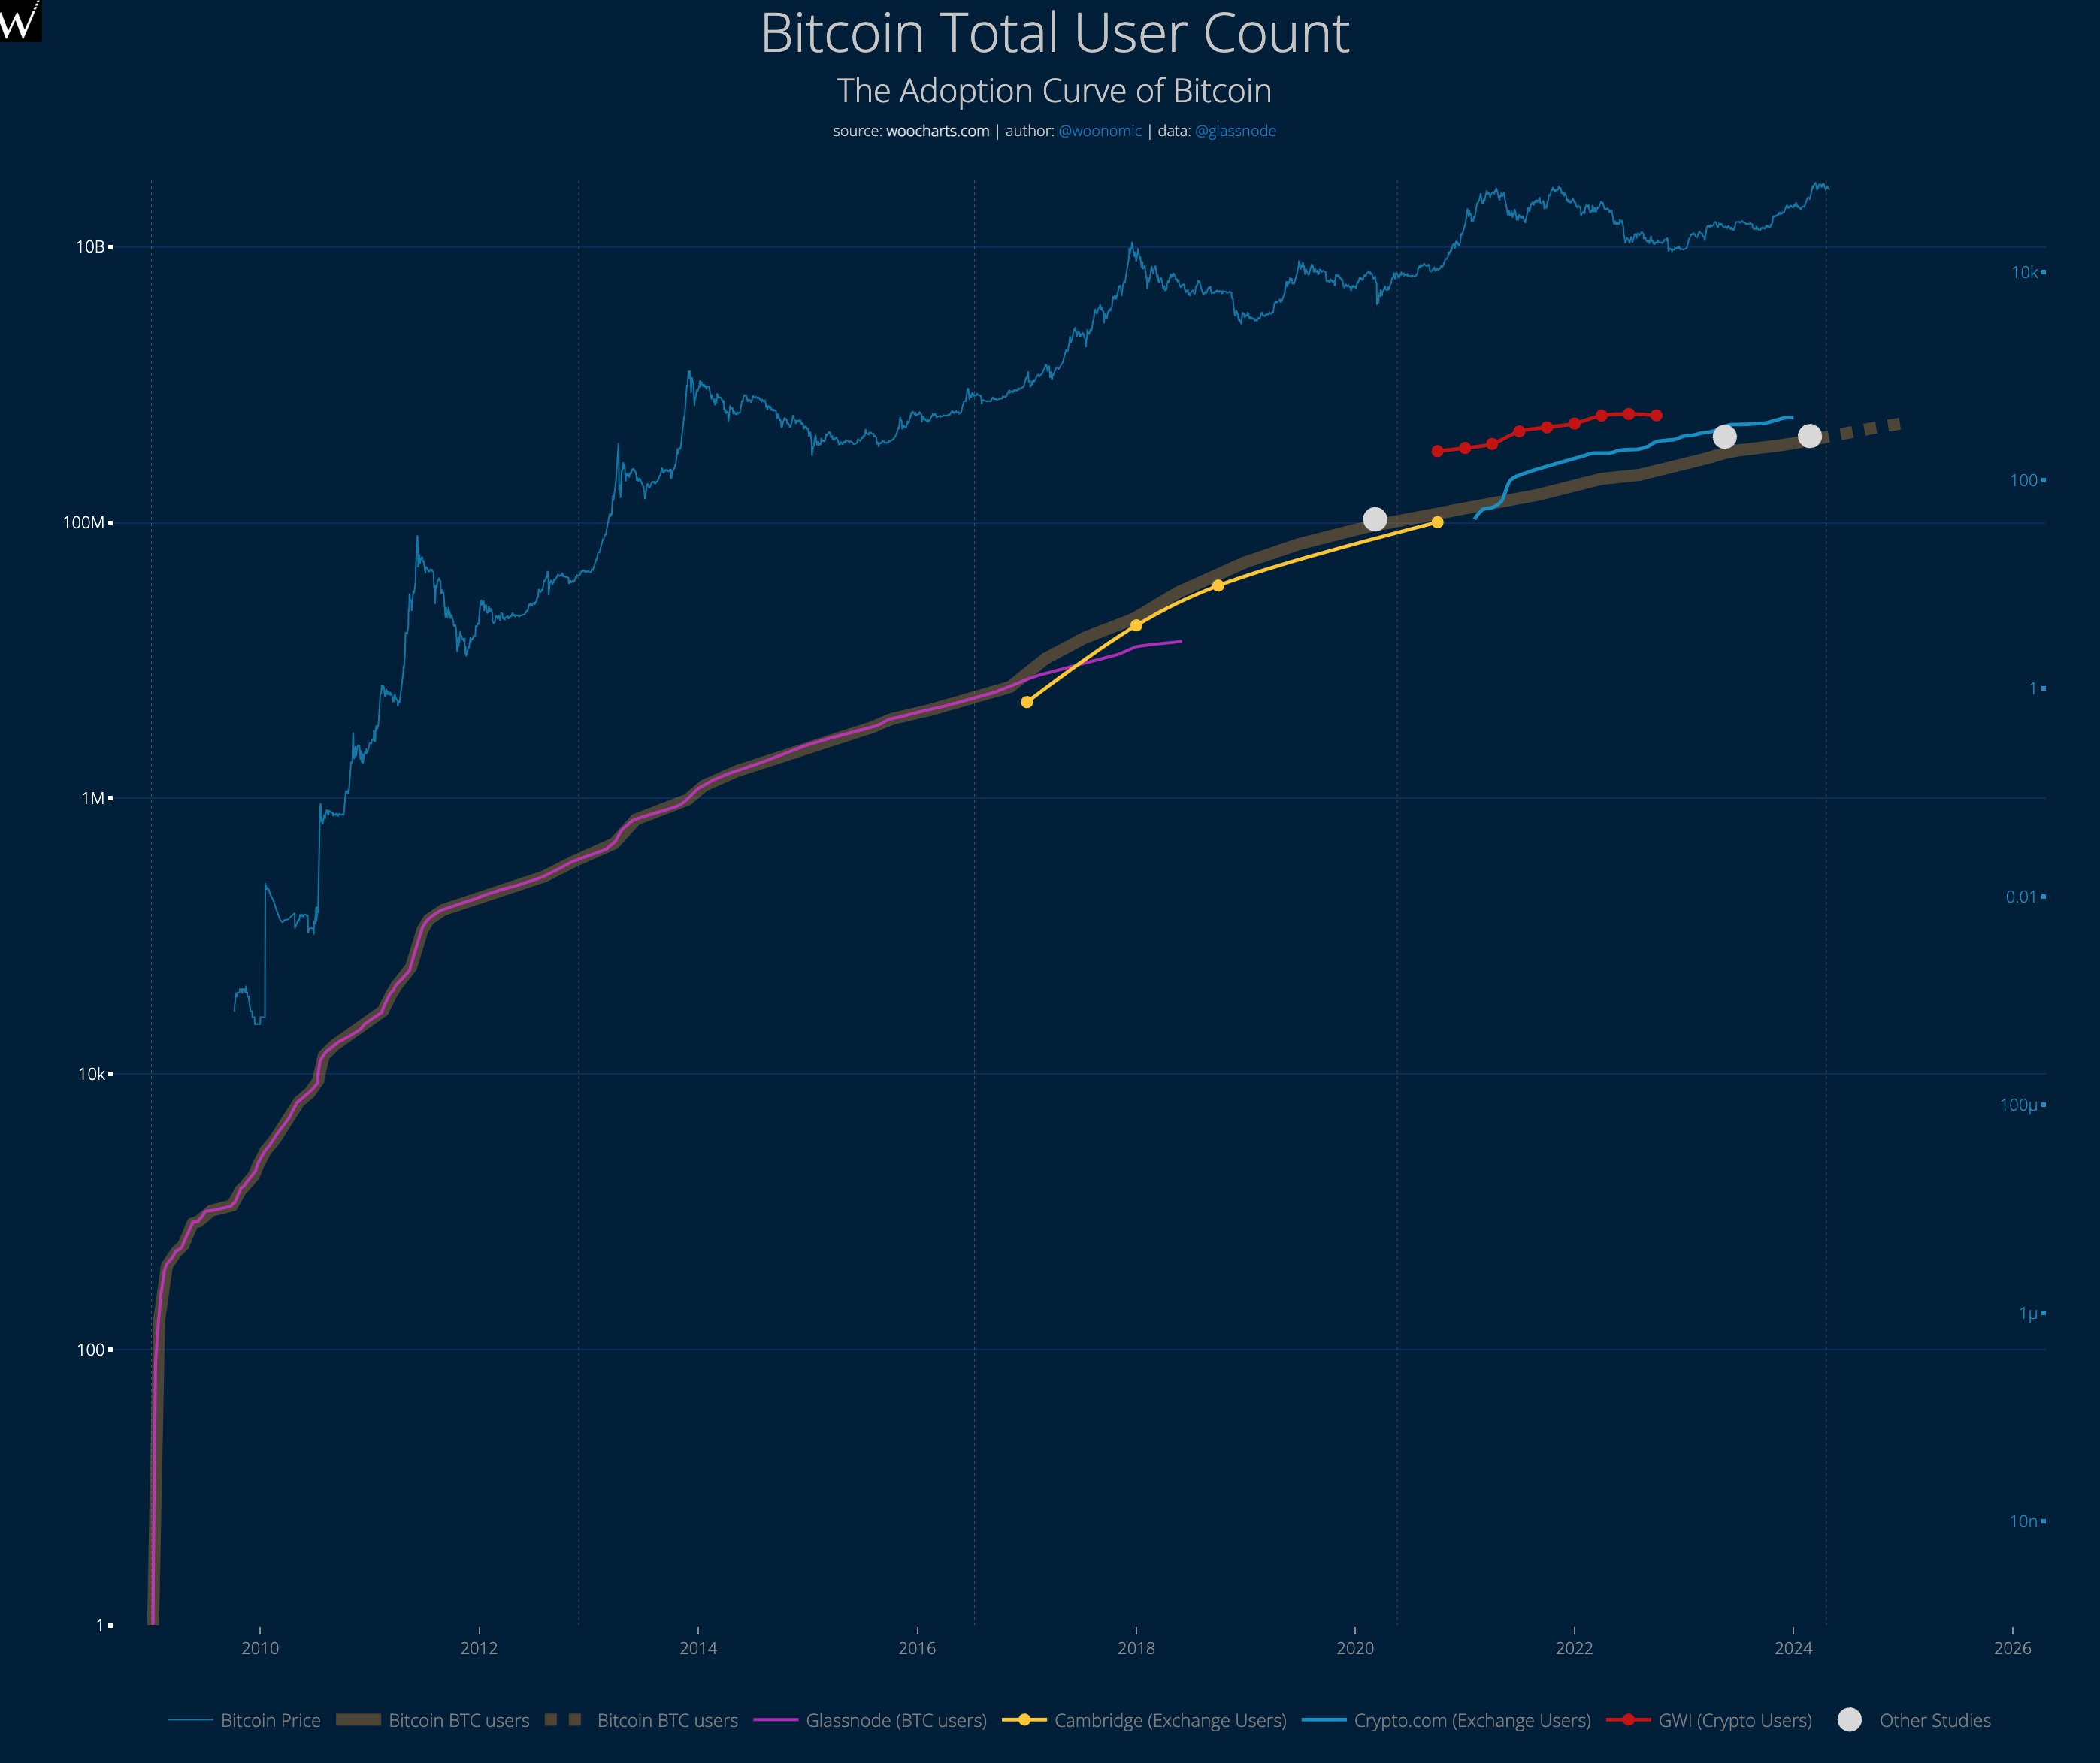
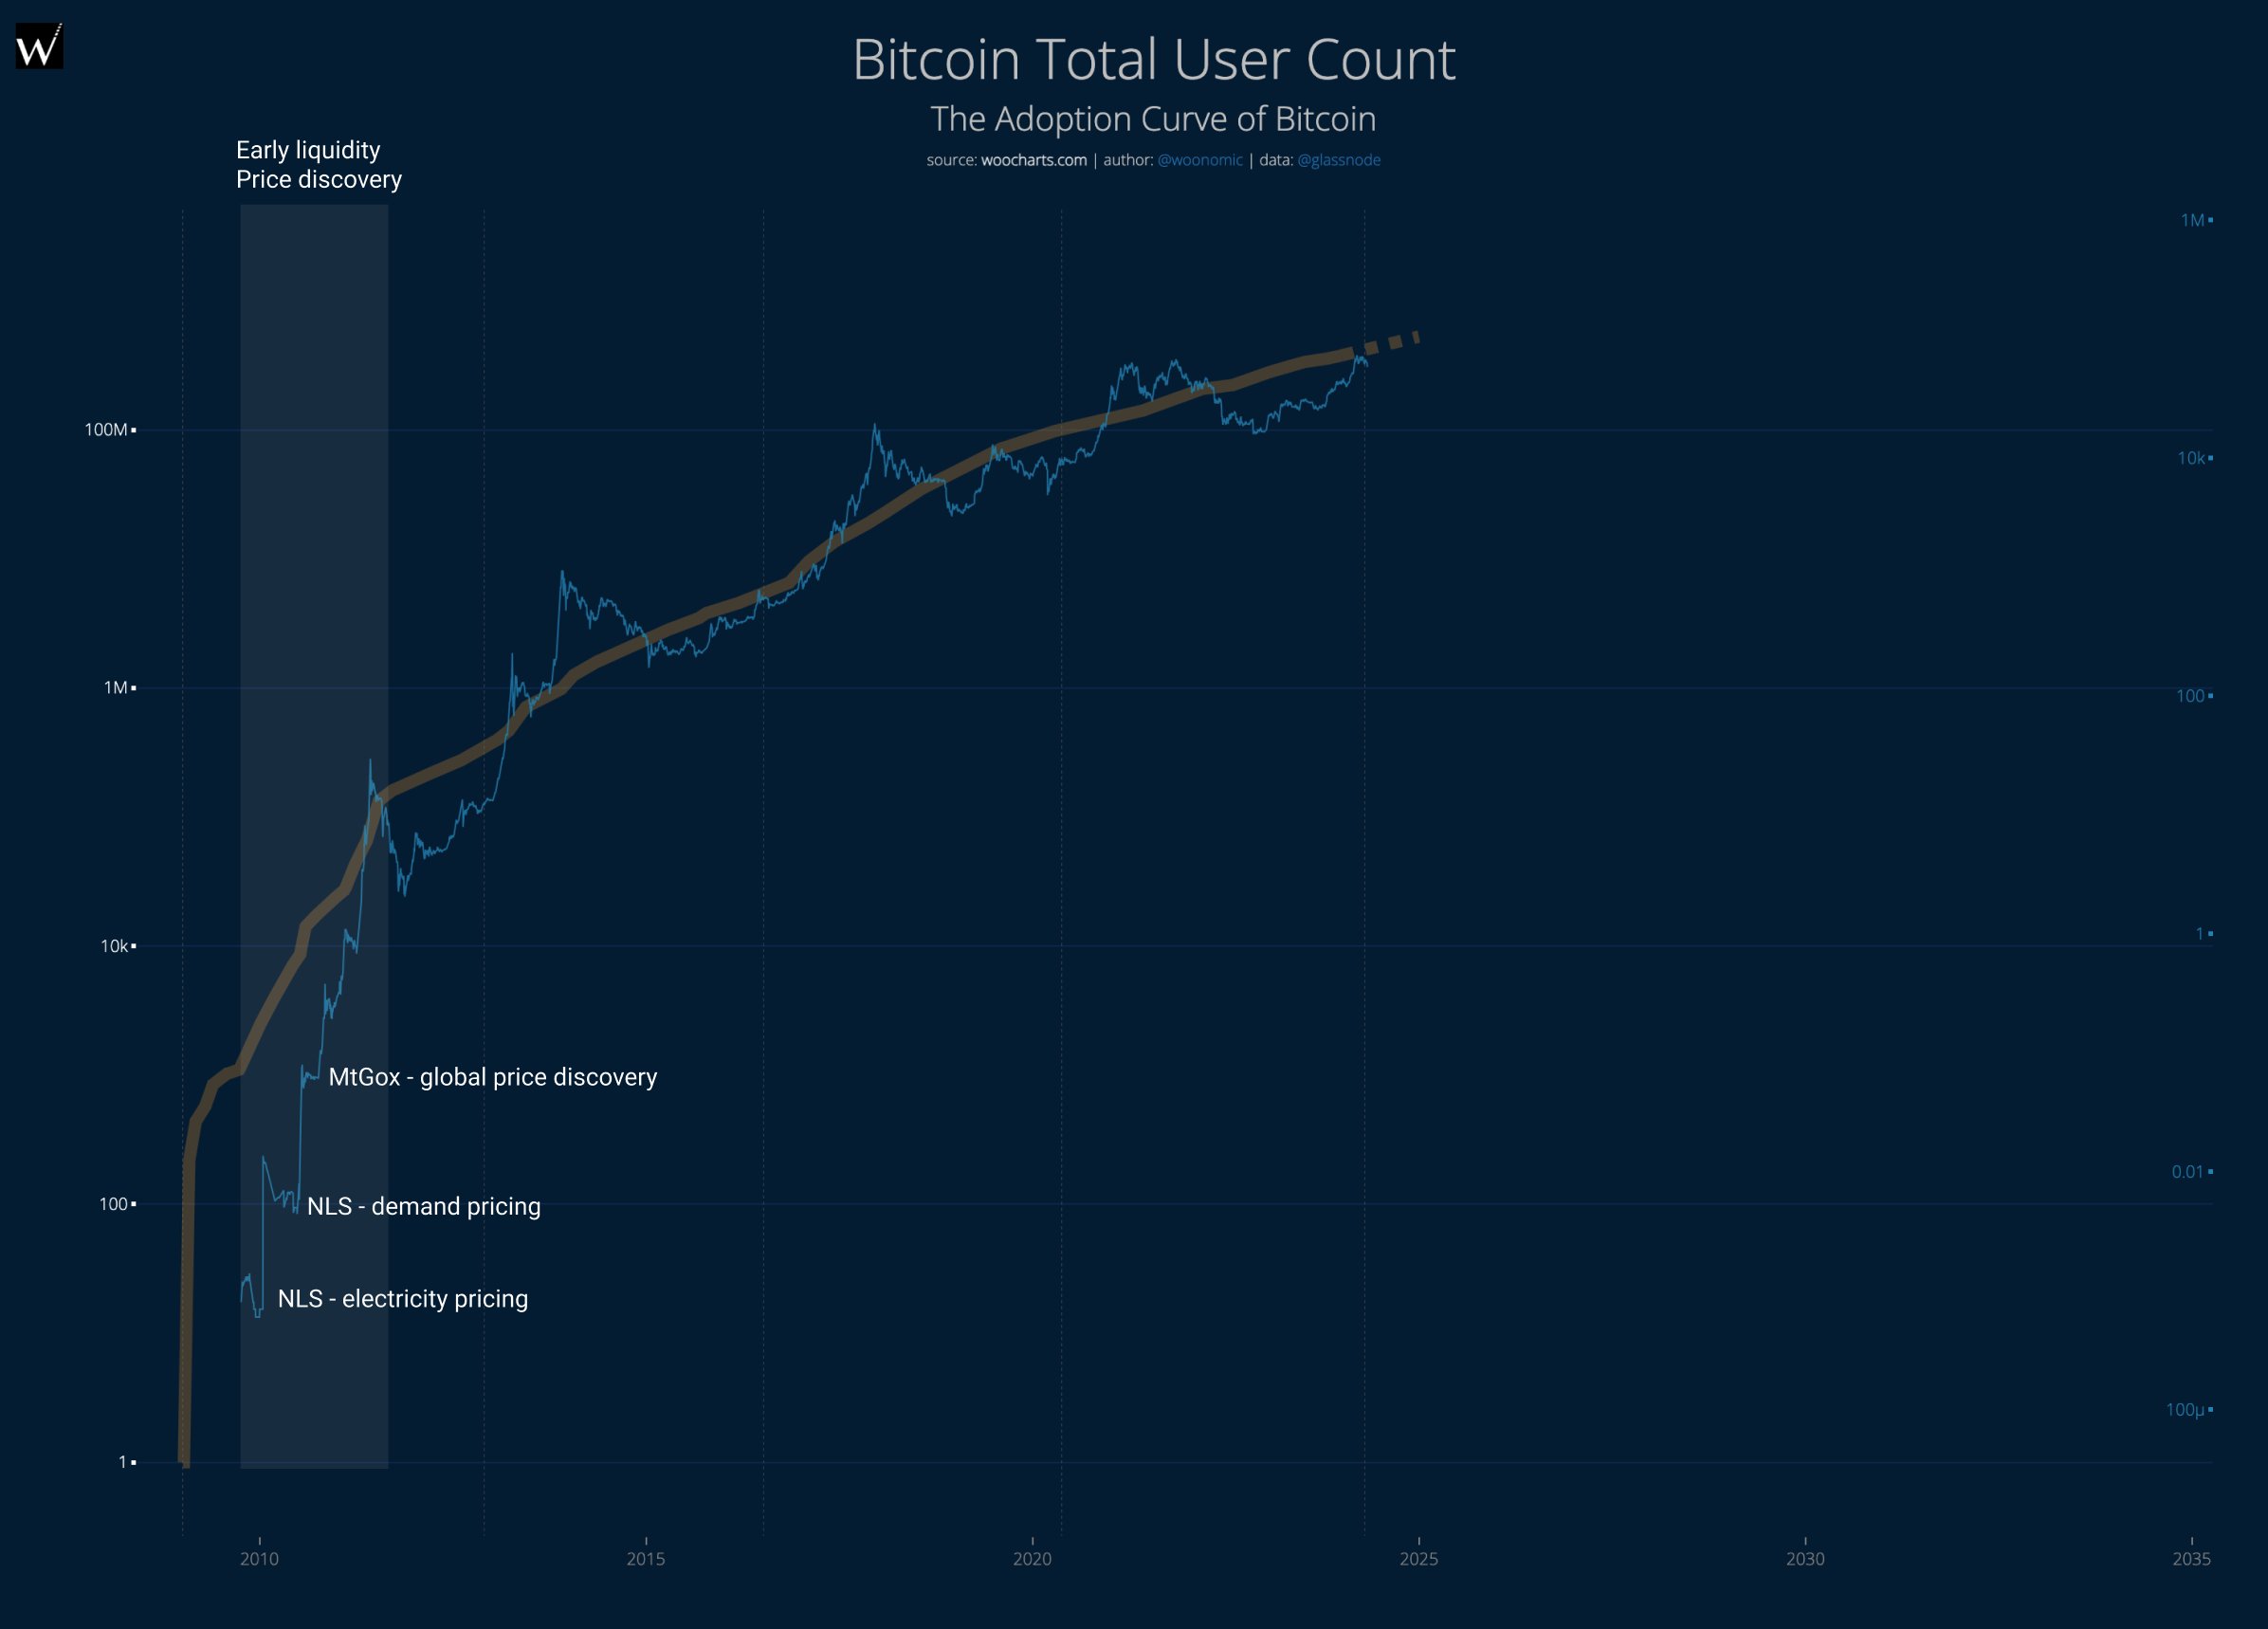
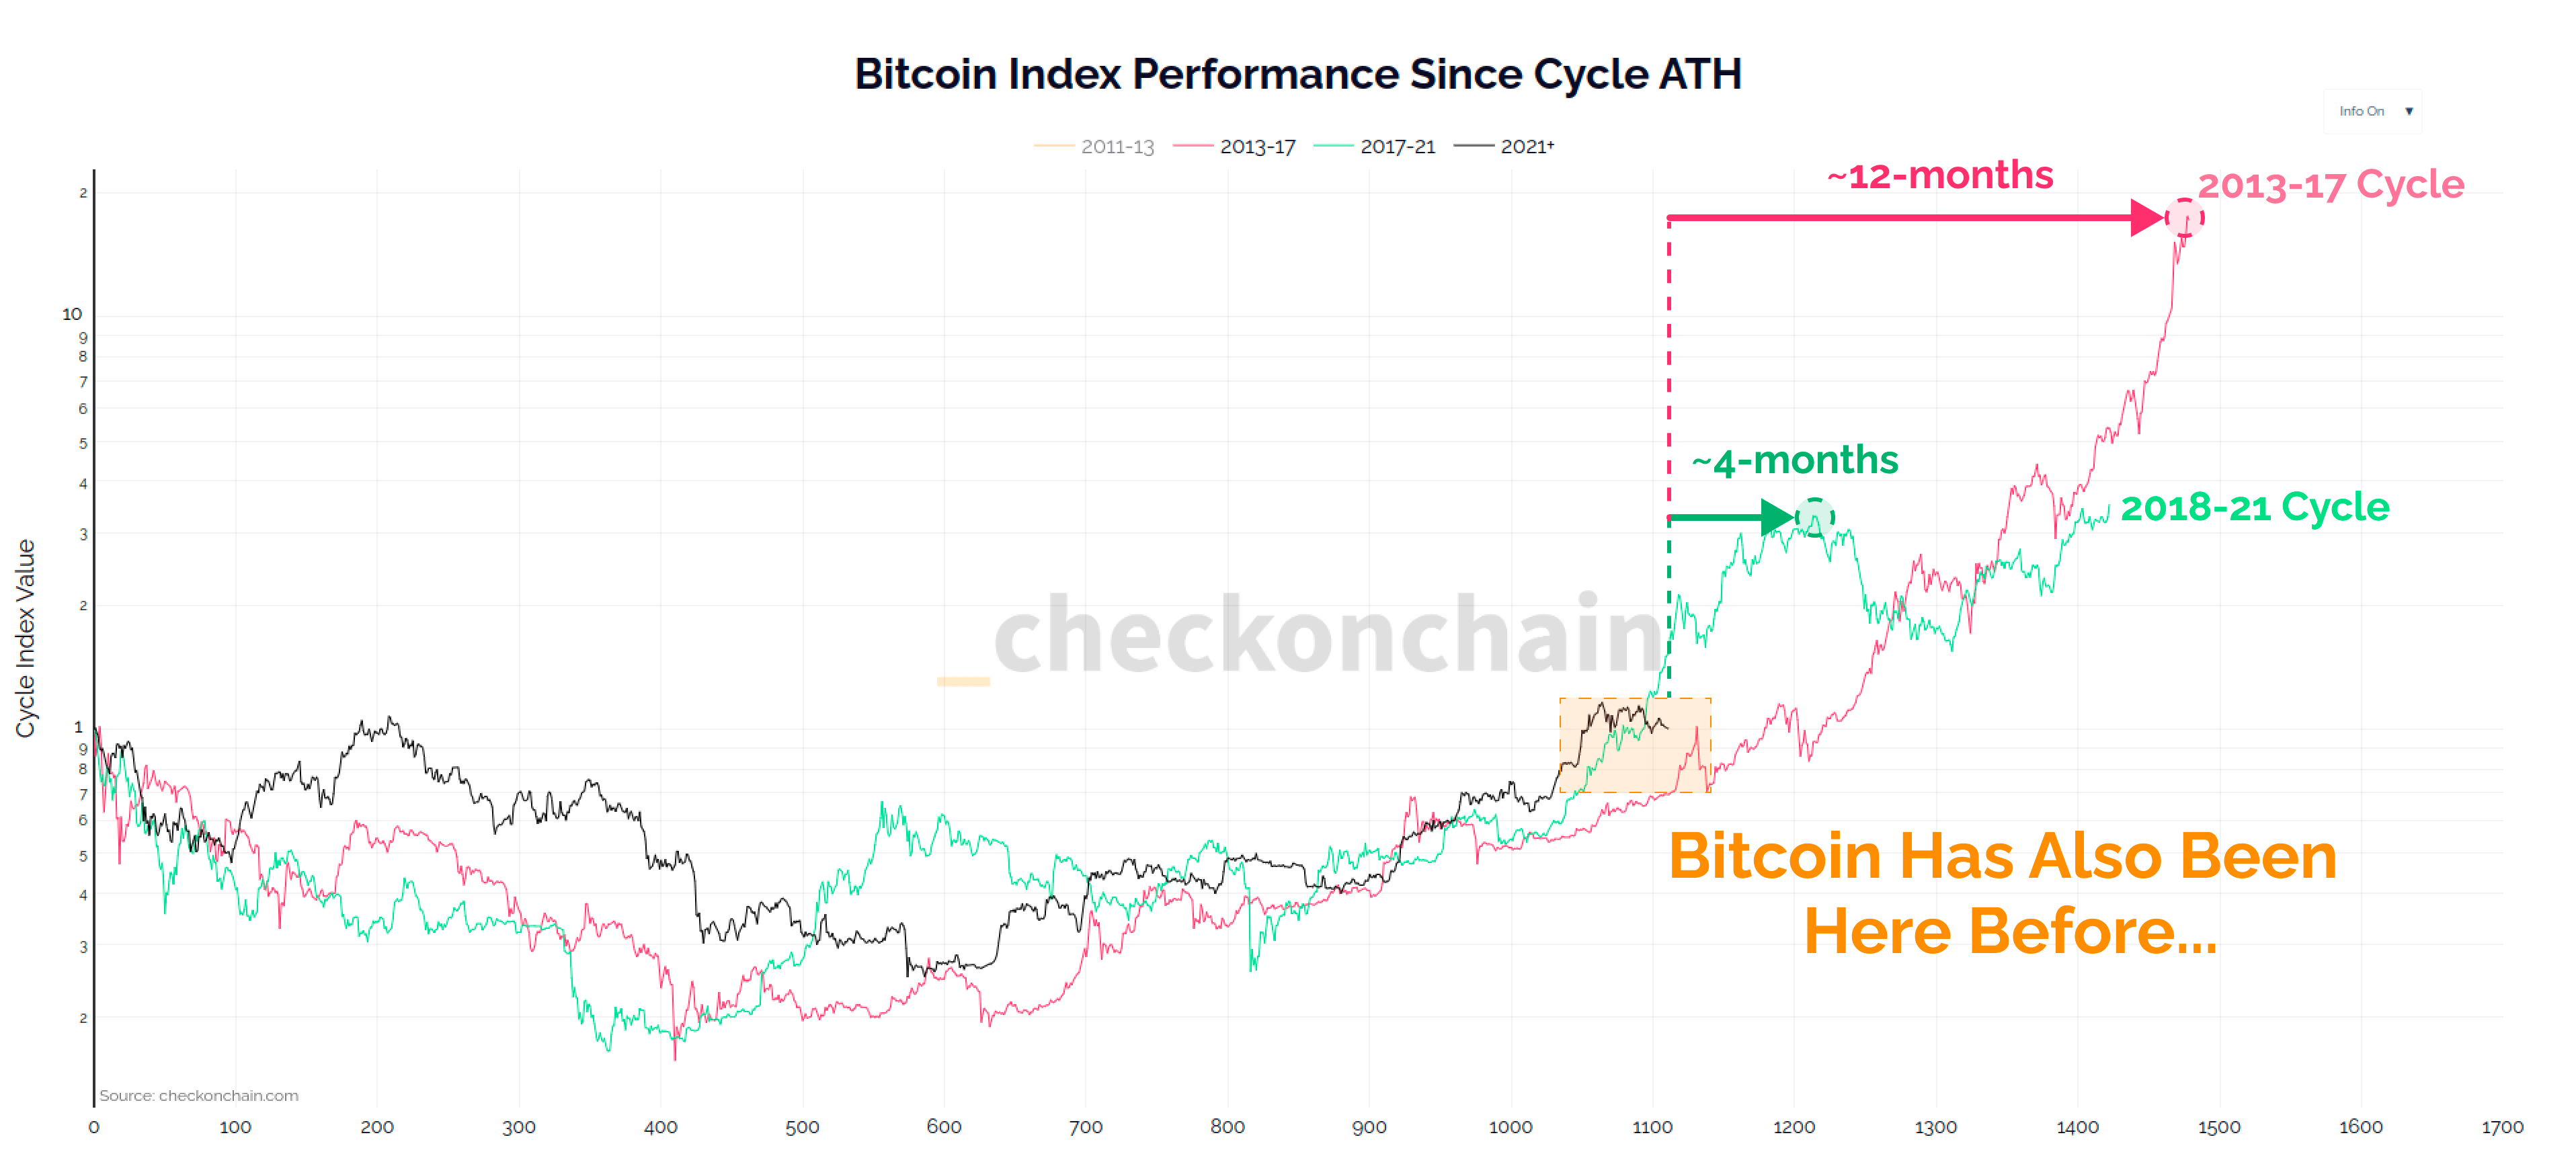
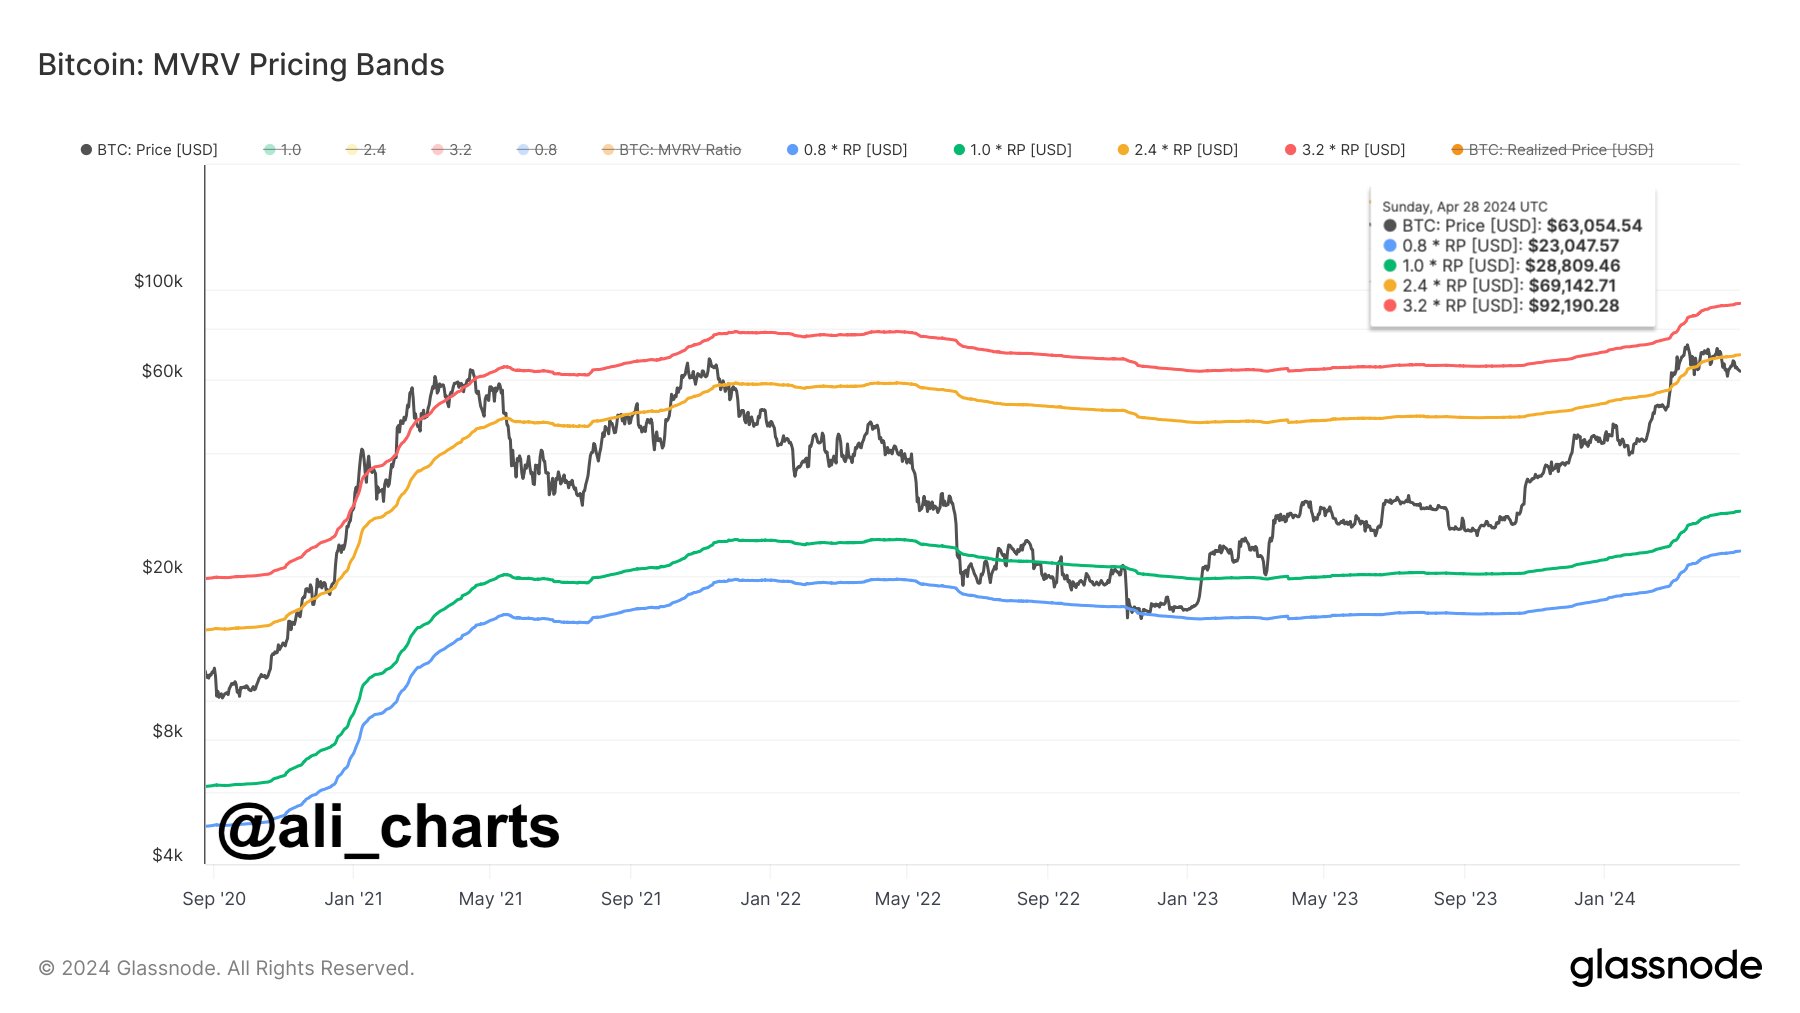
Analyzing BTC price history, Brandt notes that the coin has repeatedly produced exponential gains in the past not seen with any other trading asset. And while these gains are followed by significant corrections, the overall price performance sets BTC apart from other assets. 

Another aspect of Bitcoin’s uniqueness as highlighted by Brandt is that the asset’s volatility is also evident in its downturns resulting in a decline of more than 50% and even 75%. Therefore, Bitcoin exerts a special ability to generate substantial profits while also causing significant losses.

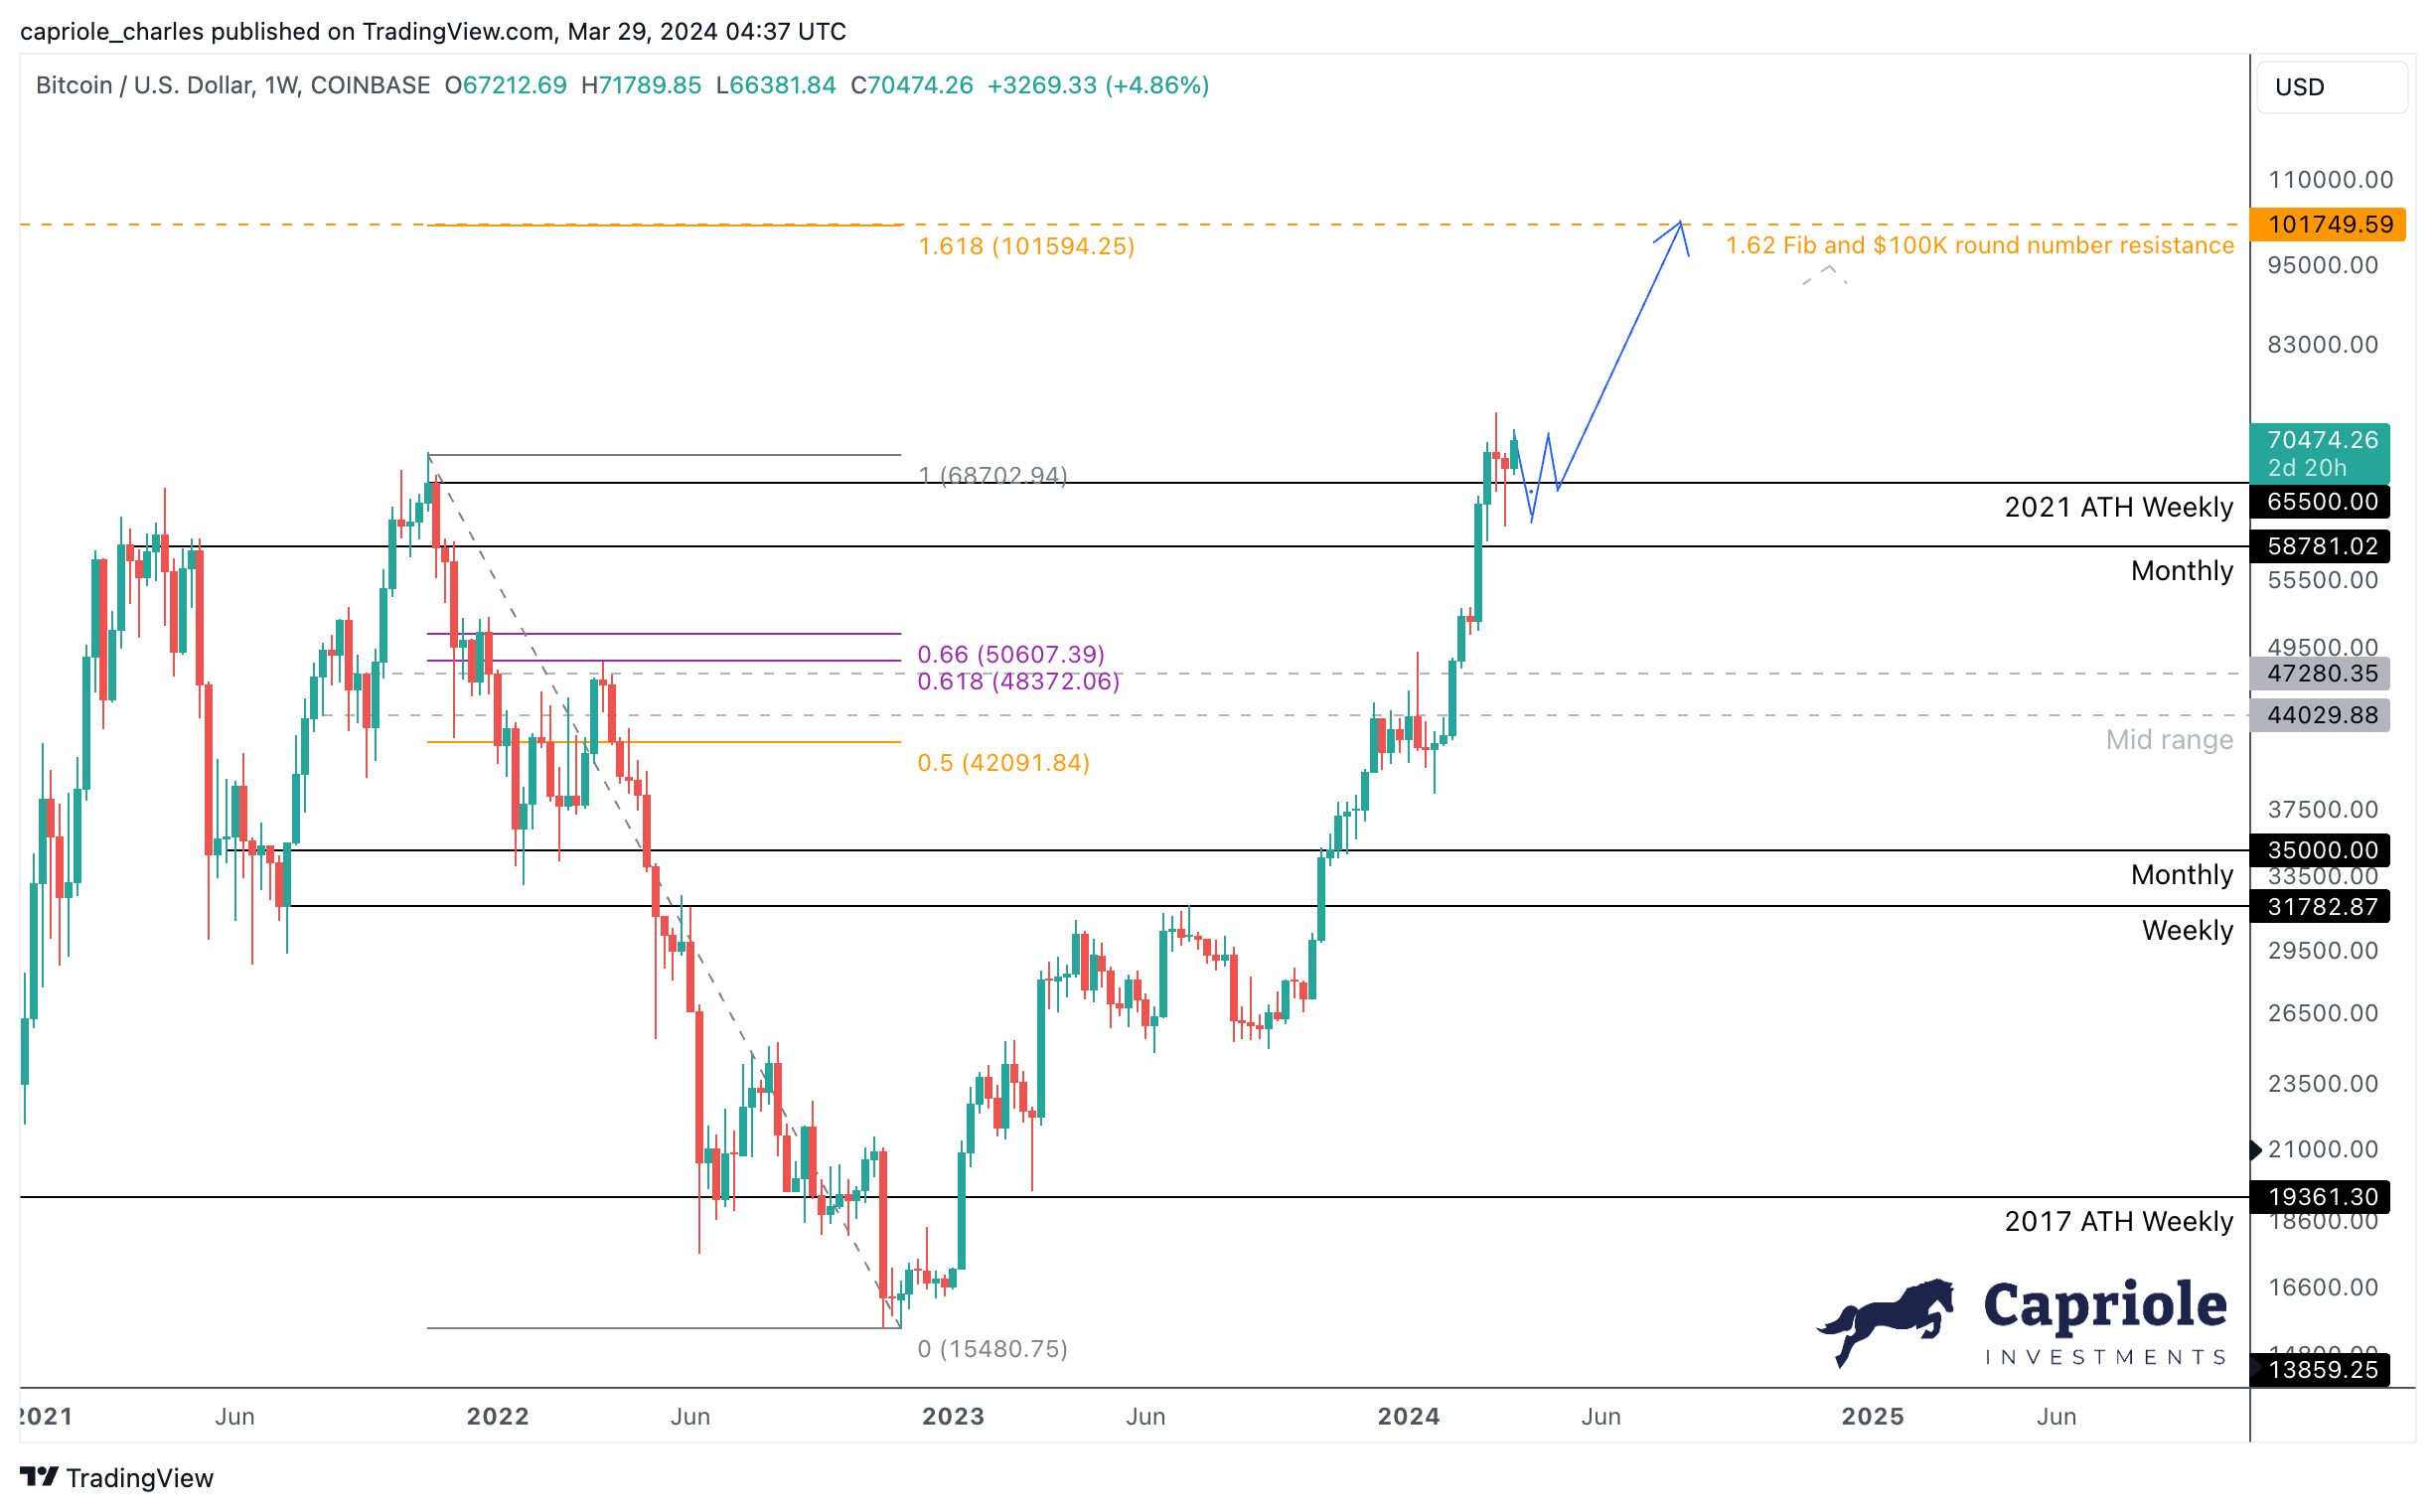
Now, following BTC’s parabolic price nature, Brandt predicts the asset is on course to reach $150,000 by 2025. Interestingly, if the bulls maintain market control, the analyst believes Bitcoin could rise as high as $300,000 beyond 2026.

BTC Price Overview

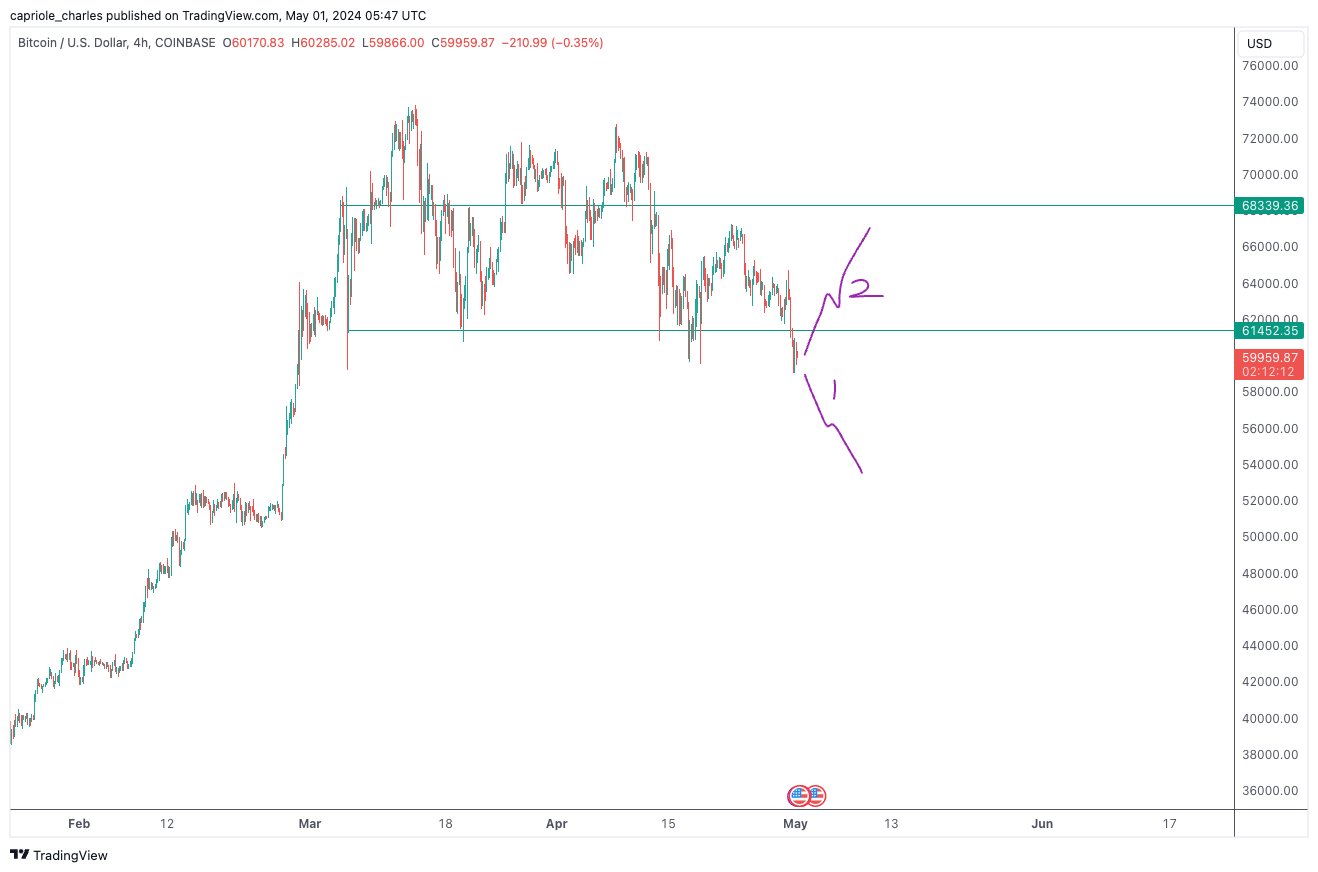
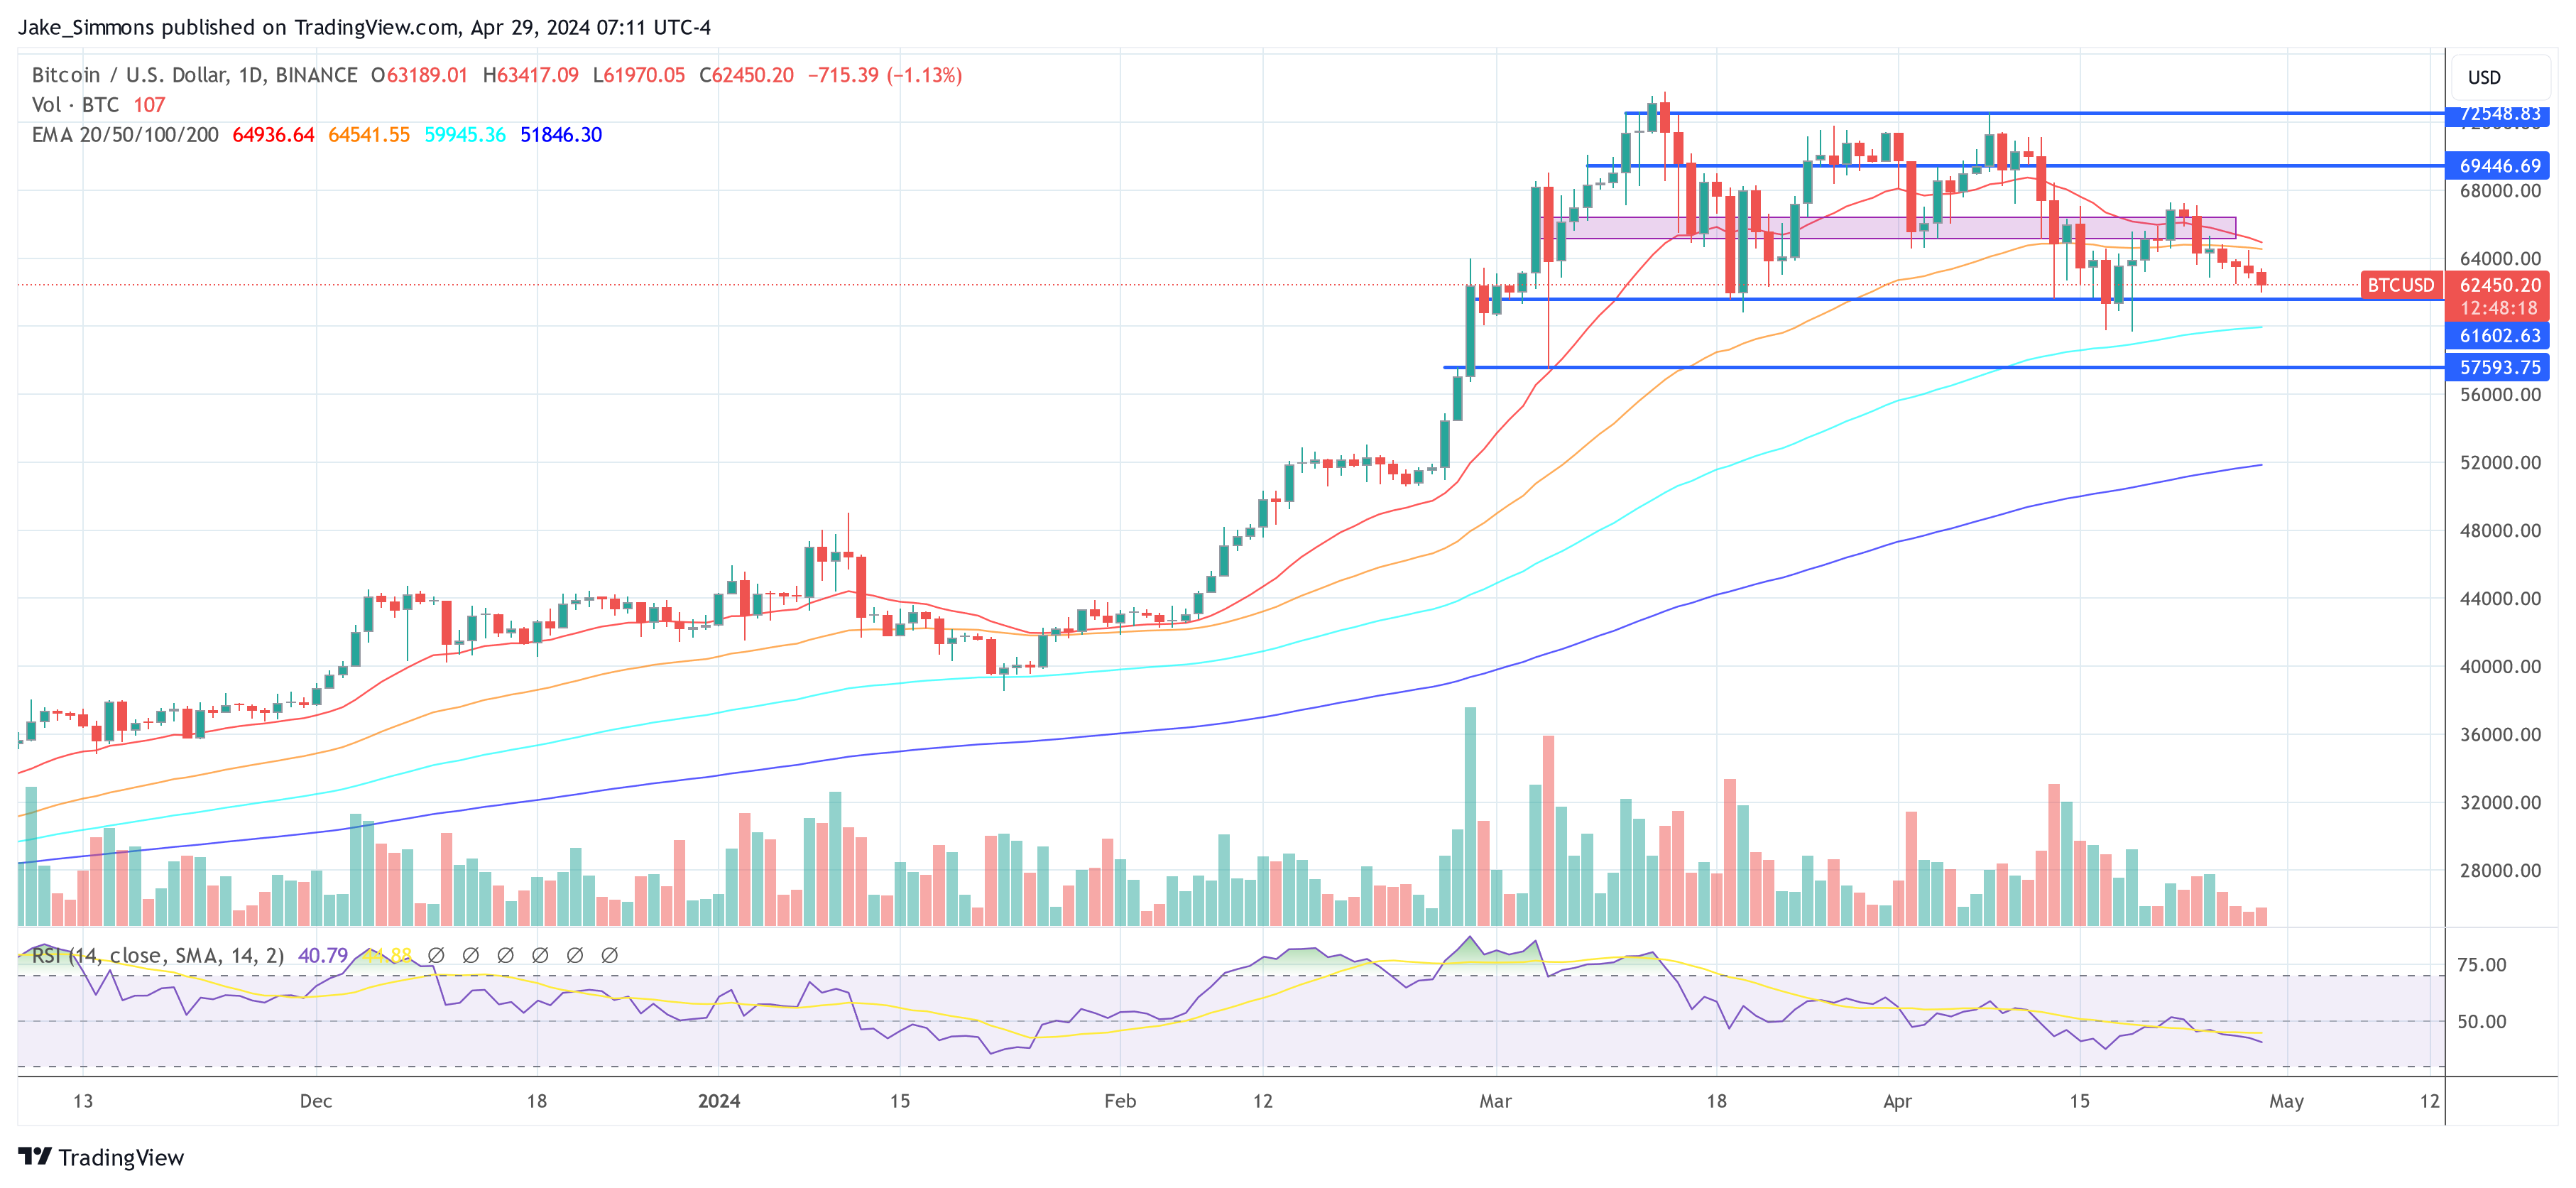
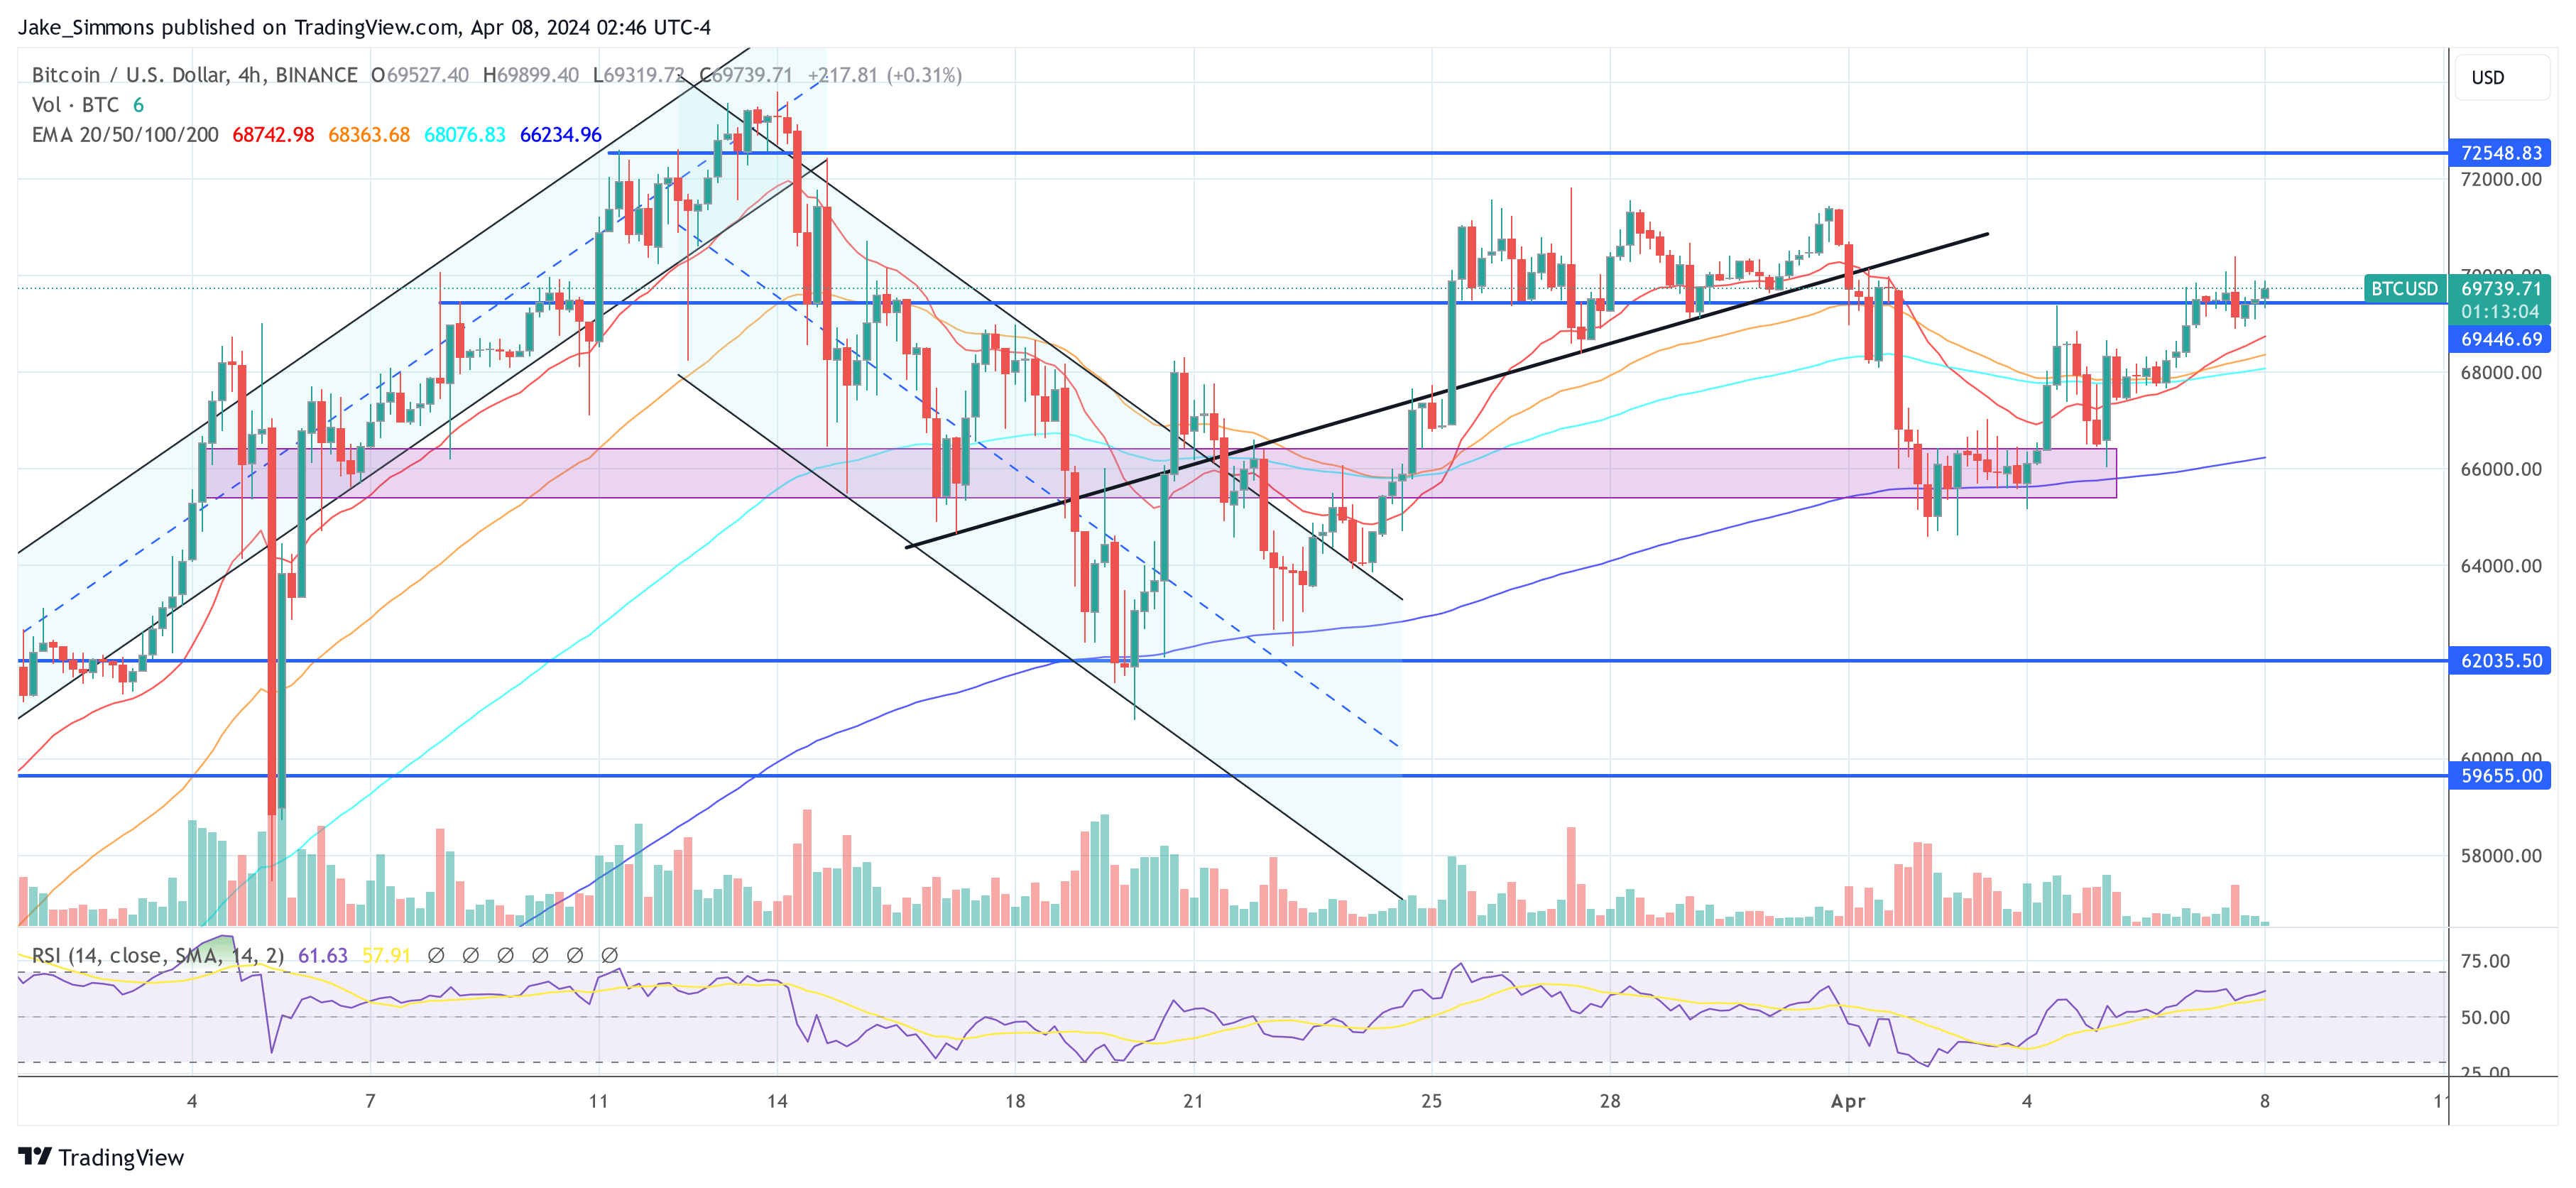
At the time of writing, Bitcoin trades at $63,303 having encountered serious resistance in the $64,000 price zone. The maiden cryptocurrency currently looks to be in consolidation and could be preparing for another possible breakout. 

If Bitcoin embarks on a bull run, investors would be hoping for a return to its all-time high value of $73,750. However, in the advent of more selling pressure in the future, BTC could drop below $60,000 again. Nevertheless, Bitcoin remains the diamond of the crypto bull season with several analysts hyping the digital asset to trade above $100,000 within the next 12 to 15 months. 

Bitcoin
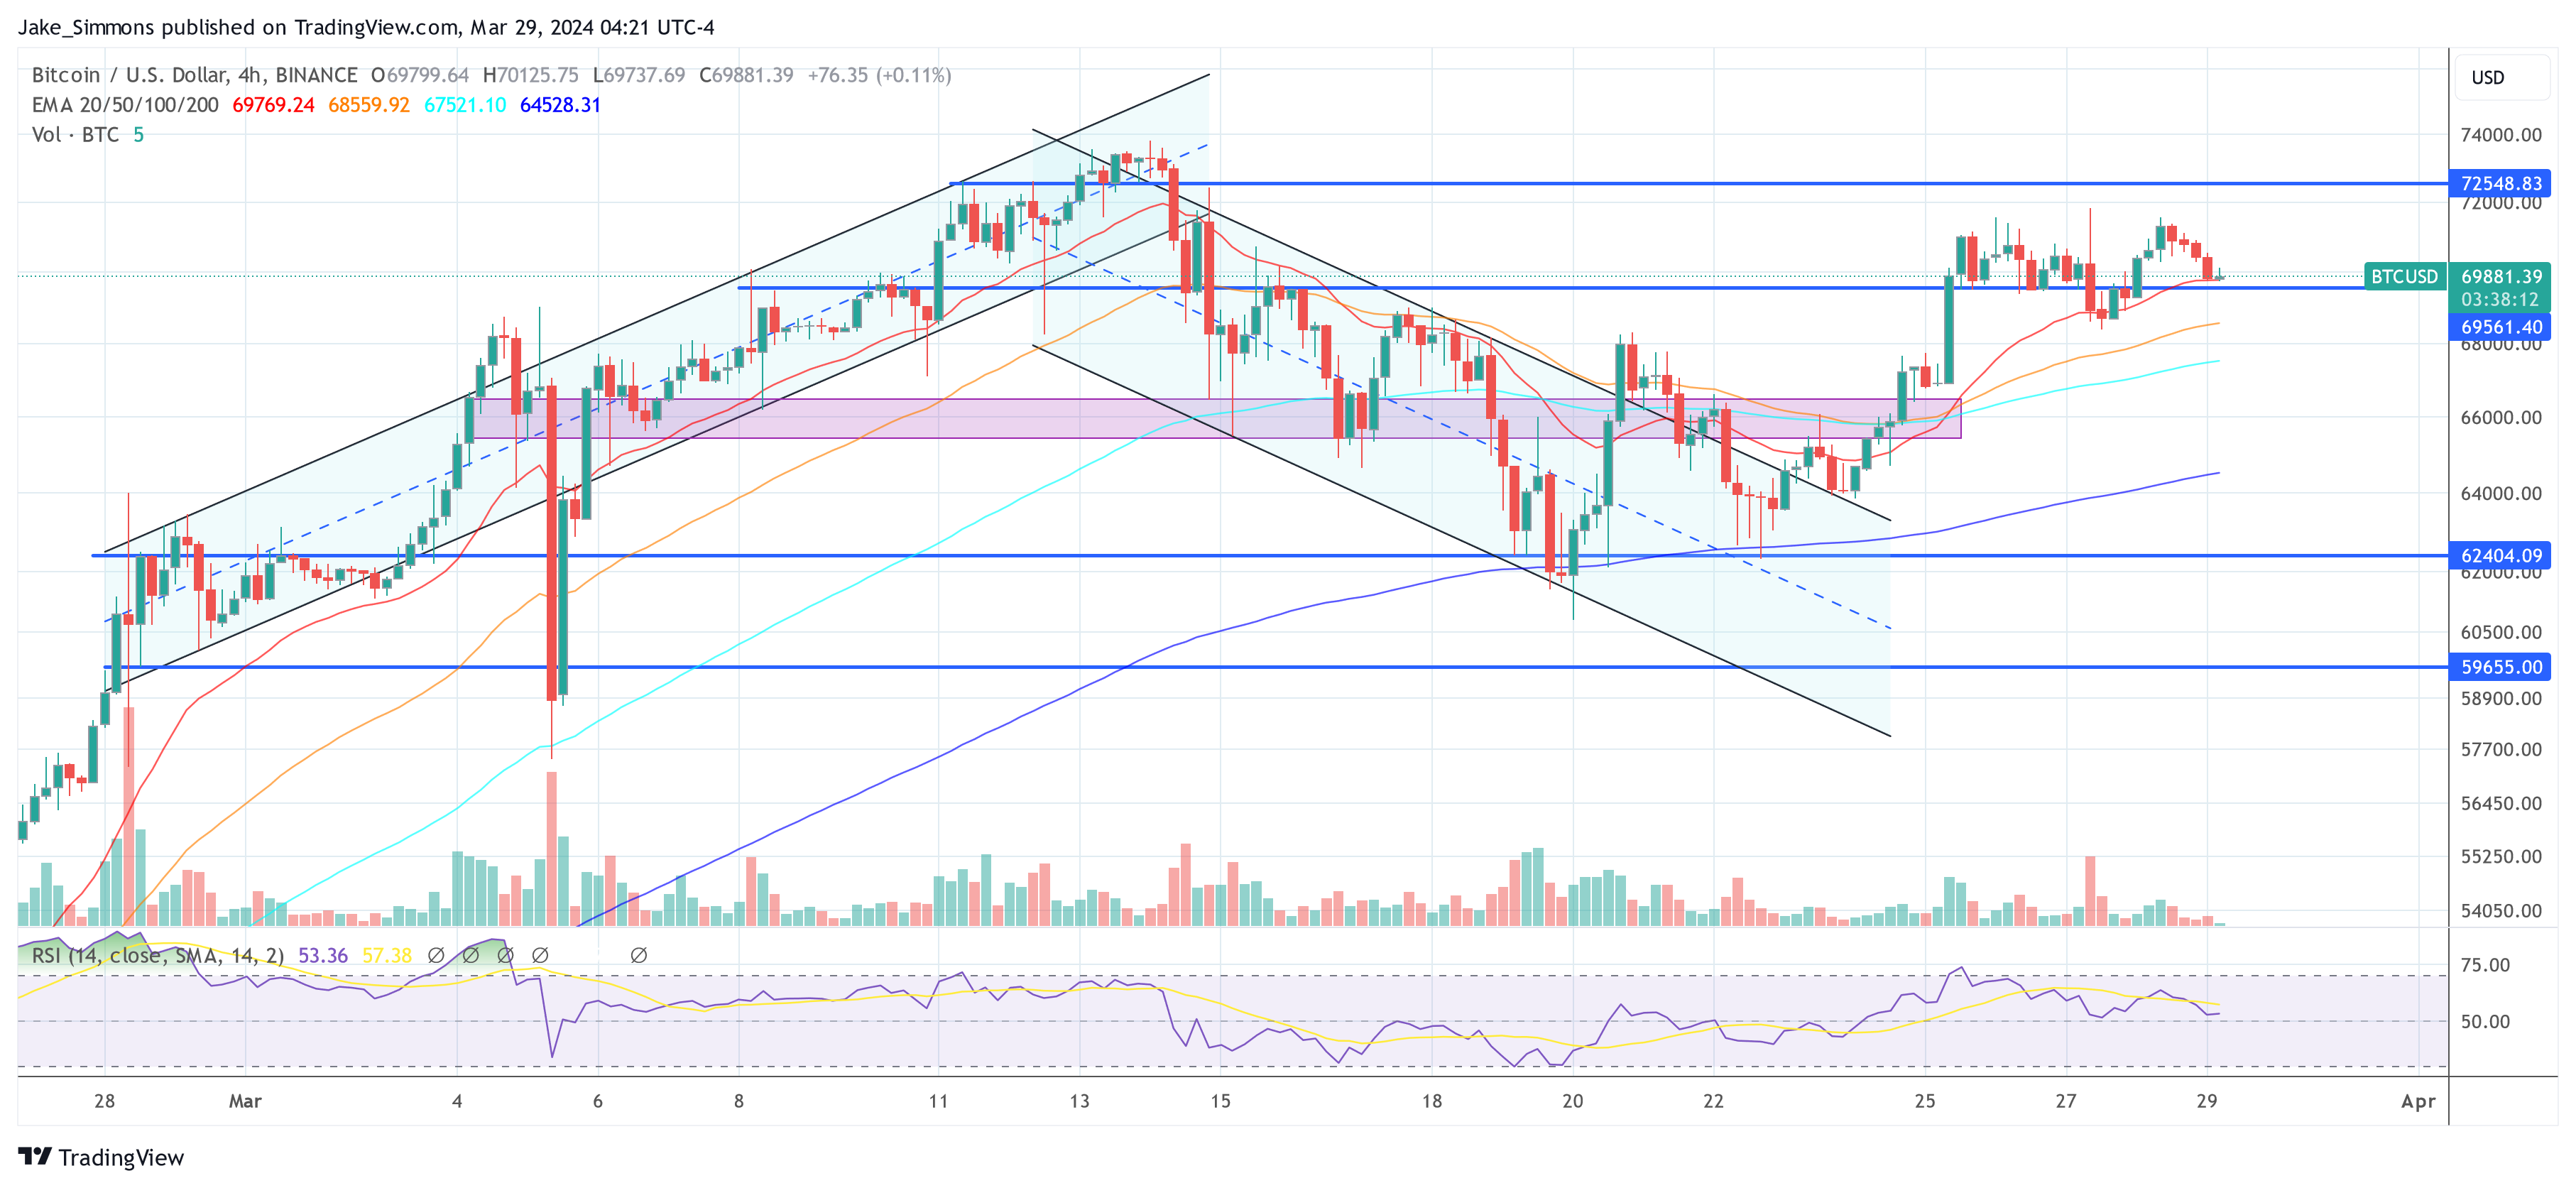
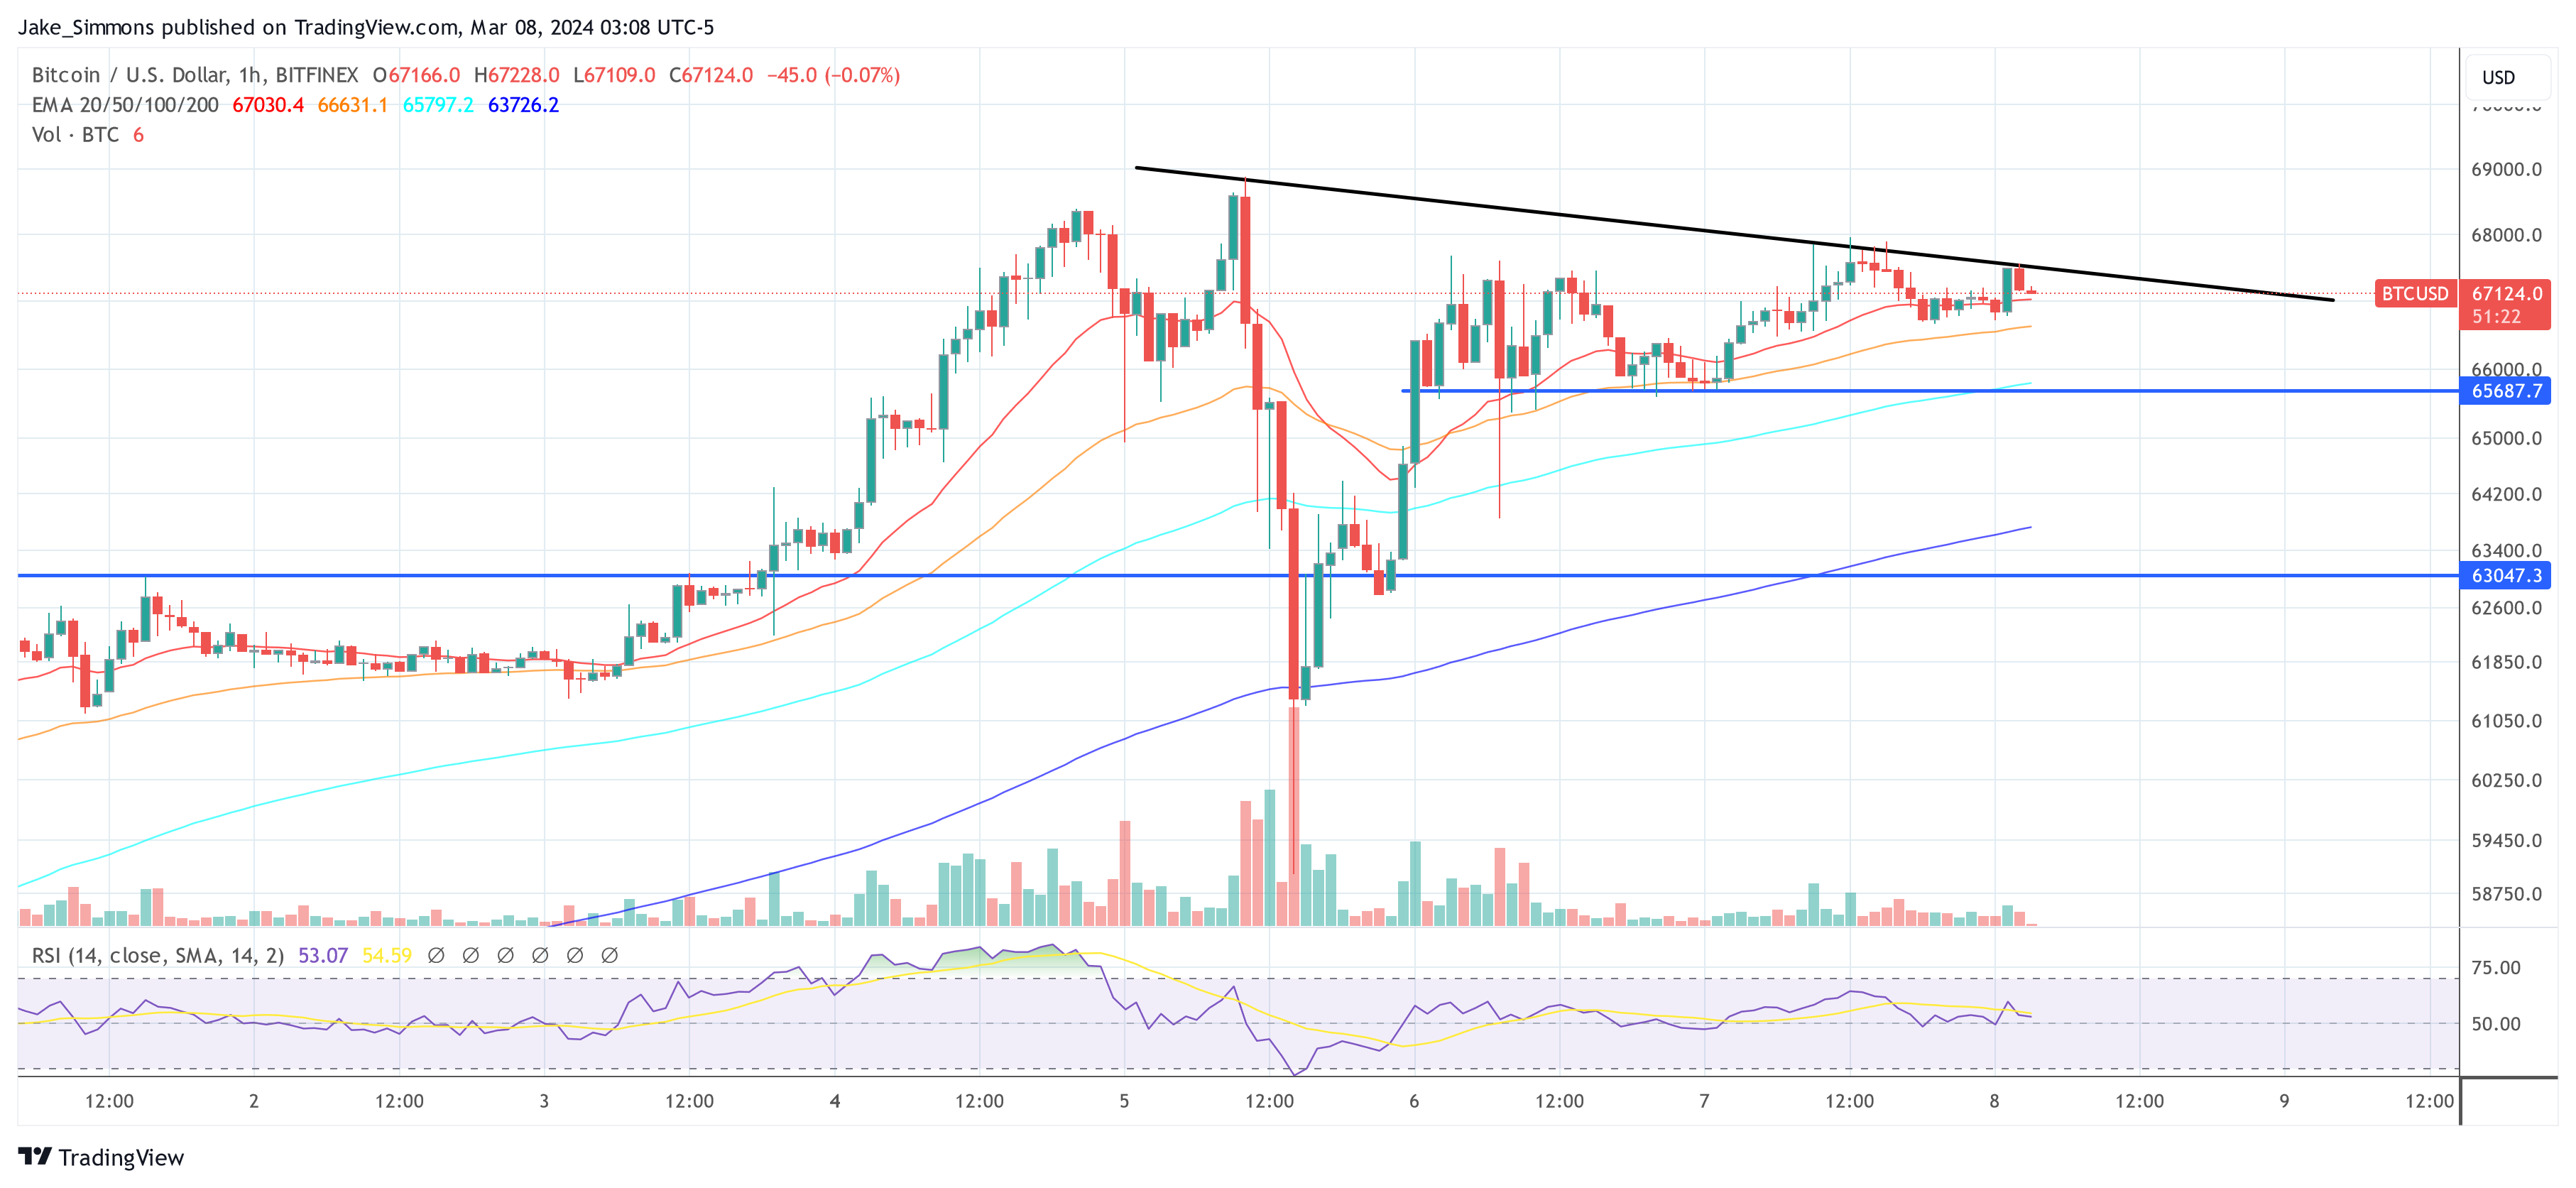
BTC trading at $63,405 on the daily chart | Source: BTCUSDT chart on Tradingview.com

Featured image from iStockphotos, chart from Tradingview

Bitcoin On Track For $1 Million Per BTC “Fair Value”, Analyst Says

An analyst has explained how the “fair value” of Bitcoin appears to be on track to achieve the $1 million milestone by 2035.

Bitcoin Total User Count Could Forecast Fair Value Path Forward

In a new post on X, analyst Willy Woo has discussed about how the fair value of Bitcoin could look like in the future based on the growth curve in the total user count on the network.

The “total user count” here refers to the total number of investors present in the BTC space. Often, this metric is equated with the total number of addresses on the network carrying a balance, but in reality, it’s not the most accurate method as a lot of investors own multiple wallets.

To make an estimation of an adoption curve, Woo has referred to all past studies done on the user count. The analyst shared the below chart in an X post a few days back.

Bitcoin Total User Count

The early part of the chart here is based on Glassnode’s on-chain clustering of addresses into “entities.” An entity is a collection of Bitcoin wallets that Glassnode has determined to belong to the same investor.

For the next part of the curve, Woo has added the Cambridge and Crypto.com data on verified exchange users. Finally, the analyst has projected the resulting growth rate forward.

According to this curve, there are a total of 426 million Bitcoin investors at the moment, with the number estimated to hit the 0.5 billion milestone by October of this year. Interestingly, the price of the cryptocurrency has been oscillating around this total user count growth curve throughout the years, as the below chart depicts.

Bitcoin Price Vs Adoption

More specifically, this oscillation in the price around the adoption curve of the cryptocurrency has existed since 2012. This means that in the pre-2012 period (the shaded region in the graph), this pattern doesn’t quite hold.

“In the early days price was slow to catch up to user count, BTC didn’t even have a price until the 1000th user came in,” notes Woo. “Price discovery started with early markets like New Liberty Standard and MtGox. By Aug 2011 Bitstamp launched and we had multiple global exchanges to properly price the asset.”

Now, if the growth curve of Bitcoin is taken as a guide for its future value as well, then the analyst projects a $1 million per BTC fair value by the year 2035. “Fair value” here is based on the line around which the asset has been oscillating.

From the chart, it’s visible that BTC has historically gained distance over this line during bull markets, so the peak value in future rallies can be significantly more than this fair value.

It now remains to be seen how the price of the cryptocurrency will develop in the coming years and whether this relationship between it and the total user count will continue to hold or not.

BTC Price

Bitcoin has observed a plunge of more than 8% over the past week, which has brought its price down to $58,600.

Bitcoin Price Chart

If History Repeats, This Is How Bitcoin Price Will Perform In The Next 6 Months

In a recent thread on X (formerly Twitter), renowned on-chain analyst Checkmate provided an analysis regarding the future trajectory of Bitcoin. Currently, the premier cryptocurrency hovers around the $60,000 mark, a pivotal moment that echoes historical patterns within the Bitcoin market cycle.

What Will The Next 6 Months Bring For Bitcoin?

Checkmate argues that Bitcoin is positioned in a “chopsolidation” phase—a term coined to describe a stagnant yet volatile period. He suggests that this could last approximately six months, based on previous cycles, and potentially usher in a period of parabolic growth that could last between six to twelve months. “Bitcoin history tends to rhyme, and thus far, this cycle is no different,” Checkmate noted. “The song sung during the last two cycles paints around 6-months of chopsolidation ahead of us, followed by 6-12 months of parabolic advance.”

Bitcoin Index Performance Since Cycle Low

Supporting his analysis, Checkmate refers to April 2021 as a significant high point for Bitcoin for “many good reasons,” noting that despite a considerable monthly drop of over $8,250 in April, such movements are typical and often signify healthy market corrections. “It’s an -11.2% monthly pullback, and is extremely common during uptrends, and corrections are healthy and necessary,” he stated, reinforcing his confidence in Bitcoin’s resilience and potential for recovery.

Bitcoin Monthly Price Performance

Further statistical backing comes from historical data focused exclusively on Bitcoin halving years (2012, 2016, 2020, and 2024), which Checkmate used to illustrate that such month-over-month corrections are not outliers but rather common occurrences within the digital asset’s cyclical trends. The end of each year post-halving has historically shown strong performance, supporting the notion that the current price point could be a precursor to significant gains.

Bitcoin Index Performance Since Cycle ATH
Sell In May And Go Away?

Checkmate also retweeted a post from Charles Edwards. The founder of Capriole Investments commented on the market’s unprecedented bullishness, implying that a deeper correction is to be expected.

“This is starting to get ridiculous. Bitcoin has not had a run like this since inception. We are now 1 day short of the record set in 2011 for days without a meaningful dip [more than 25%]. If you are not prepared to accept some downside in this asset class, you shouldn’t be here. Especially now,” said Edwards. His remark highlights the unusual lack of severe downturns in the market, suggesting that investors should be prepared for potential volatility.

In another post on X, Edwards added a cautious note to the otherwise optimistic outlook. He advised, “Sell in May and go away. This looks like distribution to me. As long as we trade below $61.5K, scenario (1) is technically more likely. A strong reclaim of $61.5K would give some hopes to the bulls for scenario (2). A flush would also be good for the sustaining continuation of the bull market, the sooner we get one, the better the long opportunities are.”

Bitcoin price analysis

This perspective suggests a strategic withdrawal may be wise in the short term, implying that current market conditions might be more bearish than they appear and that a significant correction could potentially strengthen the market’s long-term prospects.

At press time, the BTC plunged to $57,691.

Bitcoin price

Bitcoin To $92,190: Crypto Analyst Reveals Path To ATH Target

An analyst has explained what path Bitcoin might need to follow to surge to a new all-time high (ATH) target of $92,190.

Bitcoin Needs To Breach This Resistance Barrier To Rise To New ATH

In a new thread on X, analyst Ali discussed whether the BTC price has hit the top. The one signal the analyst has pointed out that may point towards the top has been the massive scale of profit-taking that the market has seen recently.

Ali is waiting for another confirmation before the top can be confirmed. In the scenario that the top gets validated, these are the targets the analyst has marked based on on-chain data.

Bitcoin URPD

The above chart shows the Bitcoin UTXO Realized Price Distribution (URPD) data from Glassnode, which tells us how many coins were last bought at what price levels.

Generally, the cost basis is an important level for any investor, so they are likely to show some reaction when a retest of it happens. This reaction is the largest when many investors share their cost basis around the same level.

When this retest happens from above, the holders may respond by buying more, as they could see the drop as a dip opportunity. As such, large cost basis zones below the current price can prove to be centers of support.

“If the market top is confirmed, BTC could drop toward $51,530 or even $42,700!” notes Ali, given that these two levels are the next major support lines for the coin.

The analyst says, however, that if BTC can instead break the $66,250 level, which is a source of major resistance right now since these loss holders may be desperate to exit at their break-even, then this bearish outlook could become invalidated.

An on-chain pricing model could provide some hints about what might happen when such a break occurs.

Bitcoin MVRV Pricing Bands

The Market Value to Realized Value (MVRV) Pricing Bands is a model that, in short, tells us about where the different multipliers of the average cost basis of the entire market currently lie.

The chart shows that the market cost basis is currently at $28,800. Historically, three multipliers of this metric have been relevant for the asset: 0.8x, 2.4x, and 3.2x.

The 0.8x level is where bottoms occur, while the 3.2x line is a probable spot for tops to form. Bull rallies in proper have occurred after a breach of the 2.4x level.

At present, the 2.4x level lies at $69,150. “By rising above $66,250, Bitcoin will gain the strength to push towards $69,150. And if this resistance barrier is breached, BTC can advance toward a new all-time high of $92,190,” explains Ali.

This ATH target is based on the fact that the 3.2x level is equivalent to $92,190 at the moment. It remains to be seen whether the top is already in and BTC would retest the lower levels or if more is left to this rally.

BTC Price

At the time of writing, Bitcoin is trading at around $61,100, down more than 7% over the past week.

Bitcoin Price Chart

Legendary Trader Predicts When Bitcoin’s Bull Run Will End

In a recent analysis, veteran trader Peter Brandt delved into the price behavior of Bitcoin, suggesting that the cryptocurrency might have reached its peak for the current cycle. According to Brandt, Bitcoin is exhibiting signs of “Exponential Decay,” indicating a weakening in the momentum of its bull market cycles over the years.

“Does history make a case that Bitcoin has topped? It’s called Exponential Decay — and it describes Bitcoin,” Brandt wrote. He further explained, “The fact is that the bull market cycles in Bitcoin have lost a tremendous amount of thrust over the years… I don’t like the Exponential Decay occurring in Bitcoin — Bitcoin is one of my personal largest investment positions.”

Brandt provided a historical breakdown of Bitcoin’s bull cycles, noting a consistent decrease in the magnitude of gains:

  • The bull cycle from December 21, 2009, to June 6, 2011, demonstrated a staggering 3,191X advance.
  • The subsequent cycle from November 14, 2011, to November 25, 2013, showed a reduced yet impressive 572X advance.
  • The period from August 17, 2015, to December 18, 2017, recorded a further diminished 122X advance.
  • More recently, the cycle from December 10, 2018, to November 8, 2021, saw just a 22X advance.

Bitcoin Reached Its Cycle Peak With A Probability Of 25%

Drawing on these historical patterns, Brandt extrapolated that the current cycle, which began on November 21, 2022, would likely see an approximate 4.5X gain from its low of $15,473, predicting a potential high near $72,723. Notably, this peak has already been nearly met with a price of $73,835 recorded on March 14, 2024. Brandt underscores this observation with a caution, “The magnitude of each bull cycle has been roughly 20% of its predecessor, indicating significant energy loss.”

In his analysis, Brandt does not shy away from addressing the implications of Bitcoin’s halving events, which have historically been catalysts for substantial price increases. Despite this, he emphasizes the undeniable presence of the decay pattern: “But for now, we need to deal with the fact of Exponential Decay. It has happened. It is real. You may not want to believe it, but I place a 25% chance that Bitcoin has already topped for this cycle.”

In a communication on X, Brandt responded to a counter analysis by fellow analyst @Giovann35084111, who argued that Bitcoin follows a power law over time, suggesting the potential for ongoing growth despite the observed decay. Brandt acknowledged the validity. “Quite a thorough analysis,” Brand commented.

@Giovann35084111’s analysis extends beyond cyclical trends by illustrating how deviations from the power law at specific intervals, particularly around halving events, provide a structured prediction model. This approach projects systematic patterns in Bitcoin’s price movements, reinforcing a bullish outlook. The analyst predicts a significant rise in Bitcoin’s price, estimating the next top at the end of 2025 to reach between $210,000 and $250,000.

In a later post, Brandt emphasized that his main prediction is an ongoing bull market into September/October 2025. He explained, “I give more credence to a report I issued in February. Here is a chart from that analysis — projecting a bull market until Sep/Oct 2025,” indicating that his views are influenced by evolving market data and theoretical models.

At press time, BTC traded at $62,450.

Bitcoin price

Standard Chartered Reaffirms $150,000 Bitcoin Price Target By Year-End

Geoff Kendrick, head of digital assets research at Standard Chartered, recently reiterated the bank’s ambitious Bitcoin price target of $150,000 by the end of this year, despite current market volatility and geopolitical tensions. In a comprehensive interview with BNN Bloomberg, Kendrick highlighted the significant role of ETF inflows and upcoming halving events in driving Bitcoin’s price.

Why Bitcoin Is Set For A Rally To $150,000 By Year-End

One of the principal drivers identified by Kendrick is the remarkable influx of capital into Bitcoin ETFs within the United States. Since the inception of these ETFs in early 2024, they have witnessed approximately $12 billion in net inflows. Kendrick highlighted the significance of these developments, stating, “The ETF inflows in the US have dominated really the demand supply metrics in 2024 so far. This is huge in terms of how the ETFs have gone so far.”

He drew parallels between the current trends in Bitcoin and the historical performance of gold following the introduction of gold ETFs. Kendrick elaborated on the potential scale of this trend by projecting, “From the start of this year to when the ETF market in the US is mature, we’ll get between $50 and $100 billion of inflow.”

In addition to the ETF inflows, the Bitcoin halving event was identified as another pivotal factor. This event, which reduces the reward for mining new blocks thereby halving the rate of new Bitcoin entering circulation, is set to reduce the daily production from 900 BTC to 450 BTC.

Although Kendrick mentioned that this halving might be “less important than previous ones,” he still considers it significant in the short-term supply dynamics. He stated, “Obviously, once we have the halving […], you have only half as many new coins, so that helps at the margin.”

Responding to questions about market skepticism, particularly criticism from figures such as JPMorgan CEO Jamie Dimon, who described Bitcoin as a “Ponzi scheme,” Kendrick offered a defense of Bitcoin’s underlying technology. He argued, “There’s a lot of people out there that don’t understand the basic methodology behind Bitcoin. And it’s really that blockchain technology, which is where the value is medium term.”

Looking Further Ahead

Kendrick continued, explaining the transformative potential of blockchain technology not just for financial services but across various industries, “Bitcoin is the first in on that. It’s the largest asset at the moment, makes up for more than 50% of the crypto market, but that opens up the Ethereum and other use cases, which quite frankly, over the next five to 10 years, you can easily see a lot of traditional finance go on chain.”

Furthermore, he addressed the recent market volatility, noting that Bitcoin had experienced a significant sell-off just prior to the halving, with $260 million in Bitcoin leverage positions being liquidated. The Standard Chartered exec interpreted this as a market correction that might set the stage for a healthier build-up post-halving, saying, “We’ve had a large move lower in Bitcoin. Specifically, on Saturday last weekend, there were $260 million Bitcoin leverage positions that were liquidated. So the market is now looking much more square going into the halving, if you like, in terms of leverage.”

Summarizing his perspective on the future trajectory of Bitcoin, Kendrick expressed a confident outlook, projecting not only recovery but a robust increase in Bitcoin’s price, driven by both the maturation of the ETF market and ongoing technological advancements. His vision for Bitcoin by the end of 2025 reaches even beyond the current year’s target, predicting a potential value of $200,000 per coin.

At press time, BTC traded at $66,556.

Bitcoin price

Bitcoin Set To Soar To $200,000 Post-Halving: Skybridge Founder

In a recent interview on the future of Bitcoin, Anthony Scaramucci, the founder and managing partner of Skybridge Capital, has made a compelling prediction that the Bitcoin price could potentially reach $200,000 following its forthcoming halving event. This forecast comes at a time of considerable volatility within the crypto markets, exacerbated by recent geopolitical tensions and broader economic uncertainty.

Bitcoin Poised To Hit $200,000

During the interview, Scaramucci provided insights into the forces he believes will drive Bitcoin’s price in the coming months. “Well, I mean, look, you could get shocks like wars and you could get, you know, God forbid a terrorist calamity or something like that that could take Bitcoin down 10 or 15%,” he explained. Despite potential short-term setbacks, Scaramucci emphasized the underlying demand dynamics bolstering Bitcoin’s price, particularly highlighting the influence of new financial products like ETFs and the growing interest from institutional investors.

He elaborated on his bullish outlook, linking it to the anticipated Bitcoin halving, an event that historically impacts the supply side of Bitcoin economics by reducing the reward for mining new blocks, thereby constraining supply. “But long term with the halving coming this week, I think this thing trades to $170,000, possibly to $200,000,” Scaramucci asserted.

The discussion also veered into the broader implications of Bitcoin’s integration into traditional financial products, such as ETFs. Scaramucci argued that these instruments play a critical role in broadening Bitcoin’s investor base.

He dismissed concerns over the potential for ETFs to lead to centralization of Bitcoin ownership. “In terms of adoption vis-a-vis the ETF, you look out your four-year time horizon. […] It will still be less than 10 % of the overall ownership of Bitcoin. So this whole notion that the ETFs are gonna overly centralize Bitcoin, I don’t buy it. I think what the ETFs are, though, is they’re a great conduit for people that are used to buying them.”

BTC Is Still In The Web 1.0 Era

Scaramucci compared Bitcoin’s trajectory to the early internet era, particularly drawing parallels with significant tech stocks like Amazon during the dot-com bubble. “In 1999, Amazon was an emerging stock on an emerging technology, and it was quite volatile. And you lost 20 to 50 % eight times on Amazon. You lost 80%. Yeah, that one time in March of 2020, it went down 80%. But if you held Amazon over that period of time, $10,000 is worth a little over $14 million today.”

He also addressed concerns about Bitcoin’s practical uses, contrasting its current utility with more traditional assets like gold, which also do not offer direct cash flow. Scaramucci highlighted innovative financial practices within the crypto ecosystem that provide returns similar to traditional cash flow, such as yield-generating accounts and borrowing agreements available through platforms like Galaxy Digital.

Regarding potential market downturns akin to the dot-com bust, Scaramucci acknowledged the risks but remained optimistic about Bitcoin’s resilience and long-term value proposition. “I think if we go through a dot-com bust in the broader market in the next year or two, I think you’ll have a price shock in Bitcoin consistent with a dot-com bust. However, if you’re willing to hold that asset, which we are over a rolling four-year period of time, no one has ever lost money in Bitcoin,” he noted, underscoring the importance of a long-term investment horizon.

At press time, the BTC price rallied back above $64,000.

Bitcoin price

12 Days Until Bitcoin Halving: Why $100,000 Isn’t Much Further Away

With the fourth Bitcoin halving just 12 days away, the community is buzzing with anticipation, speculating on the potential for Bitcoin to breach the significant $100,000 threshold. Joe Consorti of Theya Research has offered a comprehensive analysis, diving into the intricacies of Bitcoin’s current market position and the factors that might catapult its value to new heights.

This event, a cornerstone in Bitcoin’s design to halve the rewards for mining new blocks every four years, historically triggers a bullish momentum, and the present scenario appears to be aligning with past precedents.

The Significance Of Bitcoin’s Consolidation Phase

Consorti’s analysis titled, “Bitcoin’s 4th Halving Is [12] Days Away, and $100,000 Isn’t Much Further Behind It”, begins with a deep dive into Bitcoin’s ongoing consolidation phase, which he argues is a critical period that precedes a potential bull run.

“Bitcoin continues its consolidation. In keeping with its previous phases of consolidation at $30k and $40k, BTC spends several weeks at key psychological price levels exchanging hands between buyers and sellers before advancing higher,” Consorti stated on X.

He emphasizes that this is the sixth week of Bitcoin’s consolidation above $60,000, marking the least volatile period at this price level and following a new all-time high. This, according to Consorti, signals a strong market confidence that could be the foundation for the next surge.

The analysis further explores the broader market dynamics, particularly the correlation breaks within the current cycle that have made the stock market an unreliable indicator of US economic sentiment. “The market at large has experienced massive correlation breaks this cycle […] This has a great deal to do with businesses extending their debt maturity during 2021 when rates were still low, and the US Treasury’s massive crisis-level fiscal deficit,” Consorti explains.

He argues that these factors have contributed to the decoupling of traditional economic indicators from the stock market’s performance, inadvertently benefiting asset prices, including Bitcoin.

The Role Of ETFs And The Spot Market

A significant portion of Consorti’s analysis is dedicated to the behavior of Bitcoin ETFs and their interaction with the spot market.

Despite a slowdown in net inflows to Bitcoin ETFs, the volume remains robust, indicating a healthy market. “This was one of the lowest weeks yet for BTC ETF inflows, although when you net in the outflows they are still healthy compared to previous weeks,” Consorti notes, suggesting that ETF shares are actively exchanging hands, mirroring the consolidation seen in the spot market.

This interplay between ETFs and the spot market, according to Consorti, provides a stable foundation for Bitcoin’s price, further solidifying the case for an impending bull run. “The funding rate is extremely muted, and we’re still at the same price [around $70,000]. In this period of consolidation, the spot market has really taken control of Bitcoin price action. This will mean more stable footing for the ensuing bull run, raising my confidence further that this consolidation is preceding a move higher rather than lower,” Consorti concluded.

Expert Consensus On The Bullish Outlook

Consorti’s optimistic forecast is echoed by other industry experts, who have also shared their bullish predictions. CRG, another renowned analyst, emphasized the significance of Bitcoin’s recent performance, stating, “Great weekly close. Fresh all-time highs this week,” indicating a positive momentum that could be sustained in the post-halving period.

TechDev, a crypto analyst, highlighted a rare pattern in Bitcoin’s trading history: “It doesn’t happen often. Bitcoin closed 2 consecutive months over the upper Bollinger band. Each time it has then doubled within 3 months before the next red candle.” This historical pattern, if repeated, could potentially drive Bitcoin’s price way beyond $100,000.

Daan Crypto Trades provided a technical perspective, focusing on Bitcoin’s resistance levels and potential targets: “Thoses previous ‘resistances’ didn’t end up putting much of a fight. It’s just the previous all-time high that’s making the price stall for the time being. Targets above are ideas for price discovery if we can leave this area behind us.” Daan’s targets are the 1.272 Fib at $83,562, the 1.414 Fib at $91,164 and the 1.618 Fib at $102,085.”

At press time, BTC traded at $69,739.

Bitcoin price

Hedge Fund Manager Predicts When Bitcoin Price Will Reach $150,000

Founder and Chief Executive Officer (CEO) of Morgan Creek Capital Management, Mark Yusko has predicted a massive price increase for Bitcoin during the 2024 bull cycle. Emphasizing  Bitcoin’s immense potential, the hedge fund manager has crowned it as the unrivaled “King” among digital assets.

$150,000 Price Target Set For BTC

Appearing in a recent interview with CNBC Television on March 27, Yusko shared a bold forecast of Bitcoin, predicting that the cryptocurrency will see a significant rise to $150,000 in 2024. 

When asked why he believes the cryptocurrency would have such an astronomical price increase, Yusko cited the impacts of the upcoming Bitcoin halving and Spot Bitcoin Exchange Traded Fund (ETF), on the price of BTC. The hedge fund manager has revealed that historically after a BTC halving cycle is completed, the fair value of the cryptocurrency rises. 

He explained that when the upcoming 2024 Bitcoin halving occurs in April, BTC miners will face challenges, with transaction fees poised to soar, consequently driving a price increase to $75,000. 

After the Bitcoin halving event, the cryptocurrency is expected to surge two times its fair value to $150,000. The hedge fund manager cited factors like increased interest from investors and Fear of Missing Out (FOMO) as triggers for this price spike. 

Yusko also revealed that after the Bitcoin halving, there would be a surge in demand for Spot Bitcoin ETFs, while the supply of new coins would decrease from 900 BTC to 450 BTC a day.  “If there’s more demand than supply, price has to rise,” the hedge fund manager stated. 

The investment management CEO has expressed a strong belief in BTC’S value as one of the world’s leading digital assets. He envisions the cryptocurrency “easily” skyrocketing by 10x over the next decade. 

“Bitcoin is the king, it is the dominant token. It is a better form of gold or digital property. And I do think it will be the best,” Yusko said. 

Bitcoin Price Top Expected By Year’s End

During his interview, Yusko predicted that Bitcoin could reach its peak price value by the end of 2024. The hedge fund manager disclosed that historically, nine months after a Bitcoin halving event, sometime in December, BTC undergoes a surge to its peak value before entering the next bear market. 

During this time, the investment management CEO has stated that smaller crypto projects could potentially experience substantial increases, surpassing the gains witnessed by BTC. He disclosed several altcoins and investment assets that his company, Morgan Creek Capital Management, typically buys and HODLs, including Solana, Avalanche and Coinbase.

Bitcoin price chart from Tradingview.com

Wyckoff ‘SOS’ Could Catapult Bitcoin To $100,000: Hedge Fund Manager

Charles Edwards, founder of the Bitcoin and digital asset hedge fund Capriole Investments, published a detailed examination of Bitcoin’s current market phase suggesting a bullish trajectory, potentially reaching the $100,000 mark. The analysis hinges on the identification of a Wyckoff ‘Sign of Strength’ (SOS), a concept derived from the century-old Wyckoff Method that studies supply and demand dynamics to forecast price movements.

Understanding The Wyckoff ‘SOS’: Bitcoin To $100,000?

The Wyckoff Method, developed by Richard D. Wyckoff, is a framework for understanding market structures and predicting future price movements through the analysis of price action, volume, and time. The ‘Sign of Strength’ (SOS) within this methodology signifies a point where the market shows evidence of demand overpowering supply, indicating a strong bullish outlook.

Edwards’s observation of an SOS pattern in Bitcoin’s recent price movements suggests that the market is at a pivotal point, where sustained upward momentum is highly probable. In Capriole’s latest newsletter, Edwards offered a precise depiction of Bitcoin’s market behavior, highlighting a period of volatility and consolidation in the $60,000 to $70,000 range.

This phase was anticipated by the hedge fund. Currently, as Bitcoin ventures above its last cycle’s all-time highs, it aligns with the predicted zig-zag SOS structure. Edwards elucidates, “It would not be surprising to see a liquidity grab at / into all-time highs […] All consolidation above the Monthly level at $56K is extremely bullish. It would be uncommon (but not impossible) for price to continue in a straight line up.”

The “zig-zag” phase also perfectly aligns with the halving cycle as BTC tends to consolidate “both months either side of the Halving.” Edwards added that “the realities of a much lower supply growth rate + unlocked pent up tradfi demand will then kick-in and launch 12 months of historically the best risk-reward period for Bitcoin.”

From a technical perspective, Bitcoin’s foray into price discovery territory above $70,000 is devoid of significant resistance levels. This opens a pathway to psychological and Fibonacci extension levels, with Edwards pinpointing $100,000 as the next major psychological resistance.

The 1.618 Fibonacci extension from the 2021 high to the 2022 low is noted at $101,750, serving as a technical marker for potential resistance. Edwards reflects on investor sentiment, stating, “You can also imagine quite a few investors would be happy seeing six-digit Bitcoin and taking profit in that zone,” acknowledging the psychological impact of such milestones.

Bitcoin price analysis

BTC Fundamentals Support The Bull Case

Edwards also delves into the importance of fundamentals, underscoring their role in providing a bullish backdrop for Bitcoin. The introduction of the Dynamic Range NVT (DRNVT), a unique metric to Capriole, indicates that Bitcoin is currently undervalued. Edwards describes DRNVT as “Bitcoin’s ‘PE Ratio’”, which assesses the network’s value by comparing on-chain transaction throughput to market capitalization.

The current DRNVT readings suggest an attractive investment opportunity, given Bitcoin’s undervaluation at all-time price highs. “What’s fascinating at this point of the cycle is that DRNVT is currently in a value zone. With price at all time highs, this is a promising and unusual reading for the opportunity that lies ahead in 2024. It’s something we didn’t see in 2016 nor 2020,” Edwards remarked.

Dynamic Range NVT

With both technical indicators and fundamental analysis signaling a bullish future for Bitcoin, the anticipation surrounding the upcoming Halving event adds further momentum to the positive outlook. Despite the expectation of volatility and consolidation in the short term, Edwards confidently states, “probabilities are starting to skew to the upside once again.”

At press time, BTC traded at $69,981.

Bitcoin price

Bitcoin Bull Flag Could Predict 10% Surge To $77,000, Analyst Explains

An analyst has explained that a breakout from a bull flag pattern could lead Bitcoin to surging towards a new all-time high of $77,000.

Bitcoin Has Been Forming A Bull Flag Pattern Recently

In a new post on X, analyst Ali has discussed about a bull flag recently forming in the 4-hour price of the cryptocurrency. The “bull flag” here refers to a pattern in technical analysis that, as its name implies, looks like a flag on a pole.

In this pattern, a sharp uptrend is succeeded by a period of consolidation towards the downside. The uptrend makes up for the pole, while the consolidation period acts as the flag.

When the price is trapped inside the flag, it tends to find resistance at its upper line, so tops may be probable to form there. Similarly, the lower line may act as support, thus facilitating for bottoms to take shape.

The bull flag is usually considered to be a continuation pattern, meaning that the prevailing trend (that is, the trend of the flag) would continue once the consolidation period is over.

This happens when a break above the resistance line takes place. The uptrend emerging out of such a break may be of the same height as the pole. If the asset falls under the support line, though, the pattern could be considered invalidated.

Like the bull flag, there is also the bear flag pattern, which works similarly except for the fact that the pole in this case corresponds to a downtrend while the flag is generally a consolidation channel angled upwards. Just like the bull flag, a continuation of the prevailing bearish trend may follow this formation.

Now, here is the chart shared by Ali that shows the bull flag that BTC’s 4-hour price has recently been consolidating inside:

Bitcoin Bull Flag

From the graph, it’s visible that the 4-hour Bitcoin price has appeared to have been consolidating inside this bull flag over the last few days. It’s also apparent that, in the past day, BTC has been climbing above the resistance line of the pattern.

This could mean that the cryptocurrency is preparing a break out of this formation. Naturally, the asset would have to show more momentum before the breakout can be confirmed.

“If BTC holds above $70,000, we could see a surge of nearly 10% to a new all-time high of $77,000!” says Ali. The analyst has chosen this target as such a swing would be of the same length as the pole that had preceded this flag.

BTC Price

Bitcoin has so far been heading in a direction that would add more credence to the breakout, as its price has now broken past the $71,300 level. With this surge, BTC investors would be enjoying profits of more than 7% over the past week.

Bitcoin Price Chart

Standard Chartered Predicts Bitcoin At $150,000, ETH At $8,000 By Year-End

Standard Chartered’s latest research notes offer a very bullish outlook for the major digital assets, Bitcoin (BTC) and Ethereum (ETH), by the end of 2024 and beyond. The bank’s analysts project Bitcoin could reach $150,000, while Ethereum could hit the $8,000 mark.

These projections come amidst a backdrop of significant developments in the crypto space, including the launch of Bitcoin spot Exchange-Traded Funds (ETFs) and Ethereum’s recent Dencun upgrade.

Bitcoin’s Path To $150,000

The bank’s research delves deep into the factors propelling Bitcoin’s potential surge to $150,000 by year-end. Central to this projection is the influence of Bitcoin spot ETFs, which, since their launch on January 11, have seen rapid inflows exceeding increases in open interest.

According to the bank, this suggests a more robust and sustainable positioning for Bitcoin, distinct from previous speculative peaks. “Rapid inflows to the new Bitcoin (BTC) spot ETFs have dominated […] Most of the inflows are likely to be sticky pension-type flows,” Geoff Kendrick and Suki Cooper elucidate, highlighting the newfound stability in Bitcoin investment trends.

Three pivotal analyses form the cornerstone of Standard Chartered’s Bitcoin valuation:

  1. Gold Analogy: Drawing parallels with the gold market’s response to the introduction of US gold ETFs, the bank estimates Bitcoin could rise to the $200,000 level, marking a 4.3x increase from its pre-ETF price.
  2. Two-Asset Optimization: By optimizing a portfolio with 80% gold and 20% Bitcoin at current gold prices, the analysis suggests a Bitcoin level around $190,000.
  3. ETF Inflows Correlation: Linear extrapolation based on the correlation between ETF inflows and Bitcoin price points to a possible $250,000 level, assuming total ETF inflows around the bank’s midpoint estimate of $75 billion.

Standard Chartered notes that these three measures suggest “that $200,000 is the ‘correct’ end-2025 price level for BTC, […] and that it is likely to be the new midpoint for a sideways trading range at that time.”

Further the research notes that an “overshoot to $250,000 is likely at some point in 2025 if ETF inflows continue apace and/or reserve managers buy BTC.” Previously, the bank only predicted a Bitcoin price of $100,000 by the end of 2024.

Ethereum’s Road To $8,000

Ethereum’s expected climb to $8,000 by the end of 2024 is anchored in two transformative developments: the Dencun upgrade and the expected approval of ETH spot ETFs. The recent Dencun upgrade, by significantly lowering transaction costs on layer 2 blockchains, enhances Ethereum’s competitive edge.

“Ethereum (ETH) has just undergone the ‘Dencun’ upgrade, which dramatically lowers the cost of transactions […] making ETH more competitive,” the research notes.

The forecast also hinges on the anticipation of US SEC approval for ETH ETFs by May 23, a decision poised to catalyze substantial inflows into Ethereum. Drawing from the Bitcoin ETF experience, Standard Chartered expects similar enthusiasm for Ethereum, with projected inflows of 2.39-9.15 million ETH (equivalent to roughly $15-45 billion).

This substantial capital infusion is seen as a crucial lever for Ethereum’s price surge. “We expect significant ETF-driven inflows to ETH […] This could drive ETH to the $8,000 level by end-2024,” the bank elaborates, underscoring the parallel potential for growth akin to Bitcoin’s trajectory.

The Prognosis For 2025 And Beyond

Looking further ahead, Standard Chartered ventures into the terrain of 2025 predictions, where the bank sees the ETH-to-BTC price ratio ascending back to the 7% level, a hallmark of the 2021-22 period.

This adjustment forecasts an Ethereum price of $14,000 by the end of 2025, given the projected Bitcoin level of $200,000. Such a scenario underscores the bank’s optimism about the enduring value proposition and growth potential of these leading digital assets in the medium term.

At press time, BTC traded at $68,401.

Bitcoin price

Bernstein Analysts Convinced Bitcoin Is Headed For $150,000, Here’s Why

Analysts from private wealth management firm, Bernstein have reaffirmed their previous Bitcoin prediction, emphasizing that the cryptocurrency has a greater chance to reach $150,000 by 2025. 

Bitcoin $150,000 Price Forecast Grows Stronger

Bernstein analysts Gautam Chhugani and Mahika Sapra said in a note to clients on Monday that they were now more convinced of Bitcoin’s exponential surge to new all-time highs at around $150,000 by mid-2025. The analyst’s statements were a reiteration of their earlier Bitcoin forecast in November 2023, when they predicted the price of Bitcoin to surge to $150,000.

At the time, Bitcoin was trading around a price of $35,000, putting the analysts’ estimate at around five times the price of BTC. Now with BTC recently witnessing remarkable surges to new all time highs above $71,000, and potentially continuing its upward momentum, Bernstein analysts’ forecast seems more probable.

Analysts from the private wealth investment firm have disclosed several factors that could trigger BTC’s bullish momentum. Highlighting the success and surging demand for Spot Bitcoin Exchange Traded Funds (ETF), the company boldly affirmed that large volume of inflows into Spot Bitcoin ETFs could significantly contribute towards increasing the value of BTC. 

“We estimated $10 billion inflows for 2024 and another $60 billion for 2025. In the last 40 trading days since the ETF launch on Jan 10, Bitcoin ETF inflows have crossed $9.5 billion already,” Bernstein analysts wrote. 

Sharing the sentiment of most crypto analysts in the market, Bernstein analysts believe that the price of BTC could experience a fresh “break out” after the halving event in April 2024. At the time of writing, the cryptocurrency is trading at $68,218, witnessing a slight price correction of about 6.96% in the past 24 hours, according to CoinMarketCap. 

Miners To Become Top Beneficiaries Of BTC Surge

In their note, Bernstein analysts highlighted that investing in Bitcoin miners could be the best equity proxy to BTC. According to their analysis, BTC miners typically outperform during BTC bullish cycles and conversely underperform during bearish periods.

As Bitcoin rapidly rises to all time highs above $71,000, Bernstein analysts expect that institutional interest in Bitcoin related equities could top over, with BTC miners becoming one of the largest beneficiaries. Despite various analysts predicting that the next Bitcoin halving could potentially become a death sentence to small mining companies and solo miners, Bernstein analysts have revealed that the rising price of BTC and elevated transaction fees could serve as a cushioning mechanism for miners during the halving period. 

Bitcoin price chart from Tradingview.com

Samson Mow Gives Reasons Why Bitcoin Price Could Reach $1 Million This Year

The CEO of Jan3 and Bitcoiner, Samson Mow, is still standing by his prediction that Bitcoin could hit $1 million sooner rather than later. During a recent interview, he explained why he is sticking to his ambitious price prediction. 

Why Bitcoin Would Hit $1 Million This Year

Mow mentioned during an interview with ‘What Bitcoin Did’ Host Peter McCormack that BTC will hit $1 million this year, if not this year, in 2025. He further explained that BTC’s current setup is well structured for this parabolic run. For one, he noted that BTC’s demand far exceeds its supply.

Mow highlighted the Spot Bitcoin ETFs, which accumulate almost 4,000 BTC daily. This amounts to about 1.5 million BTC, which these funds can pull over a year, which could drastically reduce the amount of BTC in circulation. These Bitcoin ETFs are already reported to hold a significant percentage of Bitcoin’s circulating supply. 

The Bitcoin maximalist also recognized crypto exchanges that take in large BTC inflows. Therefore, Mow believes the price should “react accordingly” as Bitcoin’s demand continues to exceed the Miners’ supply, which will be cut in half during the Bitcoin Halving. Even if this theory doesn’t play out, he remarked that the concept of the ‘Veblen effect’ will apply to Bitcoin.

What The ‘Veblen Effect’ Is About

The Veblen effect is when consumers purchase an item even as its price increases. In this case, Mow opines that investors will continue to invest in Bitcoin regardless of how high this rises. This sustained interest in the flagship crypto can also lead to further price surges. This Veblen effect is already in full force as Bitcoin continues to attract new investors.

Mow also laid a scenario where BTC attains Gold’s market cap and surpasses it. When that happens, he stated that people will start demonetizing Gold and substituting it for BTC, seeing the crypto token as a better alternative. While he recognized that some investors are already substituting their Gold for Bitcoin, Mow stated that it will happen “en masse” when BTC flips Gold. 

Although ambitious, Samson Mow’s ambitious prediction cannot be discarded, considering that he had previously predicted that Bitcoin would hit a new all-time high (ATH) before the Halving event, which it already did. This is the first time the crypto token hit a new ATH before the Halving. 

At the time of writing, BTC is trading at around $73,000, up in the last 24 hours according to data from CoinMarketCap. 

Bitcoin price chart from Tradingview.com

Crypto Expert Reveals Why Bitcoin Could Hit $200,000 By April

A crypto analyst has forecasted Bitcoin’s price to surge to unprecedented highs ahead of the 2024 Bitcoin halving event scheduled for April. The cryptocurrency has already been experiencing significant gains, surpassing its previous all-time high to trade above $70,000. 

Bitcoin’s Path To $200,000

In a recent X (formerly Twitter) post, crypto analyst, Gert van Lagen provided a compelling narrative supporting Bitcoin’s bullish trajectory leading up to the halving event in April 2024. 

Sharing a price chart illustrating Bitcoin’s recent bullish movements, Lagen revealed that the cryptocurrency doubled in value within 10, 18 and 84 days following its surge to new all-time highs. As a result of this massive rallying trend, the analyst confidently expressed his belief that a move to $200,000 before the halving cycle in April is becoming more plausible. 

Traditionally, the Bitcoin halving marks an event where the rewards for mining new blocks are cut by half, leading to a subsequent reduction in the cryptocurrency’s supply and contributing to a sustainable increase in its value. The highly regarded four-year event is usually accompanied by a significant bull run for Bitcoin and other cryptocurrencies within the market. 

Contrary to historical patterns indicating that the Bitcoin bull run typically aligns with the halving event, the cryptocurrency has been experiencing unprecedented gains in anticipation of the halving, leading analysts to consider the possibility of an even larger price jump during the event. 

The cryptocurrency’s achievement of a new all-time high before the halving stands as an extraordinary occurrence, underscoring the immense demand and growing popularity of Bitcoin in the crypto space. 

Including Lagen, other analysts have predicted bullish outcomes for Bitcoin ahead of the halving event. According to crypto analyst, “The Bitcoin Therapist,” on X, Bitcoin is expected to rise to $100,000 by April. Additionally, a steady rise to new all-time highs at $75,000 is expected to occur before the halving, as stated by another crypto analyst. 

Bitcoin Smashes Through $70,000 Barrier

Following its previous surge to $70,000 on Friday, March 8, 2024, Bitcoin encountered a minor setback, retracting to a level just above $69,000. However, in the last 24 hours, the cryptocurrency has recorded an unprecedented surge, amassing approximately 2.68% and currently trading above the $71,000 price mark, according to CoinMarketCap.

This price increase marks a historic milestone for the cryptocurrency as it reaches an all-time high above $71,000 for the first time. As of this moment, Bitcoin is trading around $71,312, experiencing significant price fluctuations that have contributed to its recent gains. The cryptocurrency’s 24-hour trading volume is also up by 82.80%, underscoring the increasing demand and interest in the pioneering digital currency.

Bitcoin price chart from Tradingview.com

Crypto Analyst Says Bitcoin Is Heavily Undervalued Despite ATH, What’s The Fair Value?

Despite Bitcoin recently hitting a new all-time high (ATH) of over $70,000, crypto analyst Michaël van de Poppe believes that there is still more room for significant moves to the upside. Interestingly, he also expects that this bull cycle will be one like no other.

Bitcoin Still Heavily Undervalued

Michaël van de Poppe mentioned in an X (formerly Twitter) post that Bitcoin was still “heavily undervalued” despite hitting a new ATH. He added that the value is “way higher” and noted how the flagship crypto can help hedge against inflation and keep one’s purchasing power alive. Meanwhile, the crypto analyst believes there will be “way higher numbers” in this cycle.

Michaël van de Poppe had previously hinted at Bitcoin rising to as high as $150,000 in this bull run. Other analysts have also given similar price predictions, with the consensus that BTC will surely rise above $100,000. Other crypto analysts, including MacronautBTC, have even gone as far as predicting that Bitcoin could rise above $200,000. 

There is a growing belief that this bull cycle will be the mother of all past cycles, which could be the reason for such ambitious predictions. Moreover, this cycle has the Spot Bitcoin ETFs, something past bull runs didn’t have. These ETFs have ushered in more institutional demand for the flagship crypto, which has led to an overall increase in the demand for Bitcoin. 

Interestingly, NewsBTC previously reported that the demand for Bitcoin is significantly exceeding Miners’ supply. This development is coming at a time when miners’ rewards are set to be cut in half during the Bitcoin Halving. This would likely lead to more imbalance between the demand and supply curve, potentially leading to an exponential surge in Bitcoin’s price. 

BTC Still Has Enough Time To Hit New Highs 

Bitcoin hitting a new ATH of $70,000 is just the beginning of this bull run, as there is reason to believe this bullish momentum could run into next year. Crypto analyst Ali Martinez noted in an X post that Bitcoin has “consistently taken about 8 to 11 months to hit a market top” whenever it has shattered its previous ATH.   

With Bitcoin currently hitting new highs, the analyst added that historical patterns suggest that the next BTC market top “will be sometime between November 2024 and February 2025.” However,  Alex Thorn, Head of Research at Galaxy Digital, has warned that “bull markets are not straight lines up” and that sharp corrections should be expected along the way. 

At the time of writing, Bitcoin is trading at around $68,300, up over 2% in the last 24 hours according to data from CoinMarketCap. 

Bitcoin price chart from Tradingview.com

Here’s How Much Elon Musk’s Tesla And SpaceX Have Made From Their Bitcoin Holdings

A new report has revealed the total Bitcoin assets held by Elon Musk’s Tesla and SpaceX companies and how much profit they’re seeing so far.   

Tesla And SpaceX Bitcoin Holdings Unveiled

On Thursday, March 7, Arkham Intelligence, an AI-based blockchain analytics platform, revealed the Bitcoin holdings of SpaceX and Tesla, two companies co-founded by X (formerly Twitter) owner, Elon Musk. The comprehensive report also outlined Tesla’s BTC transactions spanning from 2021 to 2024.

According to Arkham, Tesla had purchased about $1.5 billion worth of BTC in January 2021. Subsequently, the automotive company initiated multiple transfers, opting to sell off its Bitcoin holdings valued at $272 million in the first quarter of 2021 and about $936 million in the second quarter of 2022.  

Arkham has claimed that the automotive company currently possesses a staggering 11,510 BTC, valued at $780 million. Furthermore, Tesla’s substantial Bitcoin holdings are reportedly spread across 68 wallet addresses. 

On the other hand, SpaceX, a private space exploration and technology company, currently holds about $8,290 BTC worth approximately $560 million. These assets are reportedly distributed across a total of 28 wallet addresses. 

The combined BTC holdings of these two companies place them in a league comparable to the BTC holdings of major financial institutions. Tesla has secured the third position among the largest Bitcoin holders, with MicroStrategy leading the list, possessing around 190,000 BTC worth over $8 billion. 

Despite the considerable amount of BTC held by Musk’s companies, the CEO has seemingly had a love-hate relationship with Bitcoin. Earlier in 2023, Bitcoin crashed below $25,000 after Musk’s SpaceX sold all its Bitcoin holdings. However, it seems the space company is showing more interest in BTC, as seen by its massive Bitcoin portfolio. 

Tesla May Be Buying More BTC

A crypto community member, identified as “Definalist” on X, has shared insights, suggesting that Tesla might be increasing its involvement in Bitcoin. Referring to Arkham Intelligence’s report of Tesla’s BTC holdings, Definalist disclosed Tesla’s acquisition of an additional 1,790 BTC. 

Definalist has revealed that in 2023, Tesla’s BTC balance sheet had held about 9,720 BTC. Fast forward to 2024, the automotive company’s portfolio has expanded to 11,510 BTC, revealing an unreported acquisition of an extra 1,790 BTC. 

This significant Bitcoin purchase could be attributed to the growing enthusiasm for the cryptocurrency, driven by its recent bullish momentum and massive price increases. At the time of writing, Bitcoin is trading at a price of $67,279, according to CoinMarketCap. The cryptocurrency previously surged to an all-time high of $69,200 on March, 5, after which it retraced to its current price level.

Bitcoin price chart from Tradingview.com

Bitcoin Price Forms Inverse Head And Shoulders Pattern, Eyes $76,000

Just below the all-time high of $69,000, the Bitcoin price has shown more volatility in recent days, only to now tread water around $67,000. But this boredom could soon be over. Following the recent price movements, a notable pattern has emerged on the Bitcoin (BTC) price chart, as recognized by the seasoned crypto analyst Josh Olszewicz.

Bitcoin Price Rallye To $76,000 Next?

An inverse head and shoulders (iH&S) pattern, often seen as a bullish indicator, has formed on the Bitcoin 1-hour chart, suggesting a potential upward price movement. This pattern, while admittedly imperfect as per Olszewicz, is considered tradeable in his view. “[The] pattern is definitely not perfect but still tradeable imo,” he remarked.

An Inverse Head and Shoulders (iH&S) pattern is a bullish reversal pattern in technical analysis, signaling a potential upward reversal in price trends. It consists of three troughs with the middle trough being the lowest, resembling the shape of a head and two shoulders, but flipped upside down.

Bitcoin inverse head and shoulders pattern

In this scenario, Bitcoin’s chart shows the formation with a head at approximately $59,000 and shoulders forming around the $65,000 and $65,700 mark. The pattern suggests that a bullish move is brewing. Traders often use iH&S patterns to identify potential buying opportunities, with entry points typically near the neckline breakout.

The analyst’s chart points to a neckline (dotted red line) slanting downward, intersecting with the right shoulder in the coming days. A breakout above this line is typically required to confirm the pattern. At the current price, Bitcoin is trading just below the neckline.

For traders eyeing potential targets, Olszewicz’s analysis projects an ambitious goal of $73,000 to $76,000, aligned with the Fibonacci extension levels of 1.618 ($72,610.59) and 2 ($75,776.31). These levels represent significant price points that Bitcoin might test if the pattern is confirmed with a solid breakout.

One element that could fortify the potential upward journey is a volume breakout, which the analyst has hinted at with a question mark. The volume indicator on the chart shows an increasing trend, but a decisive surge in volume is typically sought after to confirm an iH&S pattern.

Moreover, Olszewicz has marked a potential stop loss (SL) level with a dashed green line. This level around $65,680 serves as a risk management tool for traders should the pattern fail to realize the upward breakout.

At press time, BTC traded at $67,124.

Bitcoin price

Crypto Analyst Uses Historical Data To Show When The Bitcoin Price Will Reach $207,000

A crypto analyst has laid out a scenario where the Bitcoin price could rise above $200,000 by June. This is based on a historical occurrence that could play out again following BTC’s recent run above its previous all-time high (ATH).

How BTC Could Rise To $207,000 By June

The anonymous analyst behind the prominent crypto X (formerly Twitter) account, Bitcoin Archive, alluded to the 2021 bull run when Bitcoin’s price more than tripled in just 103 days after breaking the previous cycle’s ATH. That means Bitcoin could run to $207,000 by June if history repeats itself. 

Bearing the Bitcoin Halving event in mind, Bitcoin’s price tripling by June looks feasible. Bitcoin’s price has more than tripled 90 days after previous Halving events. Considering that Bitcoin surpassed its previous ATH even before this Halving, which is set to take place in April, the flagship crypto could also achieve this exponential price surge in record time this time around. 

This narrative is supported by the fact that Bitcoin’s demand continues to exceed its supply, and the supply will be further reduced when miners’ rewards are cut in half. Therefore, although ambitious, a price surge of such magnitude cannot be ruled out. 

Moreover, crypto analyst MacronautBTC already calculated how Bitcoin’s price could rise to $237,000 based on the imbalance between supply and demand. BTC rising to $207,000 by June will no doubt defy expectations, with analysts like Skybridge Capital CEO Anthony Scaramucci not expecting such a price surge until next year. 

Scaramuci had predicted that Bitcoin would rise to $170,000 18 months after the Halving event. Meanwhile, Tom Dunleavy, Partner and Chief Investment Officer (CIO) at MV Capital, took a conservative stance when he mentioned that Bitcoin could rise to as high as $100,000 this year. 

What Next For Bitcoin?

Bitcoin has cooled off following its rise to a new ATH of $69,000. As to the next move the flagship crypto could make, crypto analyst Satoshi Flipper suggested in an X post that Bitcoin could consolidate between $65,000 and $70,00 for a few weeks before breaking its ATH again. 

This aligns with Alex Thorn’s (Head of Research at Galaxy Digital) analysis, where he noted that BTC could follow a similar path to December 2020. Back then, BTC touched its prior ATH of $20,000, then traded 11.3% lower for the next 15 days before going on to “definitively” break its ATH.

At the time of writing, Bitcoin is trading at around $66,000, up in the last 24 hours, according to data from CoinMarketCap.