Crypto Expert Reveals Why Bitcoin Could Hit $200,000 By April

A crypto analyst has forecasted Bitcoin’s price to surge to unprecedented highs ahead of the 2024 Bitcoin halving event scheduled for April. The cryptocurrency has already been experiencing significant gains, surpassing its previous all-time high to trade above $70,000. 

Bitcoin’s Path To $200,000

In a recent X (formerly Twitter) post, crypto analyst, Gert van Lagen provided a compelling narrative supporting Bitcoin’s bullish trajectory leading up to the halving event in April 2024. 

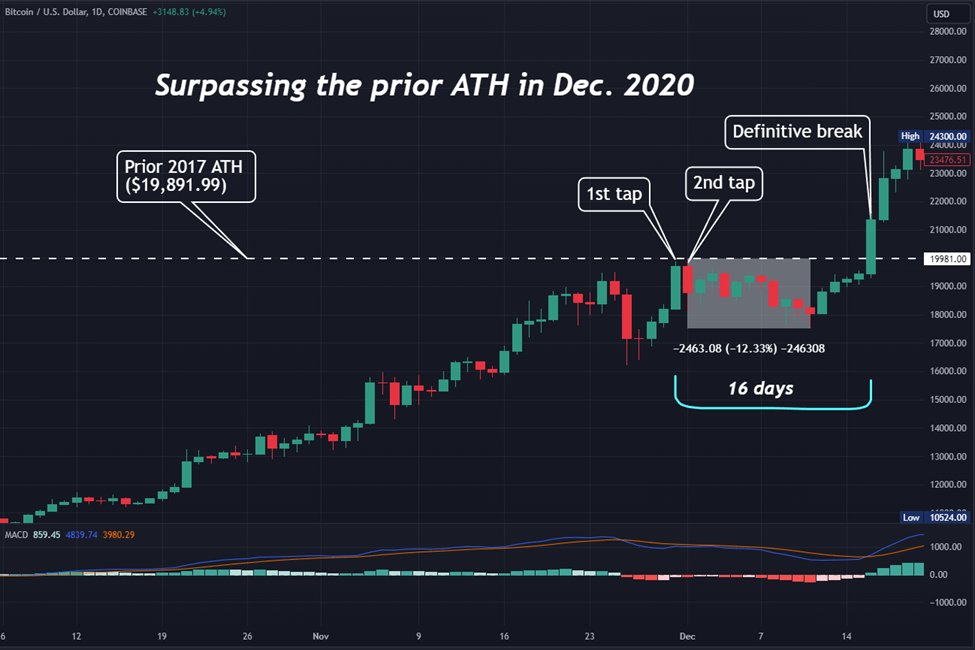
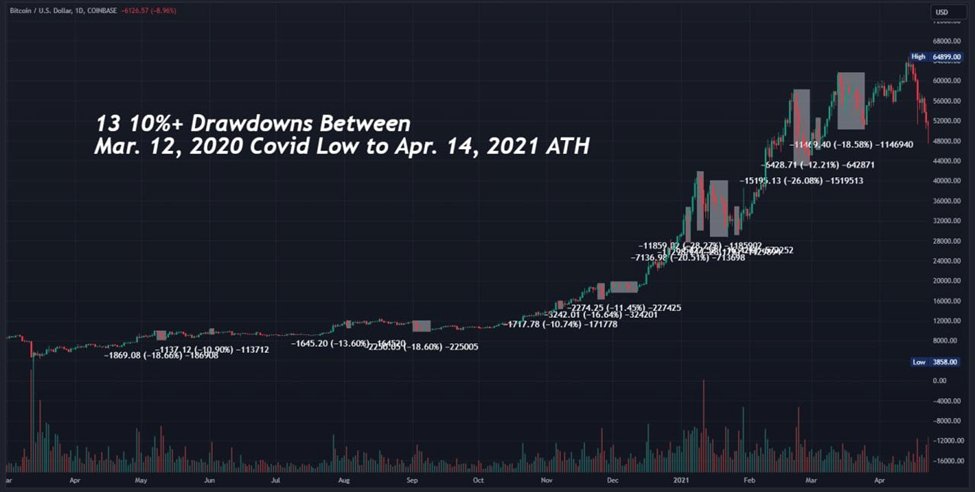
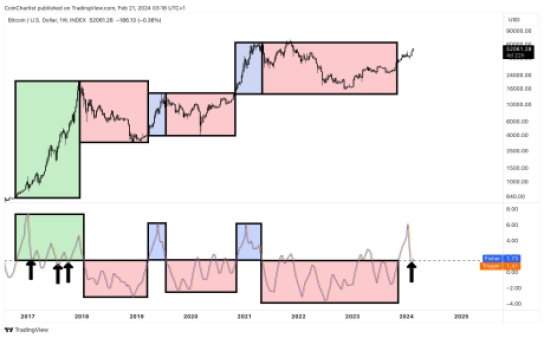
Sharing a price chart illustrating Bitcoin’s recent bullish movements, Lagen revealed that the cryptocurrency doubled in value within 10, 18 and 84 days following its surge to new all-time highs. As a result of this massive rallying trend, the analyst confidently expressed his belief that a move to $200,000 before the halving cycle in April is becoming more plausible. 

Traditionally, the Bitcoin halving marks an event where the rewards for mining new blocks are cut by half, leading to a subsequent reduction in the cryptocurrency’s supply and contributing to a sustainable increase in its value. The highly regarded four-year event is usually accompanied by a significant bull run for Bitcoin and other cryptocurrencies within the market. 

Contrary to historical patterns indicating that the Bitcoin bull run typically aligns with the halving event, the cryptocurrency has been experiencing unprecedented gains in anticipation of the halving, leading analysts to consider the possibility of an even larger price jump during the event. 

The cryptocurrency’s achievement of a new all-time high before the halving stands as an extraordinary occurrence, underscoring the immense demand and growing popularity of Bitcoin in the crypto space. 

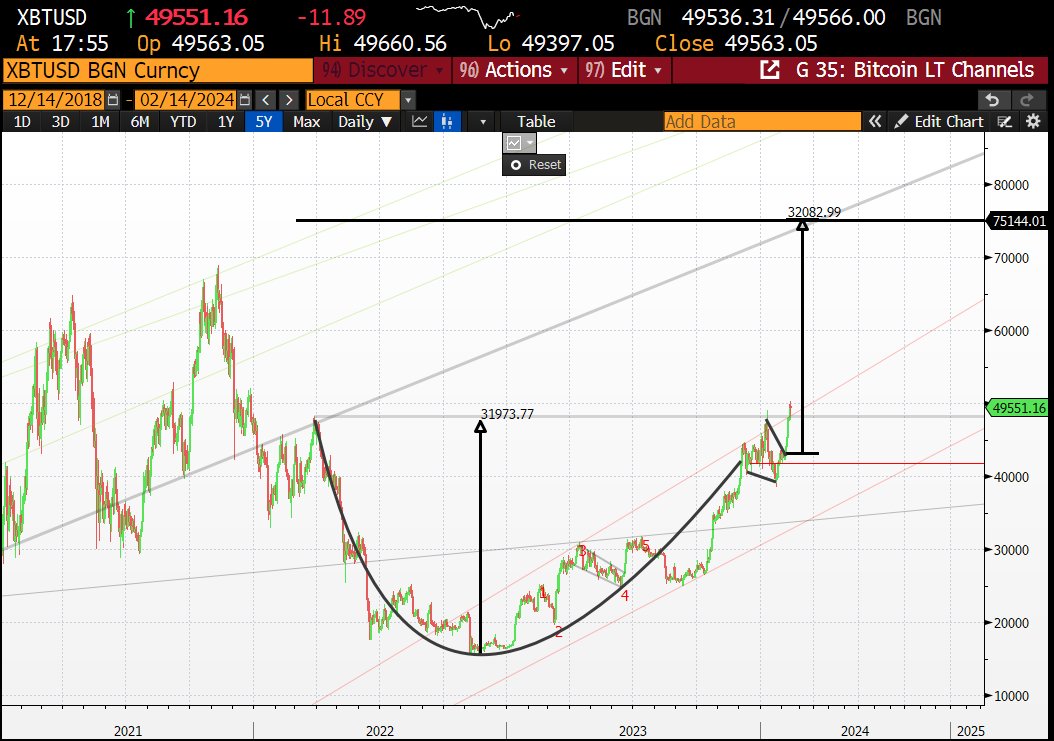
Including Lagen, other analysts have predicted bullish outcomes for Bitcoin ahead of the halving event. According to crypto analyst, “The Bitcoin Therapist,” on X, Bitcoin is expected to rise to $100,000 by April. Additionally, a steady rise to new all-time highs at $75,000 is expected to occur before the halving, as stated by another crypto analyst. 

Bitcoin Smashes Through $70,000 Barrier

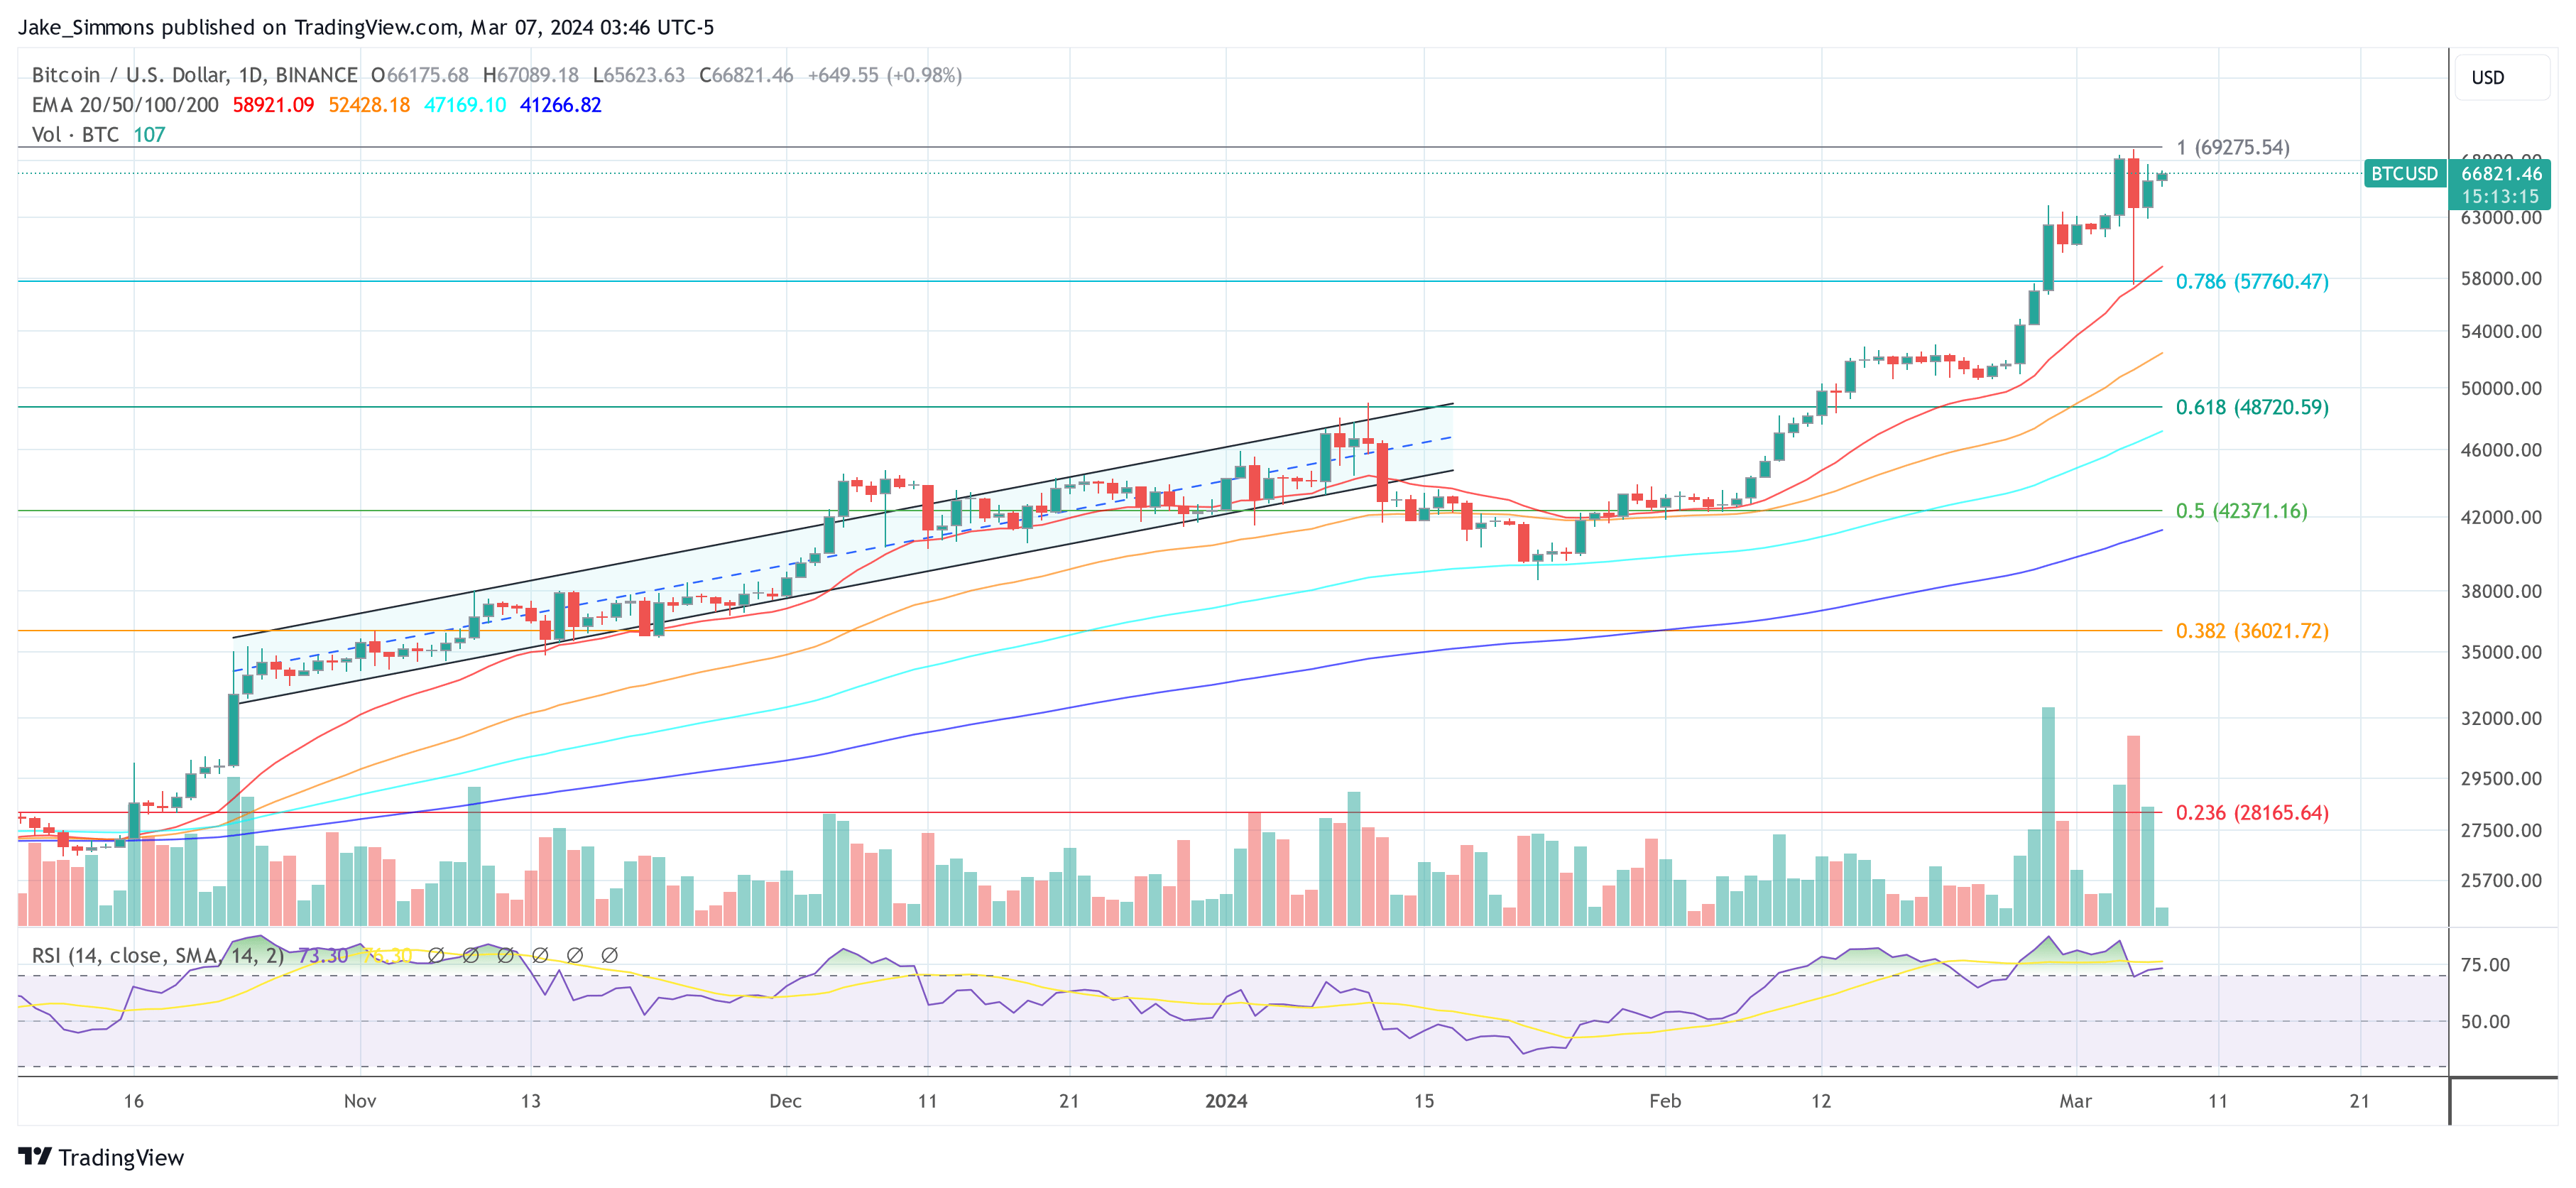
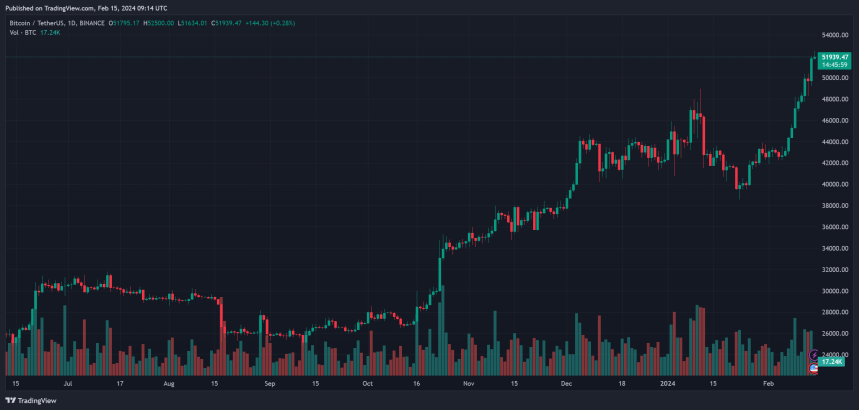
Following its previous surge to $70,000 on Friday, March 8, 2024, Bitcoin encountered a minor setback, retracting to a level just above $69,000. However, in the last 24 hours, the cryptocurrency has recorded an unprecedented surge, amassing approximately 2.68% and currently trading above the $71,000 price mark, according to CoinMarketCap.

This price increase marks a historic milestone for the cryptocurrency as it reaches an all-time high above $71,000 for the first time. As of this moment, Bitcoin is trading around $71,312, experiencing significant price fluctuations that have contributed to its recent gains. The cryptocurrency’s 24-hour trading volume is also up by 82.80%, underscoring the increasing demand and interest in the pioneering digital currency.

Bitcoin price chart from Tradingview.com

Crypto Analyst Says Bitcoin Is Heavily Undervalued Despite ATH, What’s The Fair Value?

Despite Bitcoin recently hitting a new all-time high (ATH) of over $70,000, crypto analyst Michaël van de Poppe believes that there is still more room for significant moves to the upside. Interestingly, he also expects that this bull cycle will be one like no other.

Bitcoin Still Heavily Undervalued

Michaël van de Poppe mentioned in an X (formerly Twitter) post that Bitcoin was still “heavily undervalued” despite hitting a new ATH. He added that the value is “way higher” and noted how the flagship crypto can help hedge against inflation and keep one’s purchasing power alive. Meanwhile, the crypto analyst believes there will be “way higher numbers” in this cycle.

Michaël van de Poppe had previously hinted at Bitcoin rising to as high as $150,000 in this bull run. Other analysts have also given similar price predictions, with the consensus that BTC will surely rise above $100,000. Other crypto analysts, including MacronautBTC, have even gone as far as predicting that Bitcoin could rise above $200,000. 

There is a growing belief that this bull cycle will be the mother of all past cycles, which could be the reason for such ambitious predictions. Moreover, this cycle has the Spot Bitcoin ETFs, something past bull runs didn’t have. These ETFs have ushered in more institutional demand for the flagship crypto, which has led to an overall increase in the demand for Bitcoin. 

Interestingly, NewsBTC previously reported that the demand for Bitcoin is significantly exceeding Miners’ supply. This development is coming at a time when miners’ rewards are set to be cut in half during the Bitcoin Halving. This would likely lead to more imbalance between the demand and supply curve, potentially leading to an exponential surge in Bitcoin’s price. 

BTC Still Has Enough Time To Hit New Highs 

Bitcoin hitting a new ATH of $70,000 is just the beginning of this bull run, as there is reason to believe this bullish momentum could run into next year. Crypto analyst Ali Martinez noted in an X post that Bitcoin has “consistently taken about 8 to 11 months to hit a market top” whenever it has shattered its previous ATH.   

With Bitcoin currently hitting new highs, the analyst added that historical patterns suggest that the next BTC market top “will be sometime between November 2024 and February 2025.” However,  Alex Thorn, Head of Research at Galaxy Digital, has warned that “bull markets are not straight lines up” and that sharp corrections should be expected along the way. 

At the time of writing, Bitcoin is trading at around $68,300, up over 2% in the last 24 hours according to data from CoinMarketCap. 

Bitcoin price chart from Tradingview.com

Here’s How Much Elon Musk’s Tesla And SpaceX Have Made From Their Bitcoin Holdings

A new report has revealed the total Bitcoin assets held by Elon Musk’s Tesla and SpaceX companies and how much profit they’re seeing so far.   

Tesla And SpaceX Bitcoin Holdings Unveiled

On Thursday, March 7, Arkham Intelligence, an AI-based blockchain analytics platform, revealed the Bitcoin holdings of SpaceX and Tesla, two companies co-founded by X (formerly Twitter) owner, Elon Musk. The comprehensive report also outlined Tesla’s BTC transactions spanning from 2021 to 2024.

According to Arkham, Tesla had purchased about $1.5 billion worth of BTC in January 2021. Subsequently, the automotive company initiated multiple transfers, opting to sell off its Bitcoin holdings valued at $272 million in the first quarter of 2021 and about $936 million in the second quarter of 2022.  

Arkham has claimed that the automotive company currently possesses a staggering 11,510 BTC, valued at $780 million. Furthermore, Tesla’s substantial Bitcoin holdings are reportedly spread across 68 wallet addresses. 

On the other hand, SpaceX, a private space exploration and technology company, currently holds about $8,290 BTC worth approximately $560 million. These assets are reportedly distributed across a total of 28 wallet addresses. 

The combined BTC holdings of these two companies place them in a league comparable to the BTC holdings of major financial institutions. Tesla has secured the third position among the largest Bitcoin holders, with MicroStrategy leading the list, possessing around 190,000 BTC worth over $8 billion. 

Despite the considerable amount of BTC held by Musk’s companies, the CEO has seemingly had a love-hate relationship with Bitcoin. Earlier in 2023, Bitcoin crashed below $25,000 after Musk’s SpaceX sold all its Bitcoin holdings. However, it seems the space company is showing more interest in BTC, as seen by its massive Bitcoin portfolio. 

Tesla May Be Buying More BTC

A crypto community member, identified as “Definalist” on X, has shared insights, suggesting that Tesla might be increasing its involvement in Bitcoin. Referring to Arkham Intelligence’s report of Tesla’s BTC holdings, Definalist disclosed Tesla’s acquisition of an additional 1,790 BTC. 

Definalist has revealed that in 2023, Tesla’s BTC balance sheet had held about 9,720 BTC. Fast forward to 2024, the automotive company’s portfolio has expanded to 11,510 BTC, revealing an unreported acquisition of an extra 1,790 BTC. 

This significant Bitcoin purchase could be attributed to the growing enthusiasm for the cryptocurrency, driven by its recent bullish momentum and massive price increases. At the time of writing, Bitcoin is trading at a price of $67,279, according to CoinMarketCap. The cryptocurrency previously surged to an all-time high of $69,200 on March, 5, after which it retraced to its current price level.

Bitcoin price chart from Tradingview.com

Bitcoin Price Forms Inverse Head And Shoulders Pattern, Eyes $76,000

Just below the all-time high of $69,000, the Bitcoin price has shown more volatility in recent days, only to now tread water around $67,000. But this boredom could soon be over. Following the recent price movements, a notable pattern has emerged on the Bitcoin (BTC) price chart, as recognized by the seasoned crypto analyst Josh Olszewicz.

Bitcoin Price Rallye To $76,000 Next?

An inverse head and shoulders (iH&S) pattern, often seen as a bullish indicator, has formed on the Bitcoin 1-hour chart, suggesting a potential upward price movement. This pattern, while admittedly imperfect as per Olszewicz, is considered tradeable in his view. “[The] pattern is definitely not perfect but still tradeable imo,” he remarked.

An Inverse Head and Shoulders (iH&S) pattern is a bullish reversal pattern in technical analysis, signaling a potential upward reversal in price trends. It consists of three troughs with the middle trough being the lowest, resembling the shape of a head and two shoulders, but flipped upside down.

Bitcoin inverse head and shoulders pattern

In this scenario, Bitcoin’s chart shows the formation with a head at approximately $59,000 and shoulders forming around the $65,000 and $65,700 mark. The pattern suggests that a bullish move is brewing. Traders often use iH&S patterns to identify potential buying opportunities, with entry points typically near the neckline breakout.

The analyst’s chart points to a neckline (dotted red line) slanting downward, intersecting with the right shoulder in the coming days. A breakout above this line is typically required to confirm the pattern. At the current price, Bitcoin is trading just below the neckline.

For traders eyeing potential targets, Olszewicz’s analysis projects an ambitious goal of $73,000 to $76,000, aligned with the Fibonacci extension levels of 1.618 ($72,610.59) and 2 ($75,776.31). These levels represent significant price points that Bitcoin might test if the pattern is confirmed with a solid breakout.

One element that could fortify the potential upward journey is a volume breakout, which the analyst has hinted at with a question mark. The volume indicator on the chart shows an increasing trend, but a decisive surge in volume is typically sought after to confirm an iH&S pattern.

Moreover, Olszewicz has marked a potential stop loss (SL) level with a dashed green line. This level around $65,680 serves as a risk management tool for traders should the pattern fail to realize the upward breakout.

At press time, BTC traded at $67,124.

Bitcoin price

Crypto Analyst Uses Historical Data To Show When The Bitcoin Price Will Reach $207,000

A crypto analyst has laid out a scenario where the Bitcoin price could rise above $200,000 by June. This is based on a historical occurrence that could play out again following BTC’s recent run above its previous all-time high (ATH).

How BTC Could Rise To $207,000 By June

The anonymous analyst behind the prominent crypto X (formerly Twitter) account, Bitcoin Archive, alluded to the 2021 bull run when Bitcoin’s price more than tripled in just 103 days after breaking the previous cycle’s ATH. That means Bitcoin could run to $207,000 by June if history repeats itself. 

Bearing the Bitcoin Halving event in mind, Bitcoin’s price tripling by June looks feasible. Bitcoin’s price has more than tripled 90 days after previous Halving events. Considering that Bitcoin surpassed its previous ATH even before this Halving, which is set to take place in April, the flagship crypto could also achieve this exponential price surge in record time this time around. 

This narrative is supported by the fact that Bitcoin’s demand continues to exceed its supply, and the supply will be further reduced when miners’ rewards are cut in half. Therefore, although ambitious, a price surge of such magnitude cannot be ruled out. 

Moreover, crypto analyst MacronautBTC already calculated how Bitcoin’s price could rise to $237,000 based on the imbalance between supply and demand. BTC rising to $207,000 by June will no doubt defy expectations, with analysts like Skybridge Capital CEO Anthony Scaramucci not expecting such a price surge until next year. 

Scaramuci had predicted that Bitcoin would rise to $170,000 18 months after the Halving event. Meanwhile, Tom Dunleavy, Partner and Chief Investment Officer (CIO) at MV Capital, took a conservative stance when he mentioned that Bitcoin could rise to as high as $100,000 this year. 

What Next For Bitcoin?

Bitcoin has cooled off following its rise to a new ATH of $69,000. As to the next move the flagship crypto could make, crypto analyst Satoshi Flipper suggested in an X post that Bitcoin could consolidate between $65,000 and $70,00 for a few weeks before breaking its ATH again. 

This aligns with Alex Thorn’s (Head of Research at Galaxy Digital) analysis, where he noted that BTC could follow a similar path to December 2020. Back then, BTC touched its prior ATH of $20,000, then traded 11.3% lower for the next 15 days before going on to “definitively” break its ATH.

At the time of writing, Bitcoin is trading at around $66,000, up in the last 24 hours, according to data from CoinMarketCap. 

The $69,000 Bitcoin Question: Expert Forecasts When Price Will Breakout

As Bitcoin hovers near its all-time high, industry experts and investors are keenly watching for signs of its next major move. Alex Thorn, the Head of Research at Galaxy, recently shared his perspective on the Bitcoin price trajectory and the factors influencing its potential breakout. In a detailed post on X (formerly Twitter), Thorn provided insights grounded in historical data and current market dynamics.

“We Will Climb the Wall of Worry,” Thorn proclaimed, setting the tone for his analysis. Bitcoin’s recent price action saw it reaching $69,324 on Coinbase on Tuesday, marking its first all-time high since November 10, 2021. This milestone came after an 846-day period of anticipation and speculation, only for the price to retract 14.3% to an intraday low of $59,224. This volatility, exacerbated by $400 million in long liquidations within an hour, underscores the cryptocurrency’s unpredictable nature.

Despite the pullback, Bitcoin recovered, trading back at $67,000. Thorn remarked, “Volatility is back, and it’s likely to remain as we scale the wall of worry.” He compared the current situation to 2020 when Bitcoin first approached its then all-time high of approximately $20,000 from December 2017.

BTC faced initial resistance, experiencing a 12.33% drop after tapping the barrier twice, before ultimately surging ahead. This pattern highlights the psychological and technical challenges at previous all-time highs, a natural resistance point for any asset class. A similar (second) move could be necessary this time to shake all sellers out of the market.

How Bitcoin surpassed its ATH in 2020

Describing the “Wall of Worry,” Thorn explained, “By my count, from Jan. 1, 2017 to the Dec. 17, 2017 all-time high of ~$20k, Bitcoin experienced 13 drawdowns of 12%+ (12 were 15%+, and 8 were 25%+). The same story played out in 2020. Between the Mar. 12, 2020 Covid low ($3858) and the Apr. 14. 2021 ATH of $64,899, there were 13 drawdowns of 10% or more (7 of them were 15% or more).”

Bitcoin drawdowns in a bull market

Notably, Bitcoin already had two 15%+ retracements since the spot ETFs launched on January 11. This week was the second one, the first major drawdown was directly after the ETF launch, with price plunging roughly 20%.

Why Bitcoin Is Just Getting Started

In his analysis, Thorn also touched upon the role of ‘old coins’ or long-held Bitcoin in shaping market movements. “Some old coins did revive and probably sell, possibly helping to create the intraday top,” he explained, pointing to blockchain data that indicated movement of coins mined as far back as 2010. This shift from old to new hands is characteristic of bull markets in Bitcoin, facilitating its broader distribution and acceptance.

Highlighting the significance of market sentiment and investment flows, Thorn noted, “And Tuesday was the Bitcoin ETFs largest ever day of inflows and second largest day of net inflows (+$648m) since DAY 1.” This impressive influx of capital into Bitcoin ETFs underscores the growing interest and confidence in the cryptocurrency, even amidst volatility.

Thorn remains bullish on Bitcoin’s future, suggesting that the current price dynamics are typical of the cryptocurrency’s bull markets, known for their non-linear progression and numerous corrections. He underscored the resilience and potential for growth despite the hurdles, stating, “nothing about yesterday’s price action makes me think we aren’t going higher.”

In conclusion, Thorn’s analysis provides a nuanced view of Bitcoin’s journey towards breaking its all-time high. By comparing current events with past market behaviors, Thorn offers a compelling case for Bitcoin’s continued ascent, but after a potential phase of consolidation with several taps of the all-time high before a definitive breakout. “Buckle up, folks. We are still just getting started,” he advises.

At press time, BTC stood at $66,821.

Bitcoin price

Bitcoin Will Reach A New All-Time High This Week, Matrixport Head Of Research Says

Bitcoin saw an incredible month in February, adding over $18,000 to its value in a single month. This outperformance has now carried on into the month of March, which has seen the Bitcoin price cross the $65,000 mark for the first time since 2021. As BTC trades in the green, expectations remain that the performance will continue.

Bitcoin Shows Strong Fundamentals

In a new report shared with NewsBTC via email, the head of research at Matrixport, Markus Thielen, put forward that the Bitcoin price was headed for another all-time high this week. This report highlighted the BTC price performance over the last year, as well as in February, in which the price rose a total of $18,615 in a single month. Additionally, the analyst pointed out that despite the slowdown in Bitcoin Spot ETFs that were seen toward the end of February, it hasn’t affected BTC’s bullishness by much.

The crypto analyst explains that institutional buying is not just happening in the United States either. There has also been a large uptick in buying volume across other countries, including the likes of Korea where volumes have reached near $8 billion for five consecutive days. Interestingly, the buying is not just limited to Bitcoin either as there are also inflows into altcoins and meme coins.

Furthermore, the anticipation of Hong Kong launching its own Spot Bitcoin ETF, as well as BlackRock taking the plunge and launching a Bitcoin ETF in Brazil, also proves that there is a lot of demand. So despite the decreased inflows that were seen last week, Thielen explains that if Grayscale’s outflows keep dropping, reaching between $0-$100 million, then he expects further rally for the Bitcoin price.

Thielen also pointed out that the Untied States debt is growing exponentially and Bitcoin now offers better macro upside compared to gold. This plays into the bullish potential of BTC going forth.

“ Previously we have shown that 30-40% of the Bitcoin ETF inflows appear to come out of Gold ETFs and with $80bn of assets-under-management, those re-allocation flows can continue. We have also shown numerous times that Bitcoin has become a better macro asset than Gold as Bitcoin’s reaction function towards changes in interest rate expectations, announcement of wars/conflicts, etc., has become superior (we backtested this).”

BTC Price Headed For New All-Time High

Among the factors driving the Bitcoin price identified by the analyst was a significant decrease in the amount of over-the-counter (OTC) BTC available for large institutions. Spot Bitcoin issuers such as BlackRock tend to utilize these OTC desks for purchases in order to reduce the impact of their buying on the price. However, these OTC sellers have reported that their balances have dropped 80% in the last year from around 10,000 BTC to less than 2,000 BTC.

Thielen also points out that the same trend is seen in exchanges where balances have declined across trading platforms such as Binance and Coinbase. Both of these, which are currently the Bitcoin trading powerhouses of the world, saw a total of 48,000 BTC leave their balances in a month.

Given these developments, the crypto analyst explains that investors are not price-sensitive at this time. So, the expectation for this week is that Bitcoin makes a new all-time high. If this happens, then the market could see BTC tap $70,000 this week.

Bitcoin price chart from Tradingview.com

Crypto Expert Reveals Why Bitcoin Can Rise To $400,000

February was undoubtedly an amazing month for Bitcoin, with the cryptocurrency going on a 39% surge to cross over $60,000. Notably, price history has shown this is the second most profitable February in the history of Bitcoin and the most profitable February in 11 years. 

Indeed, many market players have anticipated this price surge to continue throughout 2024 as the next Bitcoin halving approaches. According to an analysis from trading expert Peter Brandt, the price of BTC is set to skyrocket to $400,000 after the next halving.

Crypto Expert Peter Brandt Predicts Bullish BTC Price Points After Halving

Bitcoin halvings, which slashes the mining reward for miners into two, are known to trigger massive bull runs before and after they are completed. Indeed, the pre-halving bull run seems to have repeated itself, as Bitcoin has jumped over multiple resistance levels since the beginning of January and is now nearing its all-time high of $69,000, which it reached in November 2021.

Brandt’s analysis is majorly based on gains after past halvings as a percentage of gains before halvings. Consequently, the analyst projected past price behavior into the future after April’s halving is completed. 

Per his analysis, BTC’S current cycle reached its low in November 2022 and is now at 75 bars (weekly bars). If the bull trend extends 75 bars after the next halving, a price high of $150,000 is estimated to occur in early October 2025. 

Brandt’s analysis also pointed out three different scenarios that occurred after the last three halvings. After the first halving in 2012, Bitcoin went on a 5x gain as a percentage of its pre-halving gains. If the same were to happen after 2024’s halving, Bitcoin could reach $275,000. 

Similarly, 2016’s halving saw Bitcoin going on an 8x gain of its pre-halving gains. If Bitcoin were to go on a similar 8x route, it could reach as high as $400,000 before the next market phase. Lastly, 2020’s halving produced a modest 2x return of its pre-halving gains. A 2x repeat applied to a BTC price of $50,000 would see the crypto reaching $100,000 at the end of the current market phase. 

Bitcoin Set To Keep Shining

At the time of writing, Bitcoin is trading at $62,600, up by 21.25% in the past seven days. From a technical perspective, Bitcoin looks prime to continue on its bull run in the current market cycle with virtually no resistance

On-chain fundamentals point to increased accumulation from traders. Data shows that even short-term holding whales are now sitting on over $7.3 billion in unrealized profit, but they still continue to hold. If this bullish sentiment continues, we could see Bitcoin reaching a new all-time high in March.

Bitcoin price chart from Tradingview.com

Bitwise CEO Says Bitcoin At $250,000 Is Closer Than You Think

Hunter Horsley, the Chief Executive Officer (CEO) of crypto index fund manager, Bitwise, has stayed highly optimistic about the Bitcoin bullish outlook, predicting that the cryptocurrency will witness a rise to $250,000 sooner than most think.

BTC’S Road To $250,000

In a recent X (formerly Twitter) post on Wednesday, Horsley made a bold prediction about Bitcoin, foreseeing the cryptocurrency rising to new all-time highs never seen before. The CEO has stated that BTC could reach $250,000, jumping over four times its current price above $62,000. 

Furthermore, Horsley has expressed his belief that BTC could rival gold in the future. He anticipates that the fast-rising cryptocurrency would “eat into gold’s Total Addressable Market (TAM) faster than people expect.”

Highlighting Bitcoin’s formidable potential in relation to hold, on Wednesday, February 28, Spot Bitcoin ETFs dominated Gold ETFs in the market, with over $578 million flowing into Spot Bitcoin ETFs while gold ETFs experienced outflows of $17 million. These substantial inflows underscore the rising demand and potential superiority of Spot Bitcoin ETFs over gold ETFs

The Bitwise CEO has also revealed that Spot Bitcoin ETFs were BTC’S Initial Public Offering (IPO) moment. Consequently, these investment assets have enhanced BTC’S accessibility for both institutional and retail investors, increasing its exposure and propelling the market value forward by tenfold. 

While Horsley has not provided a specific timeline for his $250,000 Bitcoin prediction, the CEO has maintained a long-term bullish outlook for the cryptocurrency. He has also emphasized the need to invest in BTC, stating that “waiting was costly” and yesterday’s price should serve as a reminder to seize any opportunity to purchase Bitcoin.  

Bitcoin Shows No Signs Of Slowing Down

According to Horsley, Bitcoin is showing no signs of stopping its upward momentum anytime soon. The Bitwise CEO has revealed that the price of the cryptocurrency is likely to accelerate rather than slow down. 

At the time of writing, BTC is trading at a price of $62,142, reflecting a substantial 8.77% increase in just 24 hours. At one point yesterday, the cryptocurrency was trading above $57,000. However, after achieving unprecedented gains, Bitcoin has successfully crossed the coveted $60,000 price mark and is rapidly approaching its overall all-time high of $68,789 in November 2021. 

Horsley has disclosed that this rapid rise in Bitcoin’s price is largely attributed to the success of the Spot Bitcoin ETFs. He has highlighted the possibility of the entire United States capital markets investing in Spot Bitcoin ETFs for the first time, providing a massive opportunity to boost Bitcoin’s adoption and increase the value of the cryptocurrency.

Bitcoin price chart from Tradingview.com

Bitcoin Crosses $59,000 In Surprise Pre-Halving Rally

The Bitcoin price has now successfully crossed the $59,000 level after an incredibly bullish month of February. The market leader has also barreled ahead of all expectations during this time as well, continuing to rally at a time when prices are expected to crash ahead of the next halving.

Institutional Investors Drive Bitcoin Price Higher

One of the major drivers behind the Bitcoin performance over the last day has been institutional investors. These investors have continued to take advantage of the opportunities provided by the Bitcoin Spot ETFs approved by the Securities and Exchange Commission (SEC) in January.

While there have been outflows from the Grayscale Bitcoin Trust due to concerns about high fees, the inflows have not slowed. On Tuesday, Bloomberg Analyst James Seyffart revealed that Spot ETF inflows rose once again, to cross $400 million in a single day.

In the same vein, the trading volumes have been on the rise. With demand soaring, volumes crossed $2 billion on Tuesday and it is the second time in a month that it has crossed this figure. This rise in both inflows and trading volumes shows a willingness among institutional investors to take positions in Bitcoin.

Fidelity Investments, one of the issues of the many Spot Bitcoin ETFs available for trading in the market, also recently encouraged investors to put a small portion of their portfolios in Bitcoin. According to the asset manager, a portfolio allocation of 1-3% in Bitcoin is ideal at this point.

Now, while a 1-3% allocation may seem small to the average investor, it is quite large when it comes to institutional investing. These portfolios are often made up of billions of dollars, and even a 1-3% allocation could work out to hundreds of millions of dollars being funneled into Bitcoin.

BTC Dominance Not Budging

While the price of Bitcoin has rallied in the last week, expectations are that Bitcoin will begin to consolidate and then give way to altcoins. However, the BTC dominance over the crypto market remains quite high, suggesting that the time for altcoins may not be here yet.

Presently, the BTC dominance is sitting at 54.1% after seeing a local peak of 54.4%.  This shows that Bitcoin is still leading the entire market by a large margin, and until this dominance subsides, Bitcoin will continue to lead the rally while altcoins lag behind.

For now, the bulls are focusing on maintaining support at $59,000, giving it a bounce point toward $60,000. With the previous all-time high at $69,000, the BTC price needs a less than 20% move from here to reach a new all-time high.

Bitcoin price chart from Tradingview.com

Expert Predicts Bitcoin At $750,000 As Fidelity Advises 1-3% Allocation

In a major shift within the financial industry, Fidelity Investments, with its colossal $12.6 trillion in assets under administration, is now recommending that the traditional 60/40 portfolio model should evolve to include a 1-3% allocation to crypto, specifically through its spot Bitcoin ETF (FBTC). This groundbreaking move is not just a nod to the burgeoning crypto market but a potential catalyst for unprecedented demand, potentially channeling hundreds of billions of dollars into Bitcoin.

Bitcoin allocation in 60/40 portfolio

Matt Ballensweig, Head of Go Network at BitGo, took to X (formerly Twitter) to express his anticipation, stating, “I’ve said this since the day of ETF approval – now that Pandora’s box has been opened, the multi-trillion dollar asset managers will sell BTC and crypto through their massive distribution channels for us. Fidelity now creates blueprint portfolios with 1-3% crypto.”

Echoing this sentiment, Will Clemente III, a renowned analyst, remarked on the potential ripple effects of Fidelity’s recommendation. “Fidelity now recommending a 1-3% crypto allocation in your portfolio. Gateway drug. What happens when that 1-3% becomes 3-6%? Slowly then suddenly,” Clemente noted, highlighting the potential for growth in crypto allocation.

What This Could Mean For Bitcoin Price

Adam Cochran, a partner at CEHV, further elaborated on the implications of Fidelity’s move for Bitcoin’s adoption and price trajectory. In a detailed analysis shared on X, Cochran laid out an ambitious future where the inclusion of crypto in traditional portfolios could lead to a substantial reevaluation of Bitcoin’s value. “How fucking wild is this to see. 60/40 portfolios are now 59/39/2,” Cochran began, underlining the historic milestone of crypto becoming a core asset class.

Cochran compares the adoption rates of the internet to cryptocurrency, stating, “Hell, the internet was 30 years in the making and didn’t reach 10m users till 1995. But the most non-conservative estimates put crypto ownership at 450M worldwide (conservative is more like 200M) that’s like the internet in 2001.”

He highlights the outsized economic impact of digital advancements, “Today the internet has somewhere around 5.5B users – 12x what it did in 2001. But according to BEA, the impact of the digital economy has been exponentially outsized with each year of growth.” By drawing this parallel, Cochran sets the stage for a crypto market that could see exponential growth in value and influence.

Cochran’s approach to calculating Bitcoin’s future valuation involves analyzing the potential influx of funds from traditional investments. “If that follows the change to 59/39/2, you’re looking at $1.6T in new buying… Given the current market is $2.24 trillion total marketcap… we get a cash to value rate of 9.3%.”

The core of Cochran’s analysis lies in his valuation prediction, where he states, “Prorata between coins at their current ratios and that’s $748,500 BTC and $43,635 ETH in raw spot buying. But since we know notional causes things to run, and we’ve got things like ETH’s yield demand and burn, we’re usually several multiples above the price of our raw spot demand.”

Cochran’s conclusion reflects a strong belief in the transformative potential of cryptocurrencies within traditional investment portfolios. “At the end of the day, even gold hasn’t broken into the 60/40 portfolio in a meaningful way, so I think blowing past the $12T mcap of gold by a good multiple over time is a no-brainer.”

At press time, BTC traded at $57,175.

Bitcoin price

Crypto Platform Which Predicted Bitcoin To Reach $50,000 Has Released A New Target

Crypto financial services platform Matrixport has made another bullish prediction for the Bitcoin price. This time, they predicted that Bitcoin would rise to $63,000, including when the flagship crypto token hits this target. Matrixport had previously predicted that BTC would rise to $50,000 by the end of January, although that didn’t happen. 

Bitcoin Will Rise to $63,000 By March!

Matrixport mentioned in their latest report that BTC will rise to $63,000 by March this year. Although this price level seems ambitious, the crypto platform noted that it is achievable with certain factors in mind. One includes the Spot Bitcoin ETFs, which were approved over a month ago.  

These Bitcoin ETFs have so far contributed largely to BTC’s resurgence (even before they were approved). They have continued to record an impressive demand, which has led to a significant accumulation of BTC by the fund issuers. Interestingly, Bitcoin maximalist Samson Mow recently argued that BTC would have been down as much as 20% if not for these ETFs. 

Meanwhile, Trading firm QCP Capital shares similar sentiments with Matrixport as they noted in a previous report how Bitcoin could rise to as high as $69,000 thanks to these Spot Bitcoin ETFs. Then, they stated that BTC revisiting its all-time high (ATH) will depend on the “genuine flow the actual ETF will bring in the first few weeks of trading.”

The Spot Bitcoin ETFs have not disappointed, recording $2.8 billion in net inflows during the first 21 trading days. Bitcoinist also reported how these funds saw $2.2 billion in inflows last week. 

Other Catalysts That Will Contribute To Bitcoin’s Rise To $63,000

Matrixport also mentioned the Bitcoin Halving, interest rate decisions, and the US presidential election as factors that could make BTC rise to $63,000. The Bitcoin Halving, expected to take place in April, continues to be projected as an event that could cause Bitcoin’s price to increase exponentially. 

In Matrixport’s case, they expect that the hopium around the event will cause BTC to rise to $63,000 even before it occurs. It is not uncommon for the flagship crypto token to get priced in ahead of a much-anticipated event like the Bitcoin Halving. Moreover, Bitcoin historically makes significant gains pre-halving. 

Furthermore, the Federal Reserve is expected to cut interest rates as inflation cools. However, it is uncertain how much this could impact Bitcoin’s rise to $63,000, considering that the Fed’s minutes showed they are still cautious about cutting rates too quickly (at least not as soon as March).

Matrixport also stated that the US presidential election could influence Bitcoin’s price. Just like the interest rate decision, it is unlikely that the election, slated for November 2024, will impact Bitcoin’s trajectory in the short term. 

Bitcoin price chart from Tradingview.com

Elliot Wave Theory Predicts Bitcoin Bottom And Top, Here Are The Targets

Bitcoin looks to be stuck in a consolidation zone between $50,000 and $52,000, with neither the bulls nor the bears succeeding in completely taking control of the trend. This performance has sparked a number of speculations on whether the BTC price has finally found a local top. One of those who have speculated on the price direction is crypto analyst Alan Santana, who has used the Elliot Wave Theory to predict where the price of the cryptocurrency might be headed next.

Elliot Wave Points To Correction To $31,800

In the analysis shared by Alan Santana on TradingView, the Elliot Wave theory could point out the direction that the Bitcoin price could be headed next. The theory, which consists of five waves, has so far completed three waves, with the fourth wave expected to happen soon.

Given that the third wave is very bullish and the price has risen so fast, the fourth wave is expected to be more bearish. As Santana explains, this fourth wave points toward an upcoming correction. They also reveal that their analysis included Elliot’s Law of Alternation, and applying it to this scenario, the fourth wave is bearish, but would not go as low as the second wave.

Bitcoin price chart from Tradingview.com

Once this fourth wave moves into action, the Bitcoin price is expected to see a sharp correction. At the low end of this correction, though, is the $31,800 level, the analyst believes. So, in this scenario, there will be a return to the $20,000s before Bitcoin resumes its next leg up.

“This wave four of a higher degree cannot enter the territory of wave two, which puts the lowest price possible for the upcoming correction at $31,805 based on Elliot Wave Theory,” Santana said. He further added that: “Just as wave three would lead to a correction (wave four), wave four invariable leads to another impulse; the final and fifth wave of the higher degree.”

Bitcoin Top At $138,000

Not only does the Elliot Wave theory points toward a possible bottom, it also gives an idea for where the Bitcoin top might lie in the fifth wave. The crypto analyst uses one of the two Wave Principle methods to forecast this price, which takes into account the peak of the third wave and then uses that to give the peak of the fifth wave.

So far, the local top of this third wave looks to be $52,985, where Bitcoin peaked earlier this week. Since the Wave Principle says that the peak of Wave 5 would be three times higher than that of Wave 3, the analyst multiples $59,985 by 3, which gives a cycle top of $138,714.

As for when this peak will roll around, Santana explains that the whole thing could play out by 2025, which is when the peak would take place. “So the potential for the final impulse or fifth wave based on the Elliot Wave Theory system, amounts to $138,714. This can happen sometime in 2025,” the analyst stated.

Bitcoin price chart from Tradingview.com

Fundstrat Exec Predicts Bitcoin Will Reach $150,000, Here’s When

Tom Lee, Managing Partner and Head of Research at Fundstrat Global Advisors, recently commented on the future trajectory of Bitcoin. He also mentioned when the flagship crypto token could hit this particular price level. 

Bitcoin To Rise To $150,000 This Year

Lee mentioned during an appearance on CNBC’s “Squawk Box” that Bitcoin could rise to as high as $150,000 this year. His belief that BTC could rise to this price level is due to the fact that demand is improving with the Spot Bitcoin ETFs. These funds are known to have achieved significant success since launching, something which has positively impacted Bitcoin’s price. 

Lee alluded to the Bitcoin Halving as another factor that could contribute to Bitcoin’s rise to $150,000. He specifically noted how the crypto token’s supply is going to shrink once the Halving event takes place. Interestingly, industry expert Anthony Pompliano recently highlighted how the demand for BTC was outpacing its supply. 

This trend is expected to continue once the Halving takes place, as the amount of BTC mined daily will drastically reduce. Meanwhile, Spot Bitcoin ETFs and other institutional investors are expected to keep stacking up the crypto token without any hesitation.

Lee also noted that a monetary easing, which is expected this year, would be favorable for a risk asset like Bitcoin. With inflation cooling off, the Federal Reserve is projected to cut down on interest. This will no doubt provide a bullish narrative for Bitcoin as investors are expected to double down on their investment in the crypto token once this happens. 

BTC Still Headed For $500,000

Tom Lee had predicted during an appeearnce on Squawk Box in January this year that BTC would rise to $500,000 in the next five years. He once again reaffirmed this prediction during his most recent appearance on CNBC. According to him, “Bitcoin is sound money, and it is proving to be useful,” which makes this price level attainable. 

Elaborating on how Bitcoin is useful, he stated that the crypto token has been a great store of value and also a good risk asset. He added that BTC is “incredibly secure” as there has been an issue of any fraudulent entry on the blockchain since its inception. The same cannot be said of banking institutions, which Lee noted have a lot of fraudulent transactions. 

When quizzed about how Bitcoin is used for nefarious activities, he highlighted how the Dollar is used for a large percentage of crimes that take place, and no one questions its utility.

At the time of writing, Bitcoin is trading at around $51,800, up in the last 24 hours, according to data from CoinMarketCap. 

Bitcoin price chart from Tradingview.com

Galaxy CEO Cautions Bitcoin May Fall To $42,000 Ahead Of Major Rally

In an exclusive interview with CNBC’s ‘Squawk Box’, Mike Novogratz, CEO of Galaxy Digital, provided an in-depth analysis of the current state and future trajectory of Bitcoin amidst a rapidly evolving financial landscape. The conversation spanned a variety of topics, including the recent surge in Bitcoin prices following the approval of spot Bitcoin ETFs and the impact of the Federal Reserve’s monetary policy on cryptocurrency markets.

Bitcoin Amid Market Consolidation And Institutional Adoption

Opening the discussion, Novogratz touched on the remarkable rally Bitcoin has experienced, while also suggesting a potential consolidation phase. “We’ve come a long way fast, both in US stocks and in crypto… It wouldn’t surprise me if there’s some consolidation,” he stated.

Despite this, he emphasized the significant milestone achieved with the opening of the institutional and Retail Investment Advisor (RIA) channels to Bitcoin, particularly through ETFs. “We’ve got baby boomers who own most of the wealth in America, and they’re getting their first easy access to Bitcoin… And I don’t think that’s going to stop,” Novogratz elaborated, underlining the transformative impact of ETFs on Bitcoin accessibility.

When probed about the pace at which financial advisors could start recommending Bitcoin, Novogratz offered an optimistic forecast: “I would tell you at least double in six months.” He attributed this to both demand from clients and the inevitable adaptation of large platforms. “Their customers are calling and bitching at them and saying, we want to buy Bitcoin with you,” he quoted, highlighting the grassroots demand driving institutional platforms towards crypto adoption.

Addressing potential short-term price movements, Novogratz candidly acknowledged the possibility of a downturn. “It could be some regulatory kerfuffle, it could just be the market got a little long and you get people scared,” he speculated, pinpointing a price range of “$45,000… $42,000” as the potential downside. This acknowledgment of volatility underscores his realistic view of the crypto market’s susceptibility to external pressures and internal dynamics.

BTC Price Targets

Looking ahead, Novogratz responded to Tom Lee’s prediction of Bitcoin reaching $150,000 by year’s end with cautious optimism. While hesitant to commit to a specific number, he concurred that Bitcoin is likely to retest its all-time highs, emphasizing the market’s momentum when it attracts new buyers.

“You know, when markets get new buyers and start breaking out, it’s hard to have a price prediction,” he remarked, suggesting that surpassing the $69,000 mark could open the door to unprecedented price levels like $125,000 to $150,000, contingent on broader economic conditions such as the Federal Reserve’s interest rate policies.

Delving into Bitcoin’s correlation with the macroeconomic environment, Novogratz presented a nuanced perspective. He acknowledged Bitcoin’s dual identity as both a macro asset and a nascent technology in an adoption cycle.

On the topic of Bitcoin’s correlation with broader economic indicators, Novogratz highlighted the dual narrative that has come to define Bitcoin’s market behavior. “It’s a macro asset…And the second, we’re early on in the life cycle, so there’s an adoption cycle,” he pointed out.

Thus, he emphasized the unique position of Bitcoin at the intersection of a burgeoning asset class and a macroeconomic hedge. He added, “Right now, this is all adoption. This is new buyers coming in and being told the big-picture story that you need to have this in your portfolio.”

Bitcoin price

Billionaire Tim Draper Bullish On Bitcoin As It Will Surpass Traditional Currencies, Here’s Why

Tim Draper, founder of Draper Associates and Billionaire venture capitalist, recently shared his thoughts on Bitcoin and the flagship crypto token’s potential to revolutionize the global economy. Specifically, Draper highlighted how BTC could replace the Dollar and other fiat currencies soon enough.

BTC To Replace The US Dollar

Draper mentioned during an interview on Bloomberg that the time is coming when people “won’t want the Dollars” anymore. He believes this would happen as a result of everyone having a preference for the flagship crypto token. When that happens, the billionaire says that he will be able to his “food, clothing, and shelter all in Bitcoin.”

Draper suggested that this revolution was going to occur from a massive bank run, similar to what occurred with the Confederate dollar after the US Civil War ended in 1864. He also likened Bitcoin potentially replacing the Dollar to what happened with the Greek Drachma and the run on the French Franc after France adopted the Euro. 

Meanwhile, the billionaire alluded to how BTC already has an edge over some fiat currencies. He gave an example of how Argentines and Nigerians don’t trust the Peso and Naira, respectively and would rather prefer to do business in Bitcoin. 

Bitcoinist previously reported how Bitcoin hit an all-time high in Argentina and Nigeria. The inflationary pressure that those countries are experiencing has caused their currencies to devalue, with locals seeing Bitcoin as the go-to alternative to hedge against this inflation. With the US also facing its economic crisis, Draper’s prediction of Bitcoin replacing the Dollar may not be far from happening. 

Bitcoin price chart from Tradingview.com

Why Bitcoin Didn’t Rise To $250,000 In 2022

During the interview, Tim Draper also explained why his Bitcoin prediction of $250,000 didn’t happen. The billionaire had in 2018 predicted that the crypto token was going to rise to that price level by 2022. Draper looked to have blamed the US government for this not happening, stating that he didn’t expect them to have been “paranoid” about Bitcoin. 

This paranoia is probably why the government has its reservations about the flagship crypto token rather than accepting it and taxing profits made on it, just like Draper expected. However, this paranoia looks to be in the past as the billionaire claims that the US has realized that “Bitcoin is actually better for everyone.”

Interestingly, Draper is not backing down on his $250,000 prediction, stating now that Bitcoin will hit this price level in 2025. His confidence might come from the fact that BTC looks to be more accepted by the US authorities, especially following the approval of the Spot Bitcoin ETFs, which are recoding huge demand

Bitcoin Fisher Transform Reaches Critical Level Not Seen Since 2021, What This Means

The Bitcoin price has had a rocky start to the new week after losing its footing above $52,000 on Tuesday. However, all hope is not lost, as indicators still point to a continuation of this trend. Crypto analyst Tony The Bull has identified an important trend in the Bitcoin chart which could trigger a continuation of the trend back above $52,000.

Bitcoin 1-Week Fisher Transform At Crucial Point

In an analysis posted on X (formerly Twitter), the crypto analyst shared a chart that showed the Bitcoin Fisher Transform in comparison to price. Most importantly, the chart showed the 1-week Fisher Transform and how it has moved since 2017.

The analysis shows some similarities between the current trend and the trends seen in 2017. A similar trend was also seen in 2019 and 2021, where the Fisher Transform rose rapidly before falling. But the importance of this trend lies in where the Fisher Transform heads next from here.

The current important level is the 1.5 Standard Deviation, which has been a crucial point whenever this trend has occurred. Now, if the Fisher Transform is able to stay above this level, it is bullish for the price. However if it falls below this standard deviation, it is very bearish for the price.

Bitcoin

“This is a pivotal area based on historical price action and its exhibiting 2017-like behavior not seen in 2019 or 2021,” the crypto analyst explains. “Below it tends to incite bearish trends, while holding above gives bulls extra vigor.”

Bitcoin price chart from Tradingview.com

Bears And Bulls Vie For Control Over BTC Price

The interest in the next direction of the Bitcoin price has seen bulls and bears lock horns over which camp will reclaim control of BTC. This has seen the price of the digital asset fluctuate wildly over the last few days, going from $53,000 to below $51,000, before bouncing back up once again in the early hours of Wednesday.

This tug-of-war continues to hold the price of Bitcoin down, but investor sentiment seems to be climbing even through this. According to the Bitcoin Fear & Greed Index, investor sentiment has reached Extreme Greed for the first time in one year.

Historically, the index going into extreme greed has signaled the top of the market, with prices trending downward not too long after. However, Bitcoin is still seeing positive indicators, with its trading volume rising more than 40% in the last 24 hours alone.

Finance Expert Predicts Bitcoin Will Touch $100,000 Soon, Here’s When

Renowned finance author Robert Kiyosaki has once again made a bullish price prediction for the flagship cryptocurrency, Bitcoin. This time, he predicts that Bitcoin will hit $100,000 and mentions when exactly this will happen. 

When Bitcoin Will Hit $100,000

Kiyosaki mentioned in an X (formerly Twitter) post that Bitcoin will hit $100,000 by June 2024. However, he didn’t mention what will propel this massive price surge. The finance expert is known to be a huge advocate of the foremost crypto token and, at different times, given his opinion on its potential. 

Before now, Kiyosaki, who authored the best-selling book ‘Rich Dad, Poor Dad,’ said that Bitcoin was going to rise to $150,000 and singled out the Spot Bitcoin ETFs as what would drive this parabolic move. He had also once identified the Bitcoin Halving as being pivotal for BTC’s growth. 

Interestingly, the author is believed to be a ‘crypto OG’ as he previously shared his excitement about investing in BTC “years ago.” He also continues to urge others to do the same, claiming that it is the way to avoid becoming poorer due to the actions of the government. Kiyosaki doesn’t shy away from criticizing the government and recently went as far as branding the Federal Reserve “a criminal organization.”

According to him, the “Fed has destroyed the economy, made the poor and middle class poorer, and bailed out their rich banking friends.” Instead of trusting the Fed (possibly to fight inflation), Kiyosaki stated that he would rather put his trust in Bitcoin and other assets like Gold and Silver. 

Bitcoin price chart from Tradingview.com

BTC Will Hit $100,000 But How Soon?

There seems to be a consensus among several crypto analysts that Bitcoin will no doubt hit $100,000 in the next bull run. However, the ultimate question remains when exactly this will happen. Just like Kiyosaki, crypto analyst Kevin Svenson believes that this price level isn’t far off. 

Tom Dunleavy, Partner and Chief Investment Officer (CIO) at MV Capital, also predicted that Bitcoin will hit $100,000 this year, although he didn’t give a more precise timeframe like Kiyosaki. While some predictions remain devoid of a specific timeframe, the belief is that this parabolic price surge will happen after Bitcoin Halving.

The Halving event has been projected to be what kickstarts the next bull run. That isn’t surprising, considering that Bitcoin is known to claim a new all-time high (ATH) after miners’ rewards are cut in half. One of the most bullish post-halving price predictions is Anthony Scaramucci’s prediction that BTC will hit $170,000 in 2025.  

At the time of writing, Bitcoin was trading at around $52,300, up over 1% in the last 24 hours, according to data from CoinMarketCap. 

$52,000 And Climbing: Bitcoin Eyes New Highs This March, Predicts Top Firm

Bitcoin has been on an absolute tear, surpassing $52,000 for the first time since December 2021. The leading digital asset has already climbed over 23% in 2024, and a major driver of this meteoric rise has been the influx of institutional money entering the space through spot Bitcoin ETFs. 

Bitcoin’s mainstream credibility among traditional investors has been growing since the beginning of February, with ETFs registering between $400 million and $650 million in daily inflows in the past week. At the same time, BTC call options have seen a massive rise. 

This bullish sentiment has prompted investors to begin anticipating the moment when BTC would achieve a new all-time high. According to analysts at QCP Capital, a crypto asset trading firm, Bitcoin is set to reach a new all-time high before the end of March 2024.

Top Firm Predicts Bitcoin Can Reach New All-Time High Before April

Bitcoin’s current all-time high of $69,044 has looked like an insurmountable mountain for the past two years, especially during the prolonged bear market in 2022, which saw BTC trading below $17,000. However, things have changed since that time, and current metrics point to the price of Bitcoin blasting past this price point in the coming months. 

This change in sentiment can mainly be attributed to the attention around spot Bitcoin ETFs. Although Bitcoin seemed to struggle behind a sell-the-news event for weeks after these ETFs hit the market, the situation has since turned positive.

According to data from BitMEX Research, Bitcoin ETFs have witnessed massive inflows led by BlackRock’s ETFs in the past week. At the same time, outflows from Grayscale’s GBTC have slowed down. Consequently, the ETFs have received a steady $400 million to $650 million in daily inflows, which works out to 8,000 to 12,000 BTC bought daily. 

Notably, trading hit historic highs on February 14th, with the top nine ETFs hitting $1.5 billion in trading volume.

What’s Driving The BTC Price Rally?

QCP Capital credits this increasing institutional investment in Bitcoin as a critical driver of future growth. Analysts expect this inflow to continue as BTC becomes increasingly popular among traditional investors and global liquidity rotates into the spot ETFs, allowing it to break past its all-time high before April. 

The analysts also looked at the massive purchases of BTC call options, noting how $10 million was spent in the past week on premiums for $60,000 to $80,000 strikes expiring from April to December. This price point is exciting, as it indicates many investors are already looking forward to Bitcoin breaking past $69,000 in the coming months. 

bitcoin price btc btcusdt

Predictions can be hit or miss, but Bitcoin seems poised to continue its meteoric rise in value. It’s also important to note that the next Bitcoin halving, slated for April 2024, is steadily approaching. 

Cover image from Dall-E, Chart from Tradingview

Bitcoin Price Rally To $75,000 Imminent Due To Massive Cup And Handle Pattern

Matt Dines, the Chief Investment Officer at Build Asset Management, has identified a classical ‘Cup and Handle’ pattern in the Bitcoin (BTC) price chart, which he believes could signal an impending rally to $75,000. This technical formation is often considered a strong bullish signal and is closely watched by market analysts and traders.

Bitcoin Price Validates Cup And Handle Pattern

The ‘Cup’ part of the pattern, resembling a bowl or rounding bottom, began forming in March 2022 when the price plunged below $48,000 and entered one of the longest Bitcoin bear markets. The pattern reached its lowest point at approximately $17,600, signifying a strong support level for Bitcoin.

Bitcoin price cup and handle

The left side of the pattern shows a rounded bottom resembling a “cup.” It forms when the price initially declines, then consolidates, and finally starts to rise again. Since hitting this bottom, Bitcoin’s price has made a steady recovery, mimicking the right side of the cup, indicating a bullish reversal of the previous downtrend.

“The saucer or the ‘cup’ signifies a consolidation period, a pause in the downward trend, before the price begins to rise back up to the test resistance levels,” Dines explained. The recovery to the initial resistance line completes the ‘cup’ portion of the pattern. The Bitcoin price completed this step in early January this year.

The subsequent ‘Handle’ is represented by a moderate retracement following the recovery, which forms a small dip or pullback from the peak. This handle is identified by a slight downward trajectory and is considered the final consolidation before a breakout.

BTC’s price drop to $38,600 at the end of January marked the bottom of the pullback. With the breakout above $48,000, the Bitcoin price validated the cup and handle pattern.

Setting A BTC Price Target

Dines also addressed the placement of the vertical projection from the bottom of the handle, clarifying its basis: “It’s totally arbitrary and in the eye of the beholder. But longer answer, traders are eyeing charts for formations.”

The vertical target line, or the ‘stick’ on the right, is projected from the bottom of the handle. The height of the cup — from the low at around $17,600 to the resistance line at $48,000— sets the stage for the price target.

Dines added, “A lot of traders will use the height of the bowl (from the low of the bowl to the top at the resistance line) to set their price target. Just add that height to the bottom of the handle … that’s a decent guesstimate for where we’d see the longs who entered on the breakthrough to set their price target.”

Based on the chart, the height from the cup’s low to the resistance level is roughly $31,973, marking the increase in Bitcoin’s price from its lowest point to the current level when the chart was produced. Projecting this height from the handle’s formation suggests a target in the vicinity of $75,000.

Dines further adds that the collective behavior of market participants will indeed guide the price movement: ” A lot of those longs would set a retrace at ~$75k as they close out their W. If enough participants put this trade on it will set the dominant price action … they win out and it will turn the chart into reality. I know it sounds ridiculous, but in the real world this is how markets actually discover price.”

At press time, BTC traded at $51,821.

Bitcoin price