
Investors will likely see Bitcoin surge even more when a spot Bitcoin ETF is approved, but other factors are needed for the rally to sustain, warn analysts.
Cryptocurrency Financial News
Investors will likely see Bitcoin surge even more when a spot Bitcoin ETF is approved, but other factors are needed for the rally to sustain, warn analysts.

The price of Bitcoin and Ethereum surged nearly 4% in just a 15-minute window, sparking bullish predictions for the remainder of October.

Bitcoin is now back above the $20k mark after observing some sharp uptrend over the past day, but is this pump sustainable? Here’s what on-chain data has to say about it.
As explained by an analyst in a CryptoQuant post, the BTC exchange netflows can help us know whether this short-term uptrend is sustainable or not.
The “all exchanges netflow” is an indicator that measures the net amount of Bitcoin entering or exiting wallets of all centralized exchanges. The metric’s value is simply calculated by taking the difference between the inflows and the outflows.
When the indicator has a positive value, it means investors are depositing a net number of coins to exchanges right now. Since these holders may be sending the BTC to exchanges for selling purposes, this kind of trend could have bearish implications on the price of the crypto.
On the other hand, negative values of the netflow imply the outflows are currently overwhelming the inflows. Such a trend, when prolonged, can be bullish for the coin as it may be a sign of accumulation from holders.
Now, here is a chart that shows the trend in the Bitcoin all exchanges netflow over the last couple of weeks:
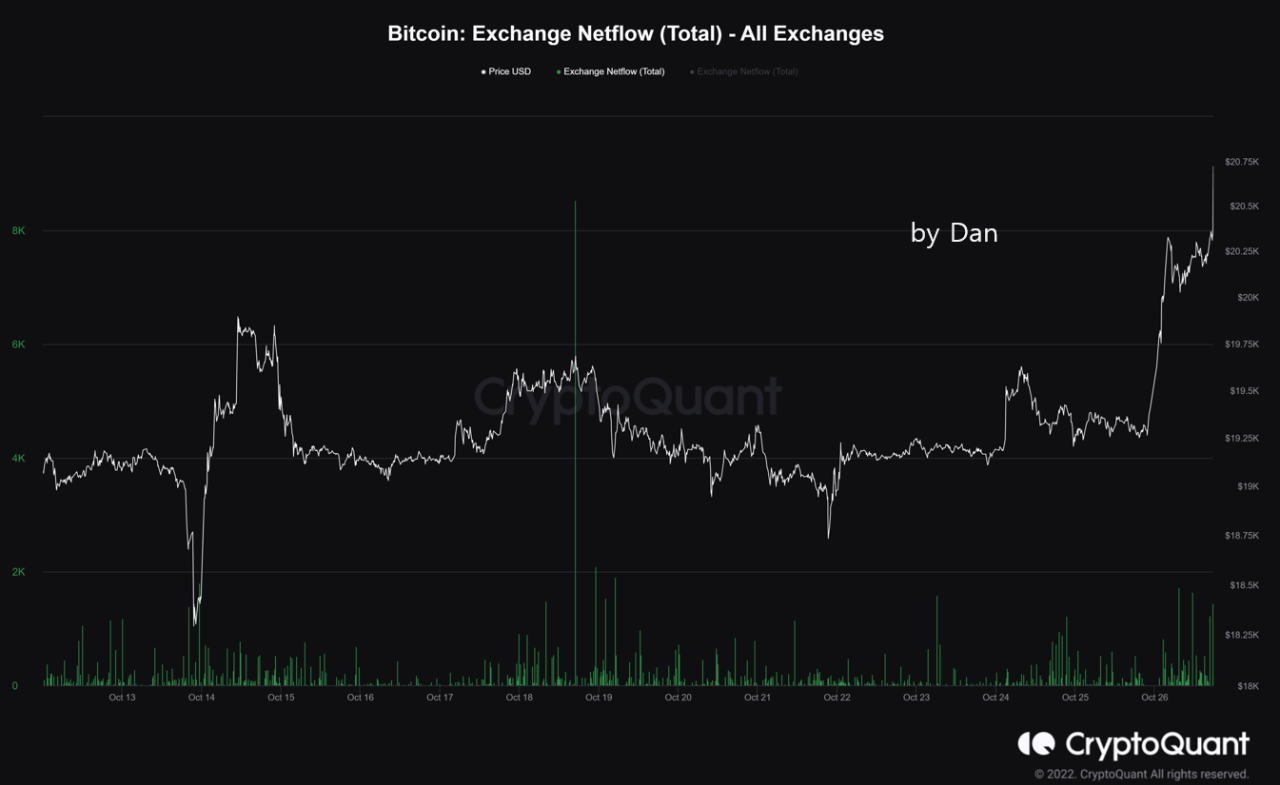
Looks like the value of the metric saw a spike about a week ago| Source: CryptoQuant
As you can see in the above graph, only the positive scale of the Bitcoin exchange netflow is displayed, as it’s a sufficient enough metric in the context of the current price discussion.
It seems like there have been no significant spikes in the value of the indicator since the crypto has observed the pump. This means that whales haven’t deposited any coins for dumping yet.
Just a week or so back, there was a pretty large positive netflow spike, shortly after which BTC returned back from its small rise.
For now, Bitcoin hasn’t seen any such inflows, which would suggest the rise could continue in the short term. However, it remains to be seen how long the whales will keep sitting still.
At the time of writing, Bitcoin’s price floats around $20.5k, up 7% in the last seven days. Over the past month, the crypto has gained 9% in value.
The below chart shows the trend in the price of the coin over the last five days.

The value of the crypto seems to have sharply risen up over the past 24 hours | Source: BTCUSD on TradingView
Featured image from Jievani Weerasinghe on Unsplash.com, charts from TradingView.com, CryptoQuant.com
Data shows the Bitcoin Coinbase premium gap has surged up to positive values, suggesting that buying from investors on the exchange could be behind the pump to $22k.
Bitcoin Coinbase Premium Gap Observes Sharp Rise To Positive Values
As pointed out by an analyst in a CryptoQuant post, after many months of negative values, the Coinbase premium gap is now above zero.
The “Coinbase premium gap” is an indicator that measures the difference between the Bitcoin price on Coinbase Pro (USD pair) and the value on Binance (USDT pair).
Since Coinbase is popularly used by US investors (especially institutionals), while Binance is used more in other parts of the world, the difference in BTC prices between the exchanges can suggest where the buying/sell pressure could be coming from.
When the value of the premium gap is greater than zero, it means the value of the crypto listed on Coinbase is currently more than on Binance. This suggests that US investors have recently been buying more compared to the rest of the world.
Related Reading | Bitcoin Miners Have Been Dumping, But Price Has Held So Far
On the other hand, negative values of the metric suggest US investors may be applying more selling pressure/lesser buying pressure on the market at the moment.
Now, here is a chart that shows the trend in the Bitcoin Coinbase premium gap over the past couple of days:
The value of the indicator seems to have spiked up over the past day| Source: CryptoQuant
As you can see in the above graph, the Bitcoin Coinbase premium gap seems to have observed a rise in the last 24 hours.
The indicator previously had a red value for many months, but now it seems the metric has once again returned to a positive value.
Related Reading | Rumors About Mt. Gox Effect On Bitcoin Resurface, Victims to Receive 150K BTC?
Also, it’s apparent from the chart that the latest pump in the price of the crypto looks to have occurred concurrently with this spike in the premium gap.
This could suggest that buying pressure from investors in the US may be behind Bitcoin catching some new upwards momentum.
BTC Price
At the time of writing, Bitcoin’s price floats around $21.6k, up 12% in the last seven days. Over the past month, the crypto has lost 31% in value.
The below chart shows the trend in the price of the coin over the last five days.
Looks like the value of the crypto has surged up during the last couple of days | Source: BTCUSD on TradingView
Earlier in the day, Bitcoin broke past $22k for the first time since mid-June. Since then, the crypto seems to have retraced back a little.
Featured image from Mariia Shalabaieva on Unsplash.com, charts from TradingView.com, CryptoQuant.com


