Bitcoin Trader Selling Pressure Declining, CryptoQuant Head Explains Why

The head of research at the on-chain analytics firm CryptoQuant has explained why selling pressure from Bitcoin traders may be declining.

Bitcoin Short-Term Holder Realized Price Has Risen To $60,000

In a new post on X, CryptoQuant head of research Julio Moreno has discussed why the short-term holder selling pressure may be declining for BTC. The “short-term holders” (STHs) refer to the Bitcoin investors who have been holding onto their coins since less than 155 days ago.

The STHs include the “traders” of the market who make many moves within short periods and don’t tend to HODL their coins. This group can be quite reactive to market movements, easily panic selling whenever a crash or rally takes place.

Generally, investors in profits are more likely to sell their coins, so one way to gauge whether the STHs would be likely to take part in a selloff is through their profit/loss margin.

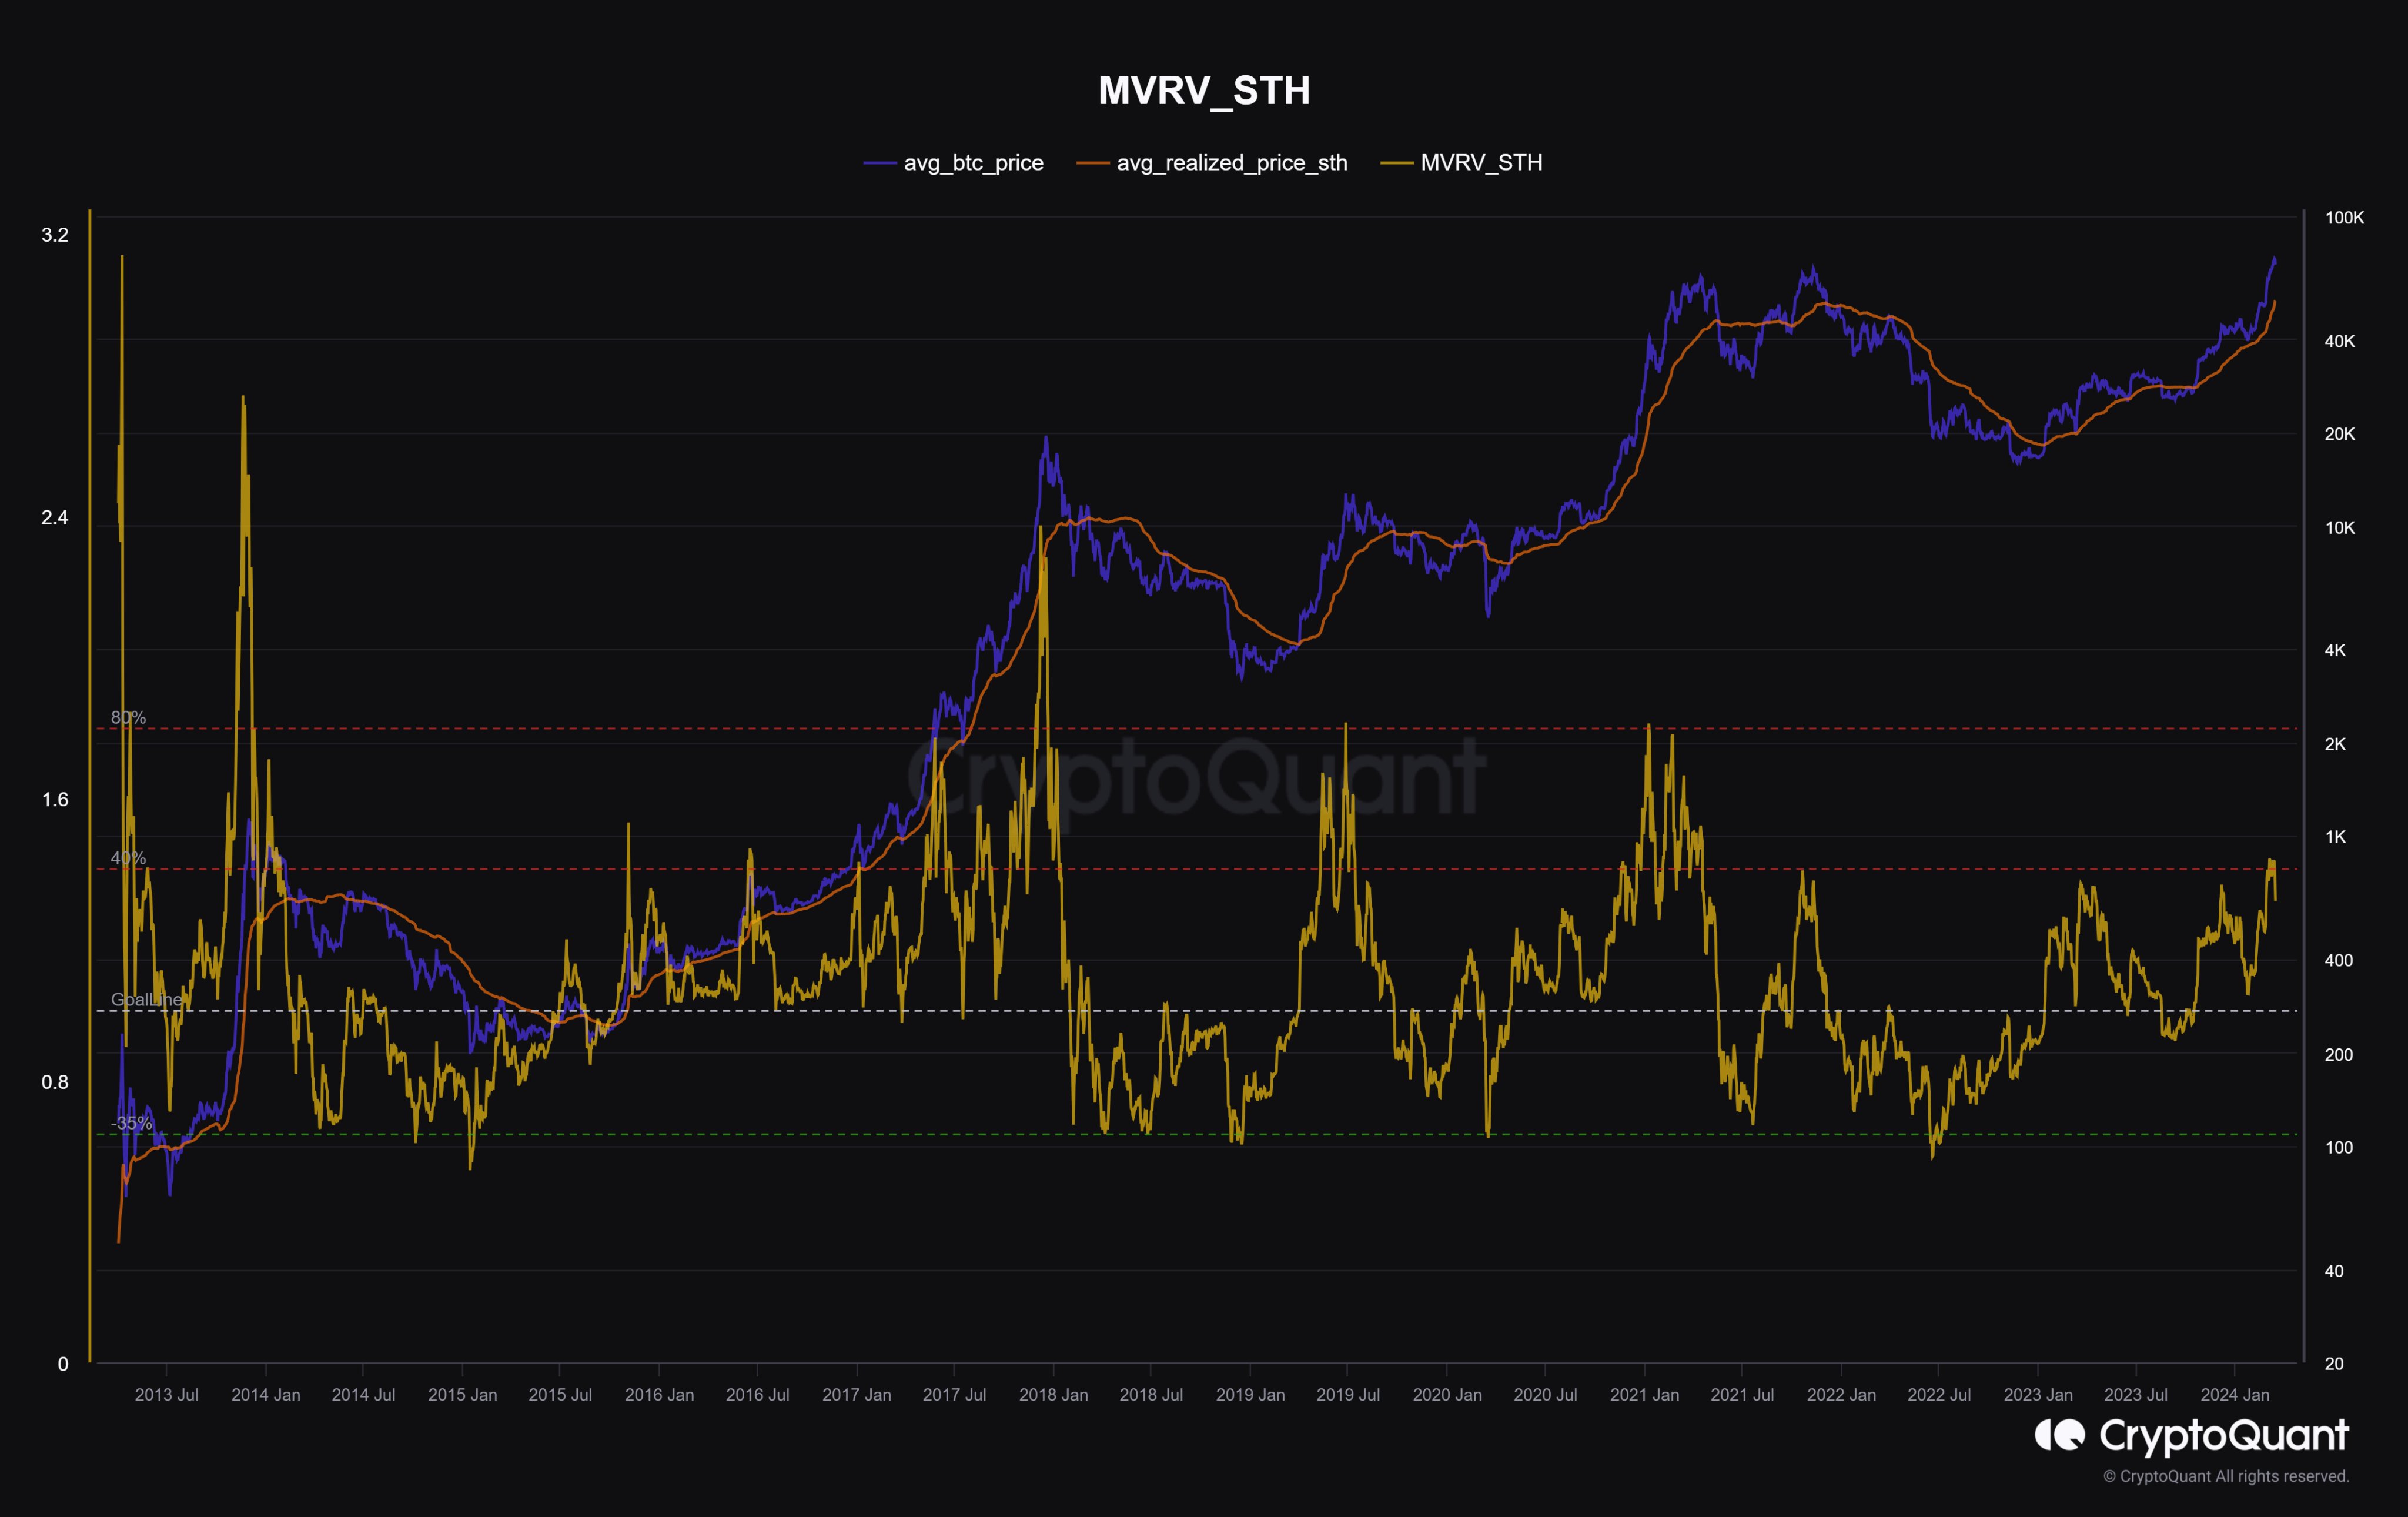
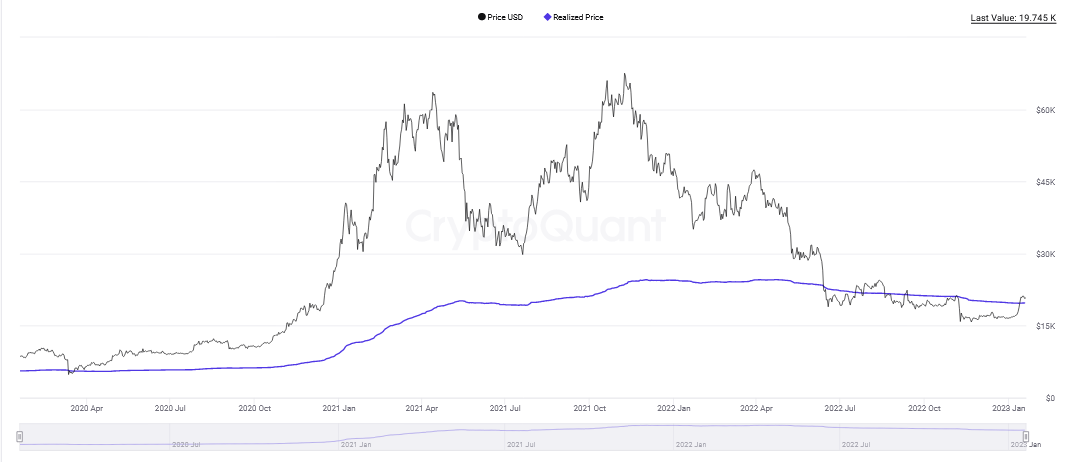
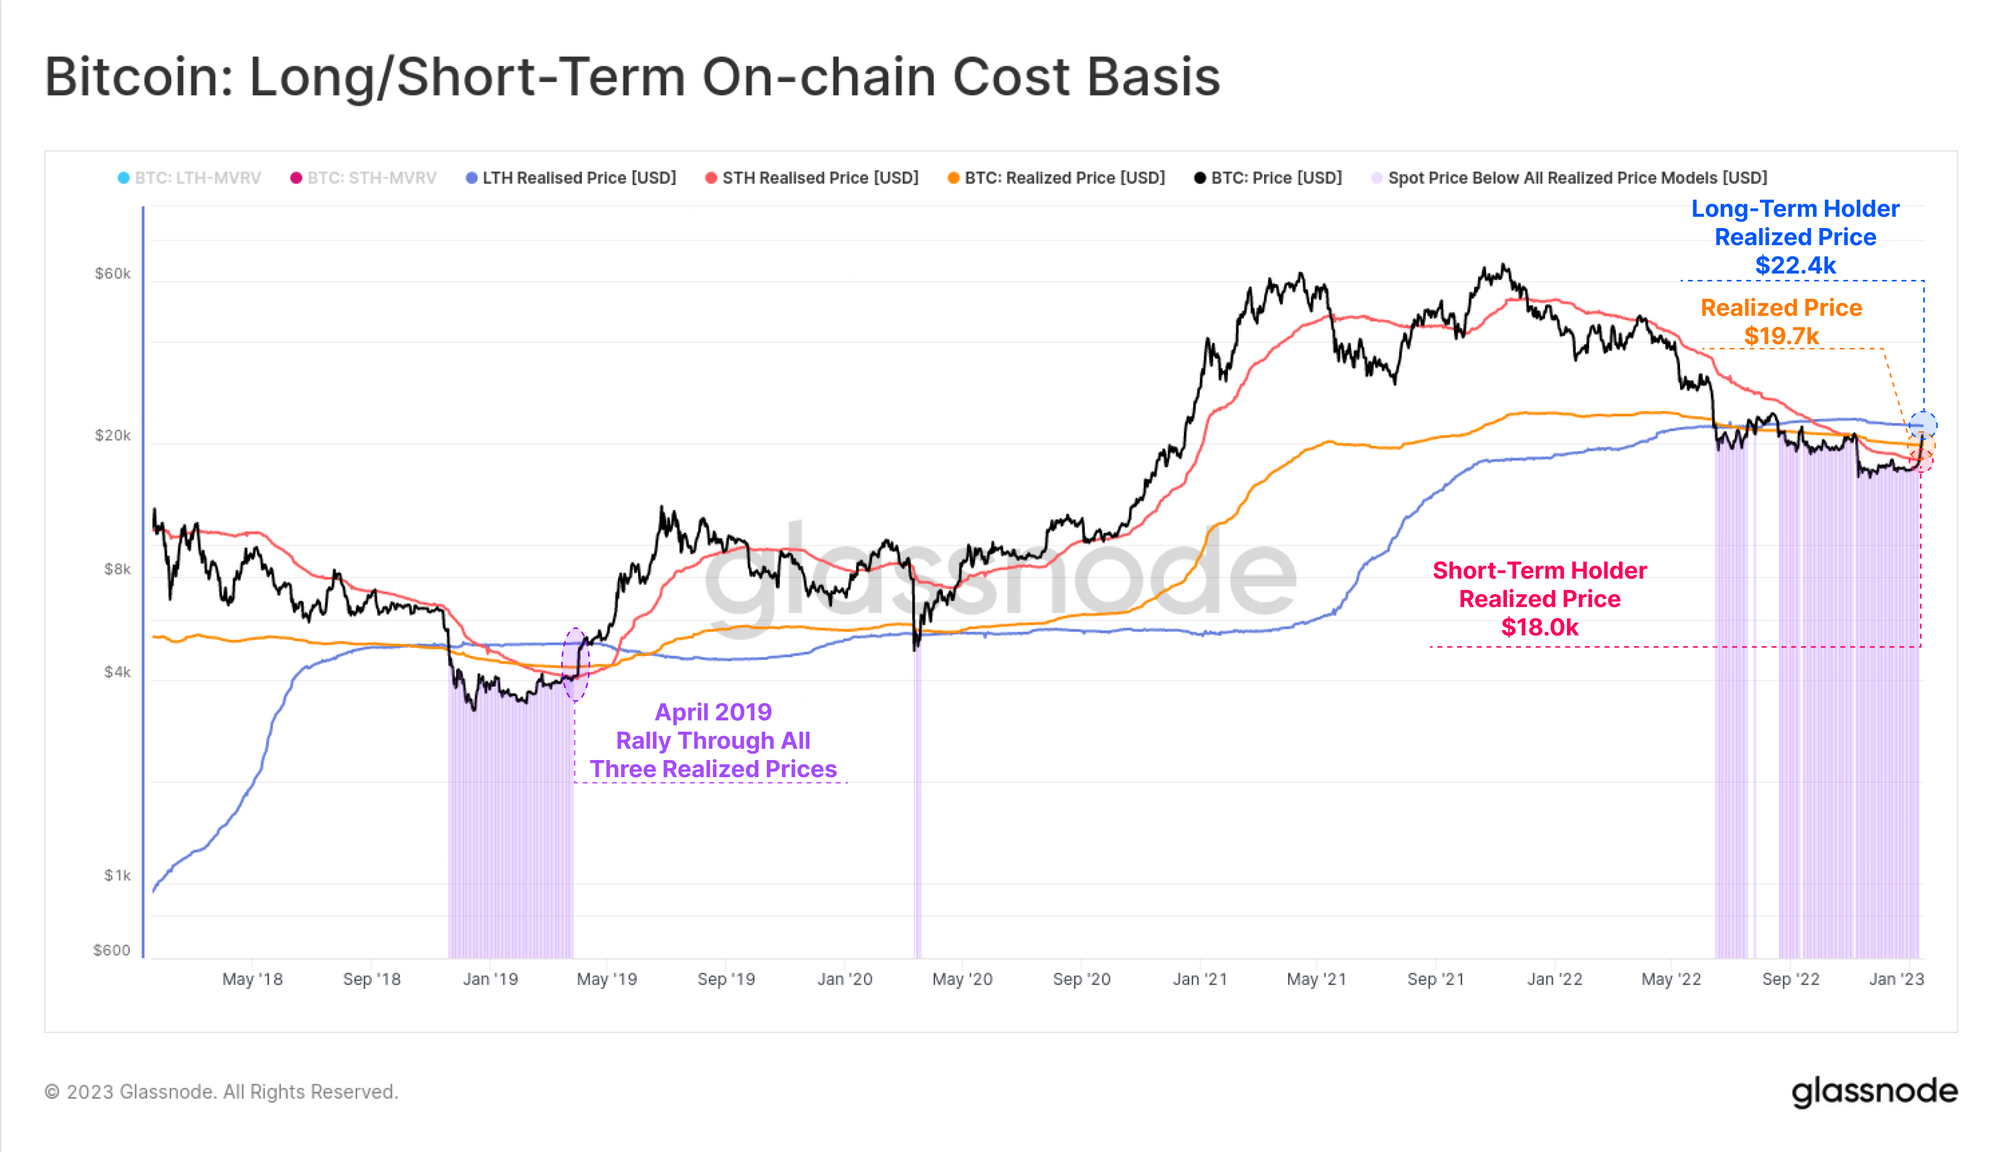
Here, Moreno has cited the profit/loss margin of this cohort based on its realized price.

Bitcoin STH Realized Price

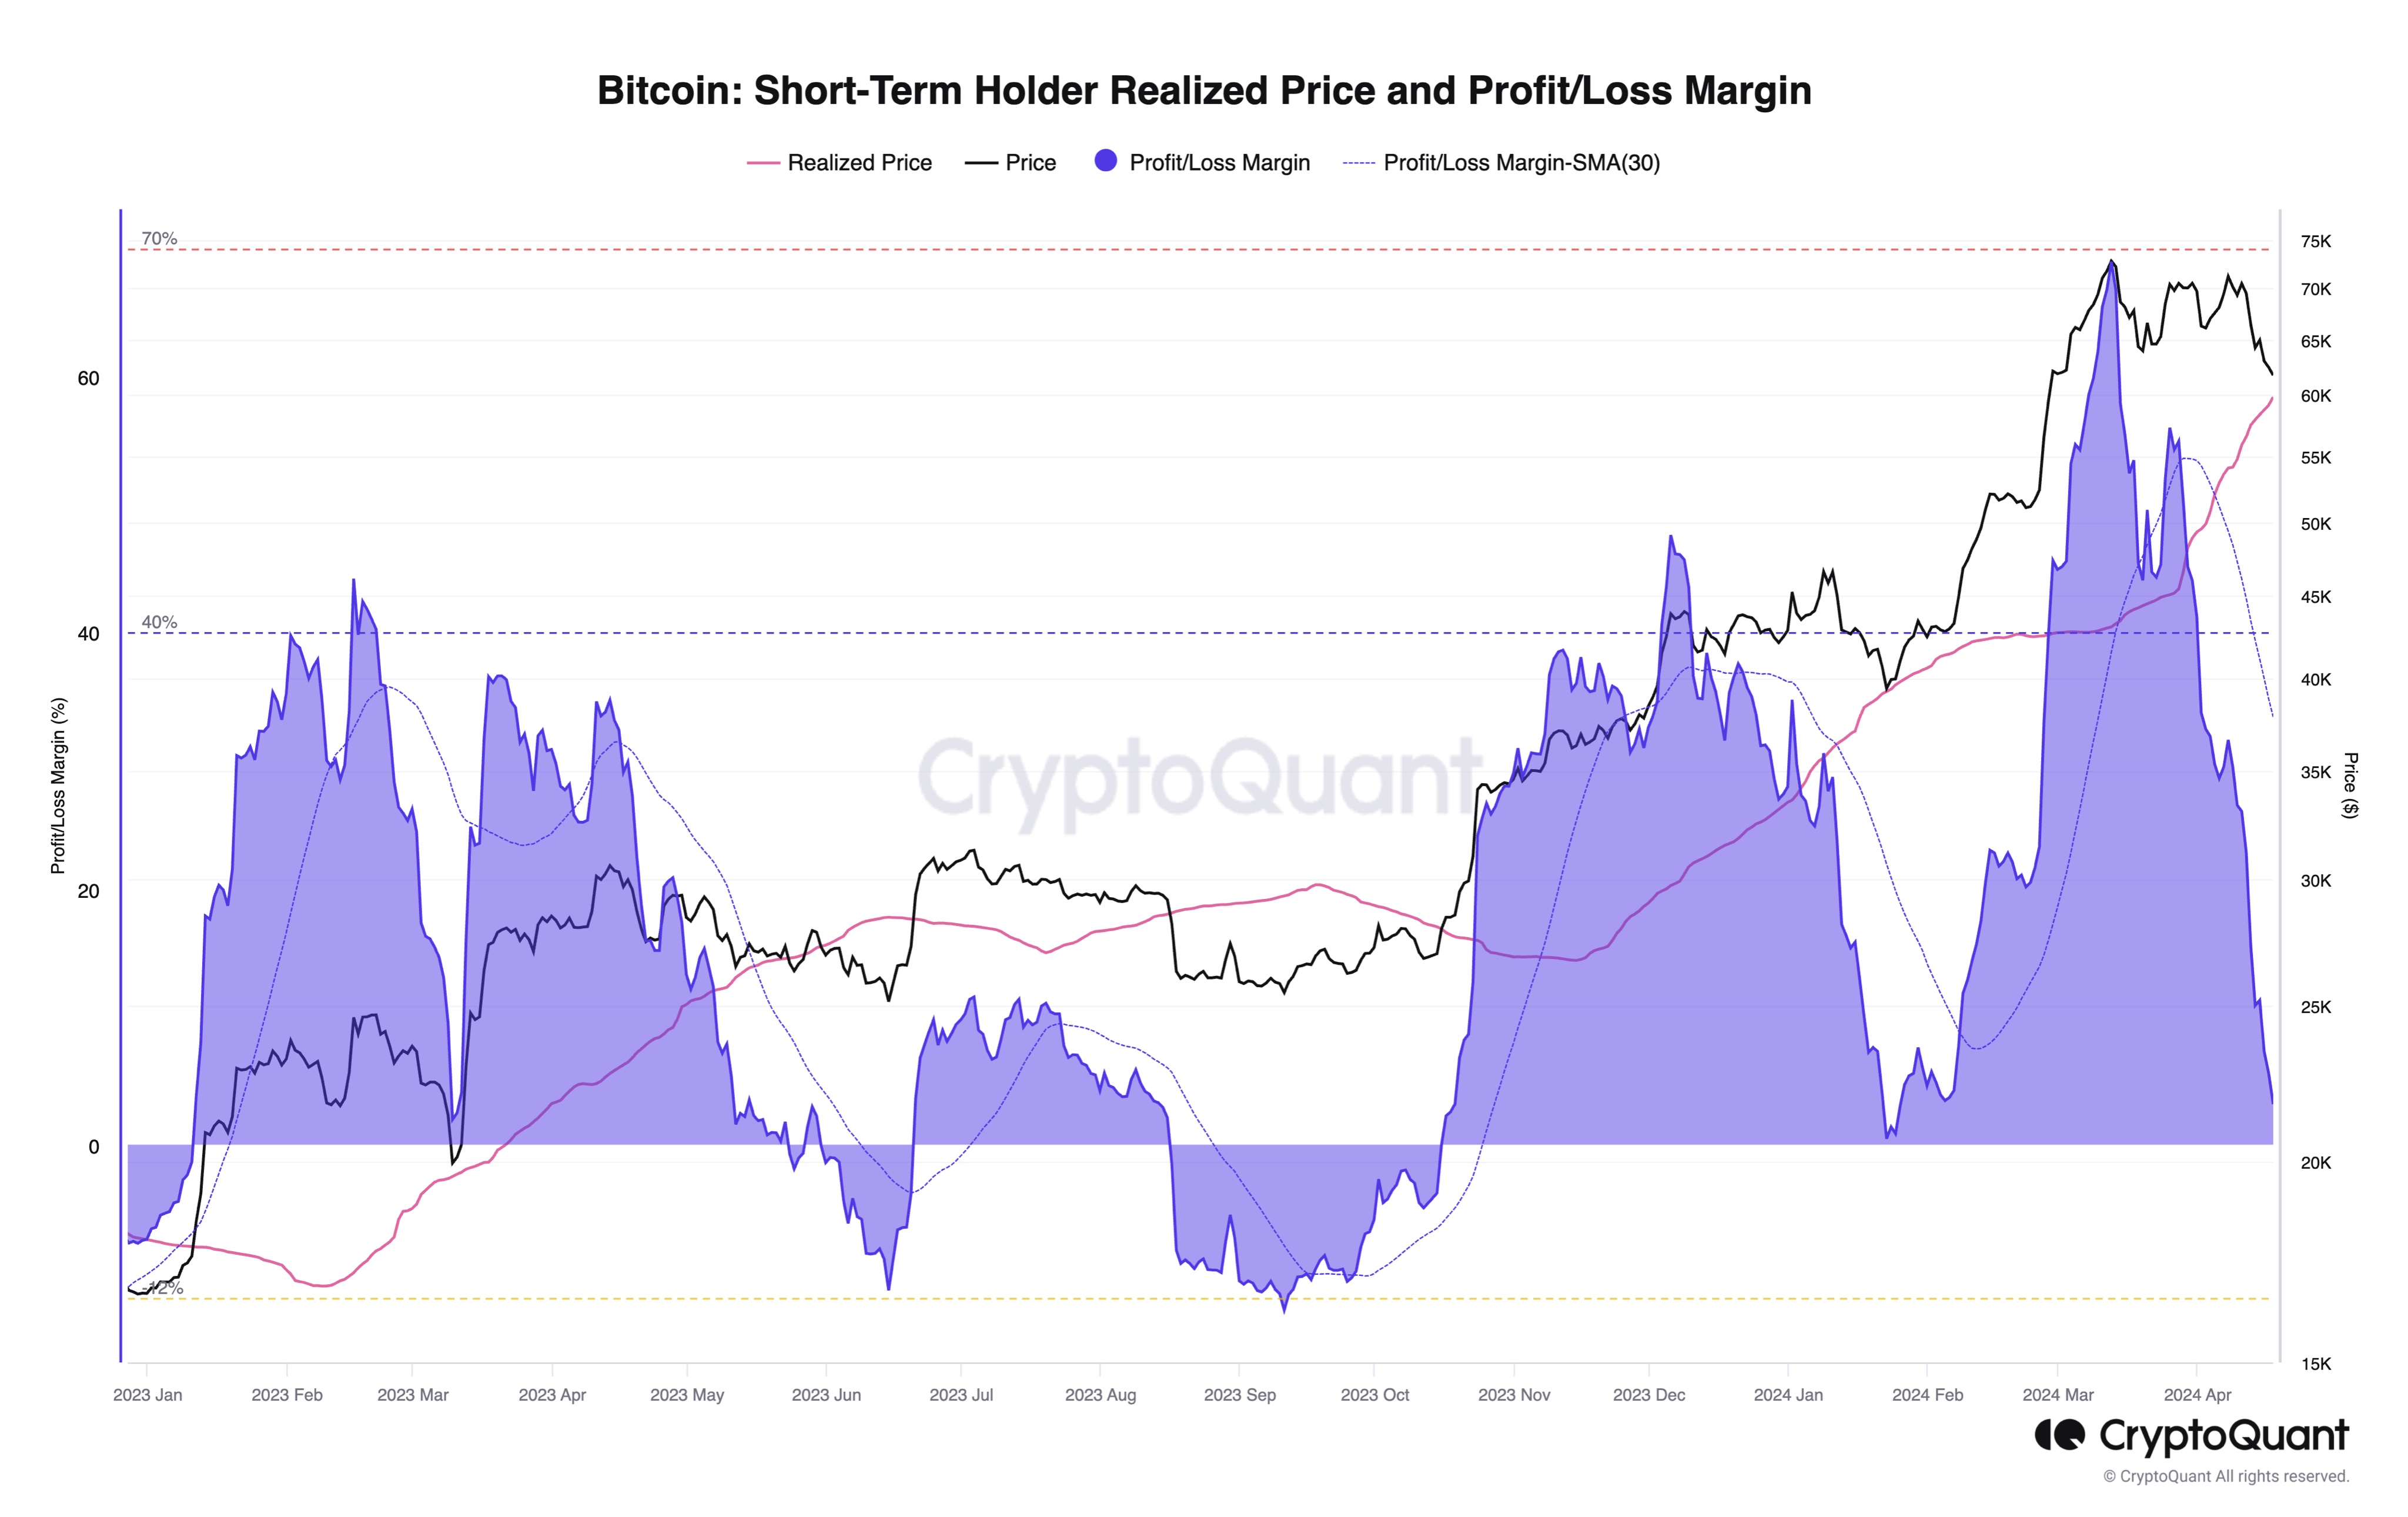
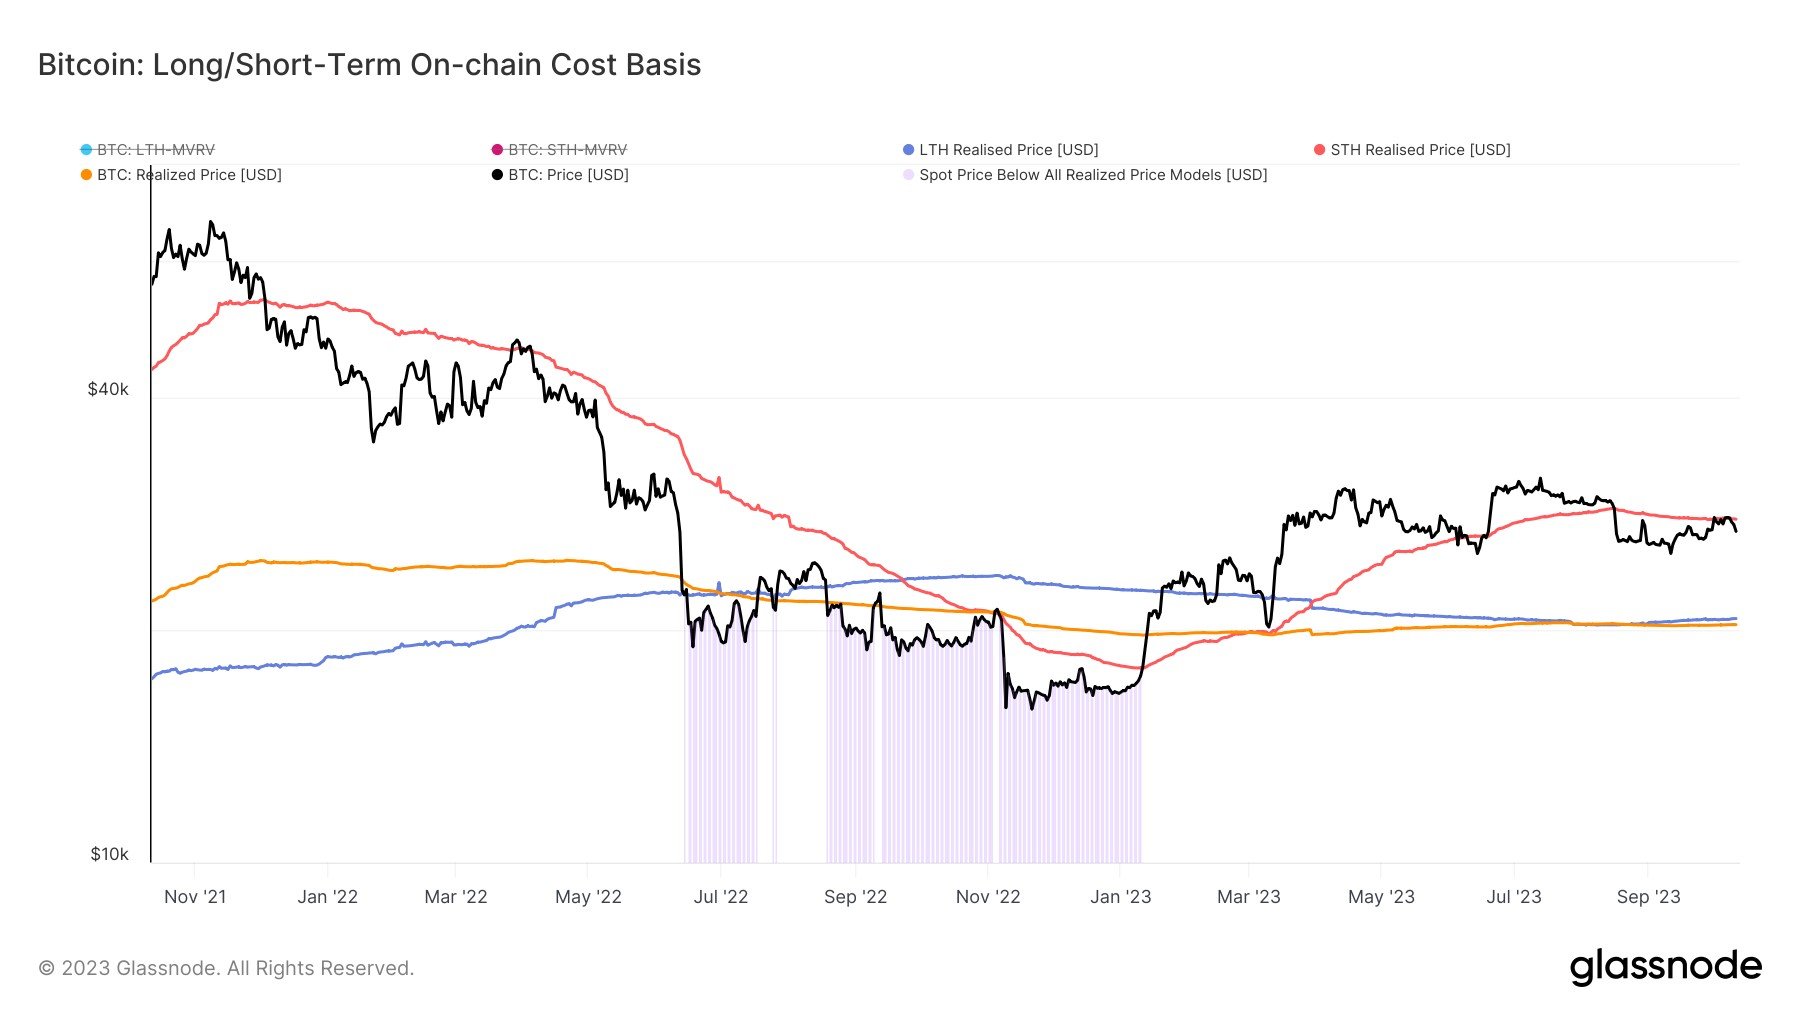
The STH realized price (highlighted in pink) here refers to the average cost basis or acquisition price of the investors part of this cohort calculated using blockchain transaction history.

When the spot value of the cryptocurrency is above this level, it means that these holders as a whole are sitting on some net profits right now. On the other hand, the price being below the metric implies the dominance of losses.

From the above chart, it’s visible that Bitcoin has been above the STH realized price for the last few months, meaning that these traders have been enjoying profits.

This is typical during bull markets as the price keeps pushing up, letting these investors make profits. While STHs tend to stay in the green in these periods, tops do become probable to take place if these profits get extreme.

As is apparent in the graph, the profit/loss margin spiked to significant levels just as BTC set its latest all-time high, which continues to be the top thus far.

Recently, as Bitcoin has consolidated between the $60,000 to $70,000 range, the STH realized price has rapidly risen, now attaining a value of around $60,000. This occurs because as STHs have traded in this range, their acquisition prices have been repriced at these higher levels, thus pushing up the average.

BTC has been quite close to this level recently so that the STHs wouldn’t be holding that much profit now. “Bitcoin selling pressure from traders may be declining as unrealized profit margins are basically zero now,” notes the CryptoQuant head.
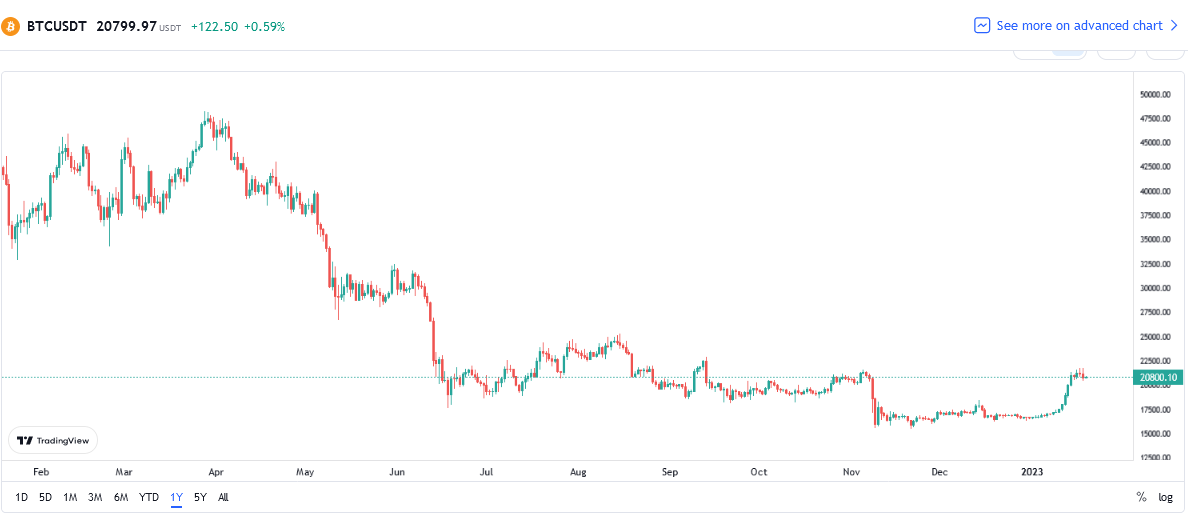
BTC Price

Bitcoin has continued to show action contained within its recent range as its price is still trading around $65,200.

Bitcoin Price Chart

Bitcoin Rebounds After Nearing Cost Basis Of Short-Term Whales

Bitcoin has found a rebound back above the $66,000 mark following a drop towards the on-chain cost basis of the short-term holder whales.

Bitcoin Drawdown Had Nearly Put Short-Term Whales Under Pressure

As pointed out by an analyst in a CryptoQuant Quicktake post, BTC’s price had neared the Realized Price of the short-term holder whales during the recent drop, but had still managed to remain above the level.

The “Realized Price” here refers to an on-chain indicator that, in short, keeps track of the cost basis (that is, the acquisition price) of the average investor in the Bitcoin market.

When the spot price of the cryptocurrency is trading above this level, it means that the investors as a whole are in a state of unrealized profits right now. On the other hand, it being under implies the overall market is carrying losses.

In the context of the current discussion, the Realized Price of the entire Bitcoin market isn’t of interest, but that of only a part of it: the short-term holder (STH) whales.

The STHs refer to the BTC investors who bought their coins within the past 155 days, while the whales are categorized as entities holding greater than 1,000 BTC. As such, the STH whales would refer to the large investors who bought during the last five months.

Naturally, the Realized Price of this group would indicate the average whale buying price over the past five months (and this price would obviously have to be one the cryptocurrency had traded at on some occasion inside this timeframe).

Now, here is a chart that shows the trend in the Bitcoin Realized Price for the STH whales over the last decade:

Bitcoin Short-Term Holder Whales

From the graph, it’s visible that the Realized Price of the STH whales has rapidly climbed alongside the sharp rally Bitcoin has gone through this year. This makes sense, as the STHs represent the new hands coming into the market, who would have to buy at higher prices as the asset’s surge would continue.

Not only that, but the STHs who age past the 155 days mark (that is, those who bought at the relatively low prices) exit out of the cohort, thus raising the average even further.

The group that these matured investors advance to is known as the long-term holder (LTH) cohort. In the same chart, the quant has also attached the data for the Realized Price of the LTH whales as well.

It would appear that these veteran whales have their cost basis at just $21,500, meaning that these investors would be getting some big rewards for their patience. In contrast, the STH whales have their Realized Price at $60,700.

During Bitcoin’s recent drawdown, the asset had come close to retesting this mark. Such retests have historically lead to reactions in the market and during bull runs, this reaction has often appeared in the form of buying. This may be why the cryptocurrency found its rebound near the $60,700 level.

BTC Price

With its latest rebound, Bitcoin has so far managed to recover back towards the $66,500 level.

Bitcoin Price Chart

Bitcoin To $53,200? Why History Says It’s Possible

As Bitcoin drops below $68,000, history suggests this correction is rather tame for bull markets, as plunges to this deep on-chain level have been the norm.

Bitcoin Short-Term Holder Realized Price Is Currently Around $53,200

As pointed out by CryptoQuant Netherlands community manager Maartunn in a post on X, BTC still has a decent margin over the realized price of the short-term holders.

The “realized price” is an on-chain metric that keeps track of the average price at which the Bitcoin investors acquired their coins. The indicator calculates this value by going through the transaction history of each coin and assuming that the last transfer of it was the last time it was purchased (that is, the price at the time is its current cost basis).

When the spot value of the cryptocurrency dips below the realized price, it means that the average investor is now in a state of loss. On the other hand, a break above implies the market as a whole has entered into net profits.

In the context of the current discussion, the realized price for only a particular segment of the investors is of interest: the “short-term holders” (STHs). The STHs include all the investors who bought their coins within the past 155 days.

Now, here is a chart that shows the trend in the Bitcoin realized price specifically for this cohort:

Bitcoin Short-Term Holder Realized Price

As displayed in the above graph, the Bitcoin STH realized price has shot up recently as the price of the asset has gone up. This makes sense, as this group includes the most recent buyers, who would continuously be buying at higher prices in an uptrend, thus raising their average cost basis.

At present, this cohort’s realized price is about $53,200. During the past day, BTC has seen a sharp drop that has taken its price below the $68,000 mark, but clearly, the STHs would still be in high profits even after this drawdown.

“In previous bull markets, the average cost basis of short-term holders was fully reset multiple times,” explains Maartunn. This trend is most prominent in the data for the 2017 bull run when the price retested this level several times.

An interesting pattern that has been held is that these retests of the level during bull trends have generally resulted in the cryptocurrency finding support and turning itself back around.

The explanation for this trend may lie in the fickle nature of the STHs. The cost basis is an important level for these investors, and when a retest of it happens, they panic and show some reaction.

During uptrends, these holders are more likely to buy more when a retest of their cost basis occurs since they may think that the same price levels that were profitable earlier will be so again in the near future.

Naturally, it’s not a certainty that Bitcoin would also end up retesting this level in this bull market. Still, a correction might reach close to it if the historical precedent is anything to go by.

BTC Price

Following its 7% drop in the past day, Bitcoin is trading at around $67,700.

Bitcoin Price Chart

These Are The Four Key Bitcoin Price Levels To Watch, Reveals Analyst

An analyst has revealed the four key Bitcoin price levels that could be to keep an eye on, as they may have an influence on the spot price’s trajectory.

These Are The Four Key Price Points For Bitcoin

In a new post on X, CryptoQuant Netherlands community manager Maartunn has shared four key price levels for Bitcoin. Three of these levels involve some kind of variation of the “realized price” on-chain indicator.

The realized price keeps track of the price at which the average investor on the network acquired their coins. In other words, the metric measures the average cost basis of the asset’s user base.

When the spot price of the cryptocurrency is greater than the realized price, it means that the average holder in the sector can be assumed to be carrying some profits right now. On the other hand, the price being under the indicator implies the market as a whole is underwater some net amount at the moment.

Naturally, the price is exactly equal to the metric, suggesting the average holder is just breaking even on their investment currently. Historically, this is the condition that has been of particular importance for the coin, as such retests can flip the profit-loss situation of the investors.

Now, here is the chart shared by Maartunn that reveals the trend in the four key Bitcoin price points in question over the last few years:

Bitcoin Realized Price

In the above graph, the red colored line (which also happens to have the highest value out of these right now) corresponds to the realized price of the “short-term holders” (STHs).

The STHs refer to the investors who bought their coins within the last 155 days. At present, the average cost basis of this cohort stands at $38,750. In bullish periods, this level has often been a point of major support for the asset, and Bitcoin came quite close to retesting it during its latest drawdown.

Opposite to the STHs are the “long-term holders” (LTHs), whose realized price is shown by the green curve in the chart. The indicator’s value is only $18,740 for this cohort currently, implying that these HODLers are carrying high amounts of profits.

The purple line in the graph represents the “adjusted realized price,” which is a metric that provides a baseline for the market in general. Bitcoin found its bottom back in September when it retested this level. Currently, the indicator’s value stands at $31,190.

Close to this line right now is the fourth and final price level pointed out by the analyst, the 200-week moving average (MA), which is at $30,500. 200 weeks is approximately how long the popular 4-year Bitcoin cycle lasts for, so this MA can help reveal the cycle baseline momentum for the coin.

Maartunn, in particular, finds this 200-week MA and the adjusted realized price to be the most intriguing levels out of the four listed here.

BTC Price

Bitcoin had made a visit under the $42,000 level yesterday, but it appears the asset has already bounced back, as it’s now trading above $43,000 again.

Bitcoin Price Chart

$35,000 The Next Key Level To Break For Bitcoin, Here’s Why

Bitcoin has now broken the $31,000 mark with its latest rally. According to on-chain data, the level could be the next major milestone for BTC.

Bitcoin Realized Price Of 2021 Holders Is $35,000 At The Moment

In a new post on X,  analyst James V. Straten has discussed the profit/loss situation of the different yearly Bitcoin buyer cohorts. The indicator of interest here is the “realized price,” which keeps track of the average price at which investors in the BTC market bought their coins.

When the asset’s spot price is below this metric, the average holder in the sector is at a loss right now. On the other hand, it being above the indicator suggests the dominance of profits among the investors.

Here, Straten hasn’t shared the chart for the ordinary realized price for the entire circulating supply but rather a few versions of the metric that only consider buyers since the start of a particular year. The chart below shows the trend in the Bitcoin realized price for each year since 2017.

Bitcoin Realized Price

As is visible in the graph, the Bitcoin realized price for all years except 2021 is below the current spot price of the cryptocurrency. This implies that the different yearly cohorts of the asset are holding their coins at some net unrealized profit.

The latest groups to enter into a state of profit have been the 2022+ and 2023+ ones. The 2021+ group has a realized price of about $35,000 at the moment, which is still a significant distance away, but as Straten has noted, the gap between the spot price and the metric is now the narrowest since the two diverged back at the start of the bear market.

Interestingly, during the peak in 2021, this group’s cost basis was around $48,000. The analyst suggests their realized price, since decreasing significantly, indicates some impressive Dollar-Cost Averaging (DCA) in the market.

In on-chain analysis, major cost basis levels have always played an important role, as the BTC spot price has often observed support or resistance on retests of them.

The chart shows that the Bitcoin price had found support at the 2023+ realized price back in June. The recent seemingly endless consolidation that BTC saw before the latest rally happened around the 2022+ and 2023+ metrics after they had overlapped.

Given the historical examples, the 2021+ may realize price will cause the price to react somehow when it eventually reaches there. Thus, the $35,000 level would be a significant milestone for the asset, as successfully claiming it could imply clear waters ahead for the cryptocurrency.

At the same time, however, the chances of participants buckling and harvesting their gains are increasing with all these groups coming into profits. Such profit-taking can lead to a pullback in the price, at least in the short term.

BTC Price

At the time of writing, Bitcoin is trading at around $31,200, up 11% in the past week.

Bitcoin Price Chart

Wait For Bitcoin At $20,000? This Analyst Says No

An analyst has explained using on-chain data that Bitcoin has a major demand bucket at the current price levels, so it won’t hit $20,000 anytime soon.

Huge Bitcoin Buying Occurred Inside The $25,000 To $30,000 Range

In a new post on X, analyst Ali has explained that some large entities accumulated at the $25,000 to $30,000 range. The indicator of interest here is the “UTXO Realized Price Distribution” (URPD), which, in short, tells us about the amount of Bitcoin that was acquired at the different price levels of the cryptocurrency.

Here is a chart that shows how the URPD of the current Bitcoin market looks like:

Bitcoin URPD

Notice that the URPD here is “ATH-partitioned.” What this means is that the price ranges here have been defined by creating 100 equally spaced partitions between zero and the all-time high (ATH) of the cryptocurrency.

From the graph of the Bitcoin URPD, it’s visible that the price levels between $25,000 and $30,000 are host to the cost basis of a particularly large amount of the supply.

Ali notes that most people, including major institutional investors like Michael Saylor’s Microstrategy and Elon Musk’s Tesla, purchased a significant number of coins between these levels.

The levels being so dense with supply isn’t only significant because of the fact that these large entities believe those prices were worthy buys, but also due to how investor psychology tends to work out.

Generally, whenever the price retests the cost basis of a holder, they may become more probable to show some reaction. How they would react depends on their sentiment and profit/loss status prior to the retest.

If they had been i9n profits before the price declined towards their cost basis, they may believe the price would go up again in the future so they would accumulate more at the dip.

On the other hand, them being at loss before may make them sell at their cost basis, as they would find the idea of breaking-even more enticing than potentially going back into losses.

There are some dense price buckets above the current level, meaning that BTC could feel resistance when it would retest them due to such investors exiting at their break-even.

If Bitcoin declines instead, however, it could feel strong support, as the buckets below are zones of some pretty major demand, so at least some of these investors might be inclined to buy more at these same levels. Thus, a decline below this range could be unlikely for the cryptocurrency.

“So when they tell you “It’s too late to buy BTC” or “Wait for $20k,” please ignore them!”, advises the analyst.

BTC Price

Bitcoin is up almost 7% during the past week, but the coin’s surge has slowed down recently as its price has mostly been consolidating around $28,500.

Bitcoin Price Chart

This Rare Bullish Bitcoin Crossover Could Soon Form, Quant Predicts When

A rare bullish crossover between two on-chain metrics could soon be forming for Bitcoin. Here’s when this analyst believes the cross would happen.

Bitcoin Realized Prices Of Two UTXO Age Bands Are Moving Towards A Cross

As explained by an analyst in a CryptoQuant Quicktake post, a bullish crossover is expected to happen soon for BTC. The indicator of interest here is the “realized price,” which basically keeps track of the price at which the average investor in the Bitcoin market acquired their coins.

The indicator calculates this value by going through the on-chain history of each coin in circulation to see what price it was last transacted at. The metric assumes this price to be its buying price and so, after taking the mean of this value for all tokens on the network, the average cost basis of all coins is obtained.

When the cryptocurrency’s price is under this metric, it means that the average holder in the sector is in a state of loss. On the other hand, the price being above the indicator implies the overall market is enjoying net profits.

The realized price of the entire user base isn’t of relevance in the context of the current discussion, but two specific UTXO age bands which are 6 months to 12 months and 12 months to 18 months. What these age bands signify is that the coins (or more accurately, UTXOs) belonging to them were last moved inside their range.

Now, here is a chart that shows the trend in the Bitcoin realized price for these two UTXO age bands over the past few years:

Bitcoin Realized Price

As displayed in the above graph, the realized price of the UTXOs sitting dormant between 12 and 18 months ago has been heading down for a while now. The 6-month to 12 months age band had been showing a similar trajectory earlier in the year, but a while back, the metric plateaued and has since then turned itself around.

The reason the average cost basis of investors belonging to this age band has reversed its trajectory is that the 6 months cutoff for the group now lies in April, which means that those who bought during the rally in the starting months of the year would now be counted under this cohort.

Earlier in the year, the bear market buyers were a part of the group, so the average naturally headed down. The 12-month to 18-month-old group, on the other hand, still constitutes these bear market buyers, hence why its realized price is still decreasing.

If these two metrics continue in their current trajectories, they will go through a crossover. As the quant has highlighted in the chart, such a crossover where the 6 months to 12 months band has broken above the 12 months to 18 months cohort, has historically proven to be bullish for the asset.

In total, there have only been four such crossovers in the cryptocurrency’s entire history, so if this crossover goes on to form, it would only be the fifth ever. The analyst believes that November 28, 2023, is when this bullish crossover could be expected to form for Bitcoin.

BTC Price

Bitcoin had made a push toward the $29,000 level yesterday, but it appears the surge has already calmed down as the coin has retraced towards $28,400.

Bitcoin Price Chart

Bitcoin Finds Rejection At This Historical Line, Bear Market Back On?

On-chain data shows Bitcoin has failed in its latest retest of a historically significant metric, a sign that a bearish trend might have taken over.

Bitcoin Has Been Rejected From The Short-Term Holder Cost Basis

As pointed out by an analyst in a post on X, BTC is currently facing resistance at the short-term holder’s realized price. The “realized price” here refers to the cost basis or acquisition price of the average investor in the Bitcoin market.

When the spot price of the cryptocurrency is below this level, it means that the investors as a whole are currently in a state of net loss. On the other hand, the asset being above this metric suggests that the overall market is holding some profits right now.

In the context of the current discussion, the realized price of the entire BTC sector isn’t of relevance, but of only a particular segment: the “short-term holders” (STHs).

The STHs are the investors who purchased their coins within the past 155 days. The members of this group are generally weak in their conviction, and thus, they can be quite reactive to changes in the market.

Now, here is a chart that shows the trend in the Bitcoin realized price specifically for these STHs over the past couple of years:

Bitcoin Short-Term Holders

As displayed in the above graph, the Bitcoin short-term holder’s realized price is valued at about $27,800 right now. During its most recent attempt at recovery, BTC retested this line but ended up finding some major resistance at it.

The indicator actually has a lot of history of acting as both resistance and support for the spot price of the cryptocurrency. Generally, this line has helped the asset during bull rallies, while it has impeded it in bear markets.

From the chart, it’s visible that the asset’s price had found resistance at this mark and had remained under it throughout the bear market in 2022. With the rally that started in January of this year, though, the coin had finally managed to find a break.

The realized price of the STHs had then flipped towards being a support level, as it had propelled the asset during the retests in March and June. With the crash in August, however, Bitcoin once again slipped below the line and has been unable to climb back above it since.

Given the significance of the line, the latest retest of the indicator was quite important, so the fact that it ended in failure could be a worrying sign for the asset, as it may mean that a shift back towards a bearish trend might have occurred.

BTC Price

Retests like the one of the STH realized price can sometimes take a while to properly finish, but since Bitcoin has seen a steep decline towards the $26,700 level since the rejection, it may be confirmation that the asset was indeed rejected this time.

Bitcoin Price Chart

Here’s What Will Happen If Bitcoin Can Break $33,700

On-chain data suggests the $33,700 level could be a very significant level to break for Bitcoin if the historical pattern is anything to go by.

Bitcoin 6 Months To 3 Years Old Investors Have $33,700 As Cost Basis

In a new post on X, Ali, an analyst, has shared a chart that could shed light on the path that BTC may end up taking. The relevant indicator here is the “realized price,” which tells us about the price at which the average investor in the Bitcoin market acquired their coins.

Related Reading: Bitcoin Exchanges See Three Straight Months Of Withdrawals For First Time Ever

When the spot price of the asset exceeds this line, it means that the holders as a whole are currently carrying a net amount of profit on their coins. On the other hand, BTC being below the level suggests the average investor is underwater right now.

In the context of the current discussion, the cost basis of the entire market isn’t of relevance, but of only a specific segment: the holders who acquired their coins at least six months and at most three years ago.

Here is a chart that shows how the cost basis of these Bitcoin investors has changed over the years:

Bitcoin Realized Price

The six months to three years old investors are actually a part of the larger “long-term holder” (LTH) group. And the LTHs are simply the investors who bought their coins at least six months ago.

In the chart, the analyst has also attached the data for the cost basis of the entire LTH group and it’s visible that this metric currently has a value of about $20,300, meaning that the spot price is currently a decent distance above this line.

The realized price of the six months to three years old holders, however, is above the spot price right now, as it’s valued at about $33,755. Naturally, this means that this segment of the LTHs is currently firmly in the red.

From the graph, it’s also apparent that the Bitcoin price has not touched this level since early 2022, when the bear market first kicked off. If the cryptocurrency can surge towards the level and finally make a retest of it, then its fate might change for the better.

This is because, as Ali has pointed out, BTC has observed a significant rally whenever the asset has crossed this mark and these HODLers have gotten back into profits.

Three instances of this pattern are clearly visible in the chart. The 2017 bull run, the April 2019 rally, and the 2021 bull run all emerged from successful breaks of the cost basis of the six months to three years old LTHs.

If this historical pattern holds any weight at all, then a Bitcoin break above the $33,700 level in the near future could become the starting point of the next major bull run.

BTC Price

At present, Bitcoin is quite a bit below the cost basis of these LTHs, as its price is trading just under the $25,800 level.

Bitcoin Price Chart

$28,100 Next Level To Break For Bitcoin, Here’s Why

On-chain data suggests the $28,100 level could be the next major resistance to break for Bitcoin if history is anything to go by.

Bitcoin Short-Term Holder Cost Basis Is Valued At $28,100 Currently

As pointed out by an analyst in a CryptoQuant post, the BTC price has recently neared the short-term holders’ realized price. The “realized price” is a metric that basically represents the cost basis (that is, the buying price) of the average investor in the Bitcoin market.

When the spot price of the asset dips below this indicator, the majority of the holders go underwater, while breaks above the level naturally result in the average investor moving into a state of profit.

Related Reading: Bitcoin Bullish Signal: Exchange Netflow Remains Negative

In the context of the current discussion, the realized price for only a segment of the cryptocurrency’s user base is of interest; namely, the “short-term holders” (STHs).

The STHs include all investors who have been holding onto their coins since less than 155 days ago. This cohort is one of the two main groups in the BTC market; the other one being the “long-term holders” (LTHs).

The STHs are generally the more fickle investors, who easily react to changes in the wider market (like crashes or rallies), while the LTHs tend to stay silent regardless of the wider sentiment.

Now, here is a chart that shows the trend in the Bitcoin realized price for both of these groups over the last few years:

Bitcoin Realized Price

As displayed in the above graph, the BTC spot price has surged closer to the STH realized price with the cryptocurrency’s latest rally following the news of the Grayscale victory.

Historically, the retests of this level have been very often significant for the cryptocurrency, as they have generally set the tone for what trend the asset could follow in the near future.

During bullish periods, the cost basis of the STHs usually provides support to the price, while the coin may encounter resistance at the line during bearish regimes.

This pattern can also be seen working in action during this year’s rally, as Bitcoin found support at the line during the retests in both March and June. With the recent crash, however, Bitcoin finally plunged under the level.

It’s possible that a return toward a bear market has now occurred because of this failed retest. Currently, the Bitcoin STH realized price is valued at about $28,100, which is actually the highest BTC has gone during the latest surge.

Since Bitcoin has observed a pullback, it’s possible that it’s because of the resistance that the STH cost basis provided. If BTC continues to surge in the coming days, another retest of this level might be one to watch for, as a rejection might confirm a bearish transition. A successful break, however, could suggest that the bullish momentum isn’t dead just yet.

BTC Price

Following the latest surge, Bitcoin is now trading around the $27,400 mark, with investors being in 6% profits over the past week.

Bitcoin Price Chart

Will Bitcoin Retest $20,500 Again? This Pattern May Suggest So

Bitcoin is forming a pattern that has historically led to the asset retesting a specific line. At present, this level would be found at $20,500.

Bitcoin Has Dropped Below The 200-Day SMA With The Recent Crash

A few days back, Bitcoin observed a sharp crash that took the cryptocurrency’s price toward the $26,000 mark. As this plummet was already significant, many have wondered whether this was it or if the drawdown will continue.

An analyst on X, Ali, shared a chart that may provide hints about where the asset could be heading next.

Bitcoin Realized Price

The analyst has attached the data for two Bitcoin-related metrics in the graph: the 200-day simple moving average (SMA) and the realized price. The chart shows that the BTC price has dropped below the 200-day SMA (colored in purple) with the latest crash.

According to the analyst, when the cryptocurrency’s price has crossed below this level during the past ten years, it has often retested the realized price (colored in orange).

The “realized price” here refers to the cost basis or the buying price of the average investor in the BTC market. This means that whenever the cryptocurrency dips below this level, the average holder enters a state of loss. On the other hand, breaks above the line imply a return to profits for most of the market.

Historically, this metric has had some interesting interactions with the spot price of the coin. During bullish periods, the line has generally supported the asset, while during bearish periods, it has acted as resistance.

The explanation behind these curious interactions may lie in how the investors’ minds work in each period. In bull markets, the average investor may think that the price will only go up, so whenever the asset drops to its buying price, they accumulate more of the asset.

Similarly, in bearish trends, the holders may believe the cryptocurrency will only go down, so the price they bought in (their break-even mark) would be the ideal exit opportunity.

This buying and selling may cause the level to act as support and resistance in the respective regimes. The latest example of this behavior was seen earlier in the year when Bitcoin rebounded off the line back in March.

As the asset now appears to have broken below the 200-day SMA, it may be heading towards a retest, as has often happened many times in the past.

Right now, the cost basis of the average investor is $20,500, which means that if BTC is going to touch this line again, a significant drawdown would need to occur.

If this scenario indeed plays out, then it’s possible that Bitcoin could find a rebound at the realized price once again. A retest failure, however, would be a very concerning sign, as it might signal the return of the bear market.

BTC Price

At the time of writing, Bitcoin is trading around $26,000, down 11% in the last week.

Bitcoin Price Chart

Bitcoin Plunges To $28,500, Will This Historical Support Hold Again?

Bitcoin has plunged toward the $28,500 mark during the past day, which happens to be quite near a historically significant support line.

Bitcoin Is Now Near The Short-Term Holder Realized Price

As pointed out by an analyst in a CryptoQuant post, BTC’s latest drawdown has brought it near the realized price of the short-term holders. The “realized price” here refers to a metric that’s derived from the “realized cap” model of Bitcoin.

The realized cap calculates the total valuation of the asset by assuming that the actual value of any coin in circulation is not the current spot price, but the price at which the coin was last transacted on the chain.

Since the last transfer price of any coin is likely to represent its buying price, this model accounts for the prices that each investor in the market bought their coins, and hence, the realized cap may be looked at as a measure of the total capital that holders have put into the cryptocurrency.

When this model is divided by the total number of coins in circulation, the average cost basis or acquisition price in the market is obtained. This is precisely what the realized price is.

If the Bitcoin spot price goes below this indicator, it means that the average investor has gone underwater. Similarly, breaks above the metric signify a return to profits for the majority of the market.

The realized price can also be defined for specific segments of the market. In the context of the current discussion, one part of the market is of relevance: the “short-term holders” (STHs).

Here is a chart that shows the trend in the Bitcoin realized price for this cohort:

Bitcoin Short-Term Holders Realized Price

The STHs include all investors who bought their coins within the last 155 days. The holders that pass beyond this threshold are termed “long-term holders” (LTHs).

From the chart, it’s visible that with the latest decline, the Bitcoin spot price has come very close to the STH realized price. This would suggest that these investors as a whole are about breaking even on their investment currently.

In the chart, the quant has highlighted how previous retests of this line have gone in this year so far. Interestingly, both back in March and June, the cryptocurrency found support at this metric and observed a sharp rebound.

This is a trend that has historically been seen during bullish periods. The reason behind this curious pattern may perhaps be the fact that the STHs look at their cost basis as a profitable point for accumulating more of the asset in such periods, as they believe that the price would only go up in the near future.

The extraordinary buying pressure at the line may be why the asset finds support at this level as well. This is because the opposite happens during bearish periods, as holders look to escape the market at their break-even point.

It now remains to be seen how Bitcoin’s interaction with the STH realized price will go this time around. Naturally, a successful retest would be a positive sign for the rally, as it would show that these investors haven’t yet lost their bullish conviction in the coin.

BTC Price

At the time of writing, Bitcoin is trading around $28,500, down 3% in the last week.

Bitcoin Price Chart

Bitcoin Drops Under $29,000, Here’s Where BTC Could Find Support Next

Bitcoin has plunged below the $29,000 level during the past day. According to on-chain data, here’s the next level that could act as major support.

Bitcoin Short-Term Holder Realized Price May Be The Next Support Level

As pointed out by an analyst in a CryptoQuant post, the realized price of the short-term holders at $28,000 could be an essential level for the asset. The “realized price” here refers to the cost basis (that is, the buying price) of the average investor in the Bitcoin market.

Whenever the price of the asset dips below this level, it means that more than 50% of the investors are now underwater. Similarly, a break above the point implies that the overall market has entered into a state of profits.

In the context of the current discussion, the realized price of the entire market isn’t of relevance, but rather of a specific segment of it: the “short-term holders” (STHs).

This investor group typically only includes holders who bought their BTC within the last six months. Here is a chart that shows the trend in the average cost basis for this Bitcoin cohort over the history of the cryptocurrency:

Bitcoin Realized Price

Historically, the Bitcoin STH realized price has had some interesting interactions with the spot price of the asset. First is the interactions during bullish periods, which the quant has highlighted in the above graph.

It would appear that during these rallies, the price has usually remained above the level. But not just that, the STH realized price has actually actively provided support to it in such periods.

In the rally during the past year, too, a similar trend has been seen, as both during the March and June price drawdowns, the cryptocurrency rebounded when it made a retest of this line.

Psychologically, investors view their cost basis as a profitable buying opportunity during bullish periods, as they believe that the price will only go up from here. So, whenever the asset returns to its cost basis in such periods, they are likely to accumulate again.

This extraordinary buying pressure at the level of the STHs could perhaps explain why Bitcoin finds support here. In a similar way, the level acts as resistance during bearish periods, as investors start looking at their acquisition price as the ideal exit opportunity.

From the chart, it’s visible that the Bitcoin spot price is approaching the STH realized price once again right now. This level, which is valued at $28,000 currently, could possibly be where Bitcoin can turn around its recent trend of decline.

The analyst warns, however, “if the realized price of short-term holders fails to hold, the bull market may be over.”

BTC Price

At the time of writing, Bitcoin is trading around $28,900, down 1% in the last week.

This Bitcoin Support Line Is Still Active, Bullish Signal?

On-chain data shows the cost basis of the 1-3 months old Bitcoin investors has continued to provide support to the price recently.

Bitcoin Has Once Again Bounced Off This Support Line

As pointed out by an analyst in a CryptoQuant post, if this line doesn’t break, then BTC should be able to continue its bullish momentum. The relevant indicator here is the “realized price,” which is a metric derived from a Bitcoin capitalization model called the realized cap.

The realized cap calculates the total value of the cryptocurrency by assuming that each individual coin in the circulating supply is worth the same as the price at which it was last moved (which is unlike the market cap, which just uses the current spot price for this purpose).

When this model is divided by the total number of coins in circulation, the “realized price” emerges. The significance of this indicator is that it’s the price at which the average investor in the market bought their coins.

While this realized price is for the entire market, the metric can also be defined for only parts of the sector. In the context of the current discussion, the group of interest is the one with the investors who have been holding their coins since between 1 month and 3 months ago.

Here is a chart that shows the trend in the Bitcoin realized price for this particular group:

Bitcoin Realized Price

The 1-3 months cohort is part of the “short-term holder” (STH) group, which is one of the two main divisions of the Bitcoin market. The STHs include all investors that have been holding onto their coins since less than 155 days ago.

As displayed in the above graph, the realized price of the 1-3 months group has been constantly going up recently. This trend naturally makes sense, as the price of the cryptocurrency has also been rising in the same period.

Since these BTC investors only acquired their coins within the last 3 months, their cost basis would obviously follow the trend in the asset’s price, albeit with a bit of lag.

What’s interesting, however, is the line’s interaction with the price. From the chart, it’s visible that the cryptocurrency’s price was finding resistance here while the bear market was going on.

The likely reason behind this pattern may have been that these investors, who would be in losses for the majority of the time in the bear market, would participate in mass selling whenever the price would touch their average cost basis (that is, their realized price), as it would appear as the ideal exit opportunity in such a period since they would at least be able to avoid losses that way.

Since the start of the rally this year, though, the pattern seems to have flipped, as the realized price of the 1-3 months cohort has been providing support to the asset.

It would appear that these investors are currently looking at their cost basis as a profitable buying opportunity since they probably believe that the price would go up in the near future.

Right now, the realized price of this group is around $26,600, which is the level that Bitcoin bounced off from yesterday. As the line still seems to be holding as support, this segment of the STHs looks to have not lost their bullish conviction yet.

BTC Price

At the time of writing, Bitcoin is trading around $27,300, down 1% in the last week.

Bitcoin Price Chart

This Highly Profitable Bitcoin Cross Has Just Formed Again

On-chain data shows that a Bitcoin cross that has proved quite profitable has once again formed for the cryptocurrency.

Bitcoin Realized Price Of Short-Term Holders Overtakes Long-Term Holders

As an analyst in a CryptoQuant post explained, the realized price of the 1 to 3 months holders has just exceeded that of the 6 to 12 months investors.

The “realized price” here refers to a metric derived from the “realized cap,” which is a capitalization model for Bitcoin that assumes a coin’s true value is the price at which it was last transacted on the blockchain rather than the current BTC price as the usual market cap says.

The realized price is obtained when the realized cap is divided by the total number of coins in circulation. Since the realized cap accounted for the prices at which the investors acquired their coins (their “cost basis”), the realized price represents the average acquisition price in the market.

This means that whenever the Bitcoin price dips below this metric, the average cryptocurrency investor holds assets at a loss. Similarly, a break above implies a transition towards profits for the average investor.

In the context of the current discussion, the realized price of three specific segments of the market is relevant; the holders who bought between 1 month and 3 months ago, 3 months and 6 months ago, and 6 months and 12 months ago.

The first two of these are parts of the “short-term holder” (STH) cohort, while the third one is part of the “long-term holder” (LTH) group. Here is a chart that shows the trend in the Bitcoin realized price specifically for these segments of the market:

Bitcoin Realized Price

As shown in the above graph, an interesting pattern formed during the leadup to the 2021 bull run. First, the realized price of the 1-month to 3 months cohort exceeded that of the 6- 12 months group. Following this crossover, BTC saw some sharp uptrend, but it didn’t last long.

Then, as this price increase winded down, the 3- 6 months segment also crossed above this LTH cohort. These crossovers implied that fresh purchases were happening in the market as the rally built up. Since the prices were rising during this leadup, the STHs had to buy at higher and higher prices, which is why their realized price went up and eventually became higher than the LTHs’.

After these crossovers were completed, the BTC bull run ramped up. Recently, the first of these crossovers seem to be forming again, as the realized price of the 1-month 3 months group is now equal to that of the 6 months to 12 months band.

While it’s uncertain if the second crossover will also go and take shape now, Bitcoin could observe at least some bullish momentum from this initial cross alone (assuming that it’s not just a fake-out), just like it did back in 2020.

BTC Price

At the time of writing, Bitcoin is trading around $29,800, up 1% in the last week.

Bitcoin Price Chart

Repeat Of April 2019? Bitcoin Rally Shows Similar Break Above These Key Levels

On-chain data shows Bitcoin has broken above these three key levels in a manner reminiscent of the rally in April 2019.

Bitcoin Breakout Shows Initial Similarities To April 2019 Rally

According to data from the on-chain analytics firm Glassnode, BTC has broken above the three investor cost-basis levels for the first time since the COVID-19 crash and the 2018-2019 bear market. The relevant indicator here is the “realized price,” to understand the concept of the “realized cap” it needs to be looked at first.

The realized cap is a capitalization model for Bitcoin that assumes that each coin in the circulating supply has its real value as the price at which it was last moved rather than the current BTC price (which the normal market cap uses for its calculation).

Now, from the realized cap, a “realized price” can be obtained by dividing the metric by the total number of coins in circulation. Since the realized cap accounted for the prices at which investors bought their coins (which is to say, their cost basis), the realized price can be thought of as the average acquisition price in the market.

This means that if the normal price of Bitcoin dips below this indicator, the average holder can be assumed to have entered a state of loss. While this realized price is the average cost basis for the entire market, the metric can also be defined for only specific groups of investors.

The BTC market can be divided into two primary cohorts: short-term holders (STHs) and long-term holders (LTHs). Investors who bought their coins within the last 155 days fall into the STHs, while those holding them since before that threshold are included in the LTHs.

Here is a chart that shows the trend in the Bitcoin realized price for the entire market, as well as for these two holder groups separately, over the last few years:

Bitcoin Realized Price

As the above graph shows, Bitcoin had broken above the STH cost basis and the entire market’s realized price earlier in the latest rally, suggesting that the average STH and the overall average investor was back in profit.

In the most recent continuation to the rally, the crypto has now surged above the LTH cost basis of $22,400. This means that the average investor in every segment is now in the green.

The last time Bitcoin displayed a breakout above all these levels was following the black swan COVID-19 crash, which had briefly taken the coin below these prices.

A similar trend also formed in April 2019, when the bear market of that cycle ended, and a bullish transition took place. Though it’s early to tell right now, this similarity between the two rallies could hint about the path that the current one might also end up following.

BTC Price

At the time of writing, Bitcoin is trading around $22,900, up 8% in the last week.

Bitcoin Price Chart

59% of Bitcoin Holders Are Sitting On Profits

59% of Bitcoin holders are profitable as the coin trades above the current Realized Price, which is the cost basis of the average BTC holder, IntoTheblock data on January 19, shows.

Parallel on-chain streams show that the realized price of Bitcoin is around $19,700. Comparing this number with the spot BTC price presently at over $20,700, it means 59% of coin holders are sitting on profits, a net positive for the ecosystem.

This development is a shot in the arm for HODLers, considering the sharp contraction of prices over the past few months. Then BTC plunged from around $69,000 in November 2021 to slightly over $15,000 in 2022.

Bitcoin Price chart Chart: TradingView.com

On-chain data are crunched in real-time, and analysts interpret them to gauge the state of the market. Their interpretation, in turn, could massively influence sentiment and determine how retail traders act based on price action.

Related Reading: Bitcoin Price: Investors Predict 12% Decline For BTC In Next Two Weeks

As BTC prices react from $21,600 posted earlier this week, on-chain statistics show more than half of BTC holders are in green. Only 38% of market participants are out of the money.

Bitcoin holders in the money

Most Bitcoin Holders Have Been In The Red

Even as BTC appears to recover, there must be a comprehensive breakout to solidify and revive demand. Based on the recent Bitcoin price action, most holders appear to be in the green after an extended period of losses.

Realized Price

Trackers show that holders have been in losing territory since mid-August 2022.  The situation only worsened in subsequent months when fear, uncertainty, and doubt (FUD) swept across the crypto and BTC markets, forcing the coin even lower. This draw-down was because of the unexpected collapse of FTX, a cryptocurrency exchange, and Alameda Research, a trading firm closely associated with the Sam Bankman-Fried exchange.

By early November, BTC had dropped by over 65% from 2021 peaks, highlighting the level of apprehension across the board, pushing the Realized Price even lower. 

Realized Versus Market Price

Realized Price is a metric that measures the price of all BTC currently in supply at the rate they were bought. The value obtained is then divided by the BTC in the circulating supply.

The result gives an “average cost basis” which is then used to describe the Realized Price. It is different from the spot market price because the latter indicates Bitcoin’s current price based on real-time supply and demand. Like any other asset, BTC prices are massively determined by market forces, with the “hype” element, describing sentiment, another factor to consider.

Related Reading: Overbought Or Ready To Rip? Bitcoin Daily RSI Reaches Explosive Levels

That more than half of Bitcoin holders are profitable at spot rates is important. Realized Price helps judge the overall economic state of the Bitcoin market. How this metric fluctuates versus the market price tells whether BTC holders are buoyant or distressed. In technical analysis, the Realized Price can be used to mark resistance or support levels.

Technically, whenever the Realized Price exceeds the Market Price, it indicates some BTC holders are in profit. If it drops below Market Price, then on aggregate, a section of market participants is in red. Profitability depends on the price level they bought.

Here’s Why $22,400 Could Be The Next Major Level To Break For Bitcoin

As Bitcoin continues its strong rally, $22,400 could be the level to watch next, if this on-chain metric is anything to go by.

Bitcoin Long-Term Holder Realized Price Is Currently Around $22,400

According to the latest weekly report from Glassnode, BTC broke through all three realized prices of the market back in April 2019. To understand the concept of “realized price,” the realized cap needs to be looked at first. The realized cap is a capitalization model for BTC that values each coin in circulation at the price it was last transacted.

This is different from the usual market cap, which puts the value of all tokens at the same current price of Bitcoin. When the market cap is divided by the total number of coins in circulation, the BTC price is obtained, a fact that isn’t unexpected at all, as the market cap is calculated by multiplying the price by the number of coins to start with.

However, if this same idea is applied to the realized cap (that is if it’s divided by the number of coins), a sort of “realized price” can be derived. The significance of this price is that it’s the cost basis of the average holder in the Bitcoin market.

The implication of this is that if the (normal) price of BTC declines under this realized price, the average investor can be thought to have entered into a state of loss.

All investors in the market can be divided into two major cohorts: the “short-term holders” (STHs) and the “long-term holders” (LTHs). The former includes investors who acquired their coins less than 155 days ago, while the latter consists of holders who have been holding their coins for more than that period.

Now, here is a chart that shows the trend in the realized price for the entire Bitcoin market, as well as that for the STHs and LTHs, over the last five years:

Bitcoin Long-Term Holder Cost Basis

As shown in the above graph, the BTC price had been below all three of these realized prices for much of the bear market, suggesting that the average Bitcoin investor in all the cohorts was carrying an unrealized loss.

However, in the most recent rally, the crypto has so far managed to break above the STH cost basis ($18,000), as well as that of the entire market ($19,700). The LTH realized price of about $22,400 is yet to be reached by the coin.

A similar rally took place back in April 2019, which marked the end of the 2018-2019 bear market. But in that rally, Bitcoin managed to rise above all three of the realized prices.

If a similar transition is truly taking place in this bear market as well, then the $22,400 level could be the one to watch for next, as a break above it could imply a return towards a bullish regime.

BTC Price

At the time of writing, Bitcoin is trading around $21,100, up 22% in the last week.

Bitcoin Price Chart

Bitcoin Now Under Realized Price For 163 Days, Here’s How This Compares Historically

On-chain data shows Bitcoin has now been below its realized price for 163 days in this bear market; here’s how this compares with previous cycles.

Bitcoin Realized Price Is Currently Valued At Around $19,900

According to CryptoQuant’s year-end dashboard release, the bear market would be over if BTC reclaims this level. To understand what the “realized price” is, the “realized cap” must be looked at first. The realized cap is a capitalization model for Bitcoin that aims to provide a sort of “real value” for the crypto.

Unlike the usual market cap, which simply values each coin in circulation using the current BTC price, the realized cap prices each token at the same price it was last moved. For example, if 1 BTC was bought at $20,000, but the price has now changed to $16,000, the market cap will consider it valued at $16,000. The realized cap, however, will say its true value is $20,000.

Now, if the total realized cap of Bitcoin is divided by the total number of coins in circulation, a “realized price” is obtained. This price signifies the cost-basis of the average coin in the market (that is, the price at which investors acquired the average coin at). Here is a chart that shows the trend in the BTC realized price over the entire history of the asset:

Bitcoin Realized Price

As the above graph displays, the normal price of Bitcoin has been below the realized price for a while now. Historically, BTC has spent very little time in this region, as only the worst phases of a bear market usually pull the coin below the level.

From the chart, it’s apparent that In the 2011-2012 bear market, BTC spent 158 days under the realized price. Then, in 2014-2015, the coin spent a whopping 276 days in this zone.

The 2018-2019 bear saw the shortest amount of time in the region, as the price took 134 days to pull itself above the level. Finally, Bitcoin has been trapped under the realized price for 163 days in the current cycle.

This means that BTC has spent more time in this region in the current bear market than in any other before, except for 2014-2015. If the current bear is comparable to 2014-2015, then it would mean there is still more than 100 days to go before Bitcoin can exit the zone.

Either way, CryptoQuant expects the crypto to reclaim this level somewhere in 2023, and it will be then that this bear may be considered to be over.

BTC Price

At the time of writing, Bitcoin’s price floats around $16,600, down 1% in the last week.

Bitcoin Price Chart

Bitcoin Now Trading 24% Below Realized Price, How Deeper Can It Go?

On-chain data shows Bitcoin is now trading 24% below the realized price, here’s how much deeper the crypto went during historical cycles.

Bitcoin Has So Far Declined 24% Under The Realized Price

As pointed out by an analyst in a CryptoQuant post, drawdowns below the realized price have been shrinking with each cycle.

A popular capitalization model for Bitcoin is the “realized cap,” which measures the cap by weighting each coin in the circulating supply against the price at which it was last moved.

This is different from the usual market cap, where every coin in circulation is simply multiplied with the latest BTC price.

Now, from this realized cap, a “realized price” can be derived by dividing the metric with the total number of coins in circulation.

The usefulness of this price is that it signifies the cost basis of the average holder in the Bitcoin market. This means that whenever the normal price dips under this indicator, the average investor enters into a state of loss.

Here is a chart that shows the percentages below the realized price BTC has gone during each cycle:

Bitcoin Realized Price

Looks like the value of the metric has plunged in recent days | Source: CryptoQuant

As you can see in the above graph, the latest crash in the price of Bitcoin has taken the crypto 24% below the realized price, the deepest value observed in the current cycle so far.

It’s apparent from the chart that the previous bear market of 2018/19 saw an even larger drawdown, as the price had declined about 30% below the metric at the bottom.

Comparing the two cycles in isolation would suggest the current bear market still needs to see a notable amount of decline before the same bottom values are hit.

However, things change when the 2015 and 2012 bottoms are also taken into account. In 2012, Bitcoin went as low as 60% below the realized price, while in 2015 the decline was around 41%.

There seems to be a pattern here, and it’s that the percentage of fall below the indicator has been shrinking with each cycle.

If this trend continues to hold this time as well, then Bitcoin may in fact already be near a bottom for this cycle.

BTC Price

At the time of writing, Bitcoin’s price floats around $16.5k, down 1% in the last week. Over the past month, the crypto has lost 14% in value.

The below chart shows the trend in the price of the coin over the last five days.

Bitcoin Price Chart

The crypto continues to show stale price movement | Source: BTCUSD on TradingView
Featured image from Traxer on Unsplash.com, charts from TradingView.com, CryptoQuant.com