Bitcoin Coinbase Premium Is Negative: What It Means For Price Recovery

Data shows the Bitcoin Coinbase Premium Gap is currently negative. Here’s what this could mean for the asset’s recent attempt at recovery.

Bitcoin Coinbase Premium Gap Has Been Deep Red Recently

An analyst in a CryptoQuant Quicktake post pointed out that the Coinbase Premium Gap has been negative recently. The “Coinbase Premium Gap” here refers to an indicator that tracks the difference between the Bitcoin prices listed on cryptocurrency exchanges Coinbase (USD pair) and Binance (USDT pair).

When the value of this metric is positive, it means that the price listed on Coinbase is greater than that on Binance right now. Such a trend implies that the former platform is currently witnessing a higher buying pressure or a lower selling pressure than the latter.

On the other hand, the negative indicator suggests Coinbase is witnessing relatively high selling pressure as the price listed here is lower than on Binance.

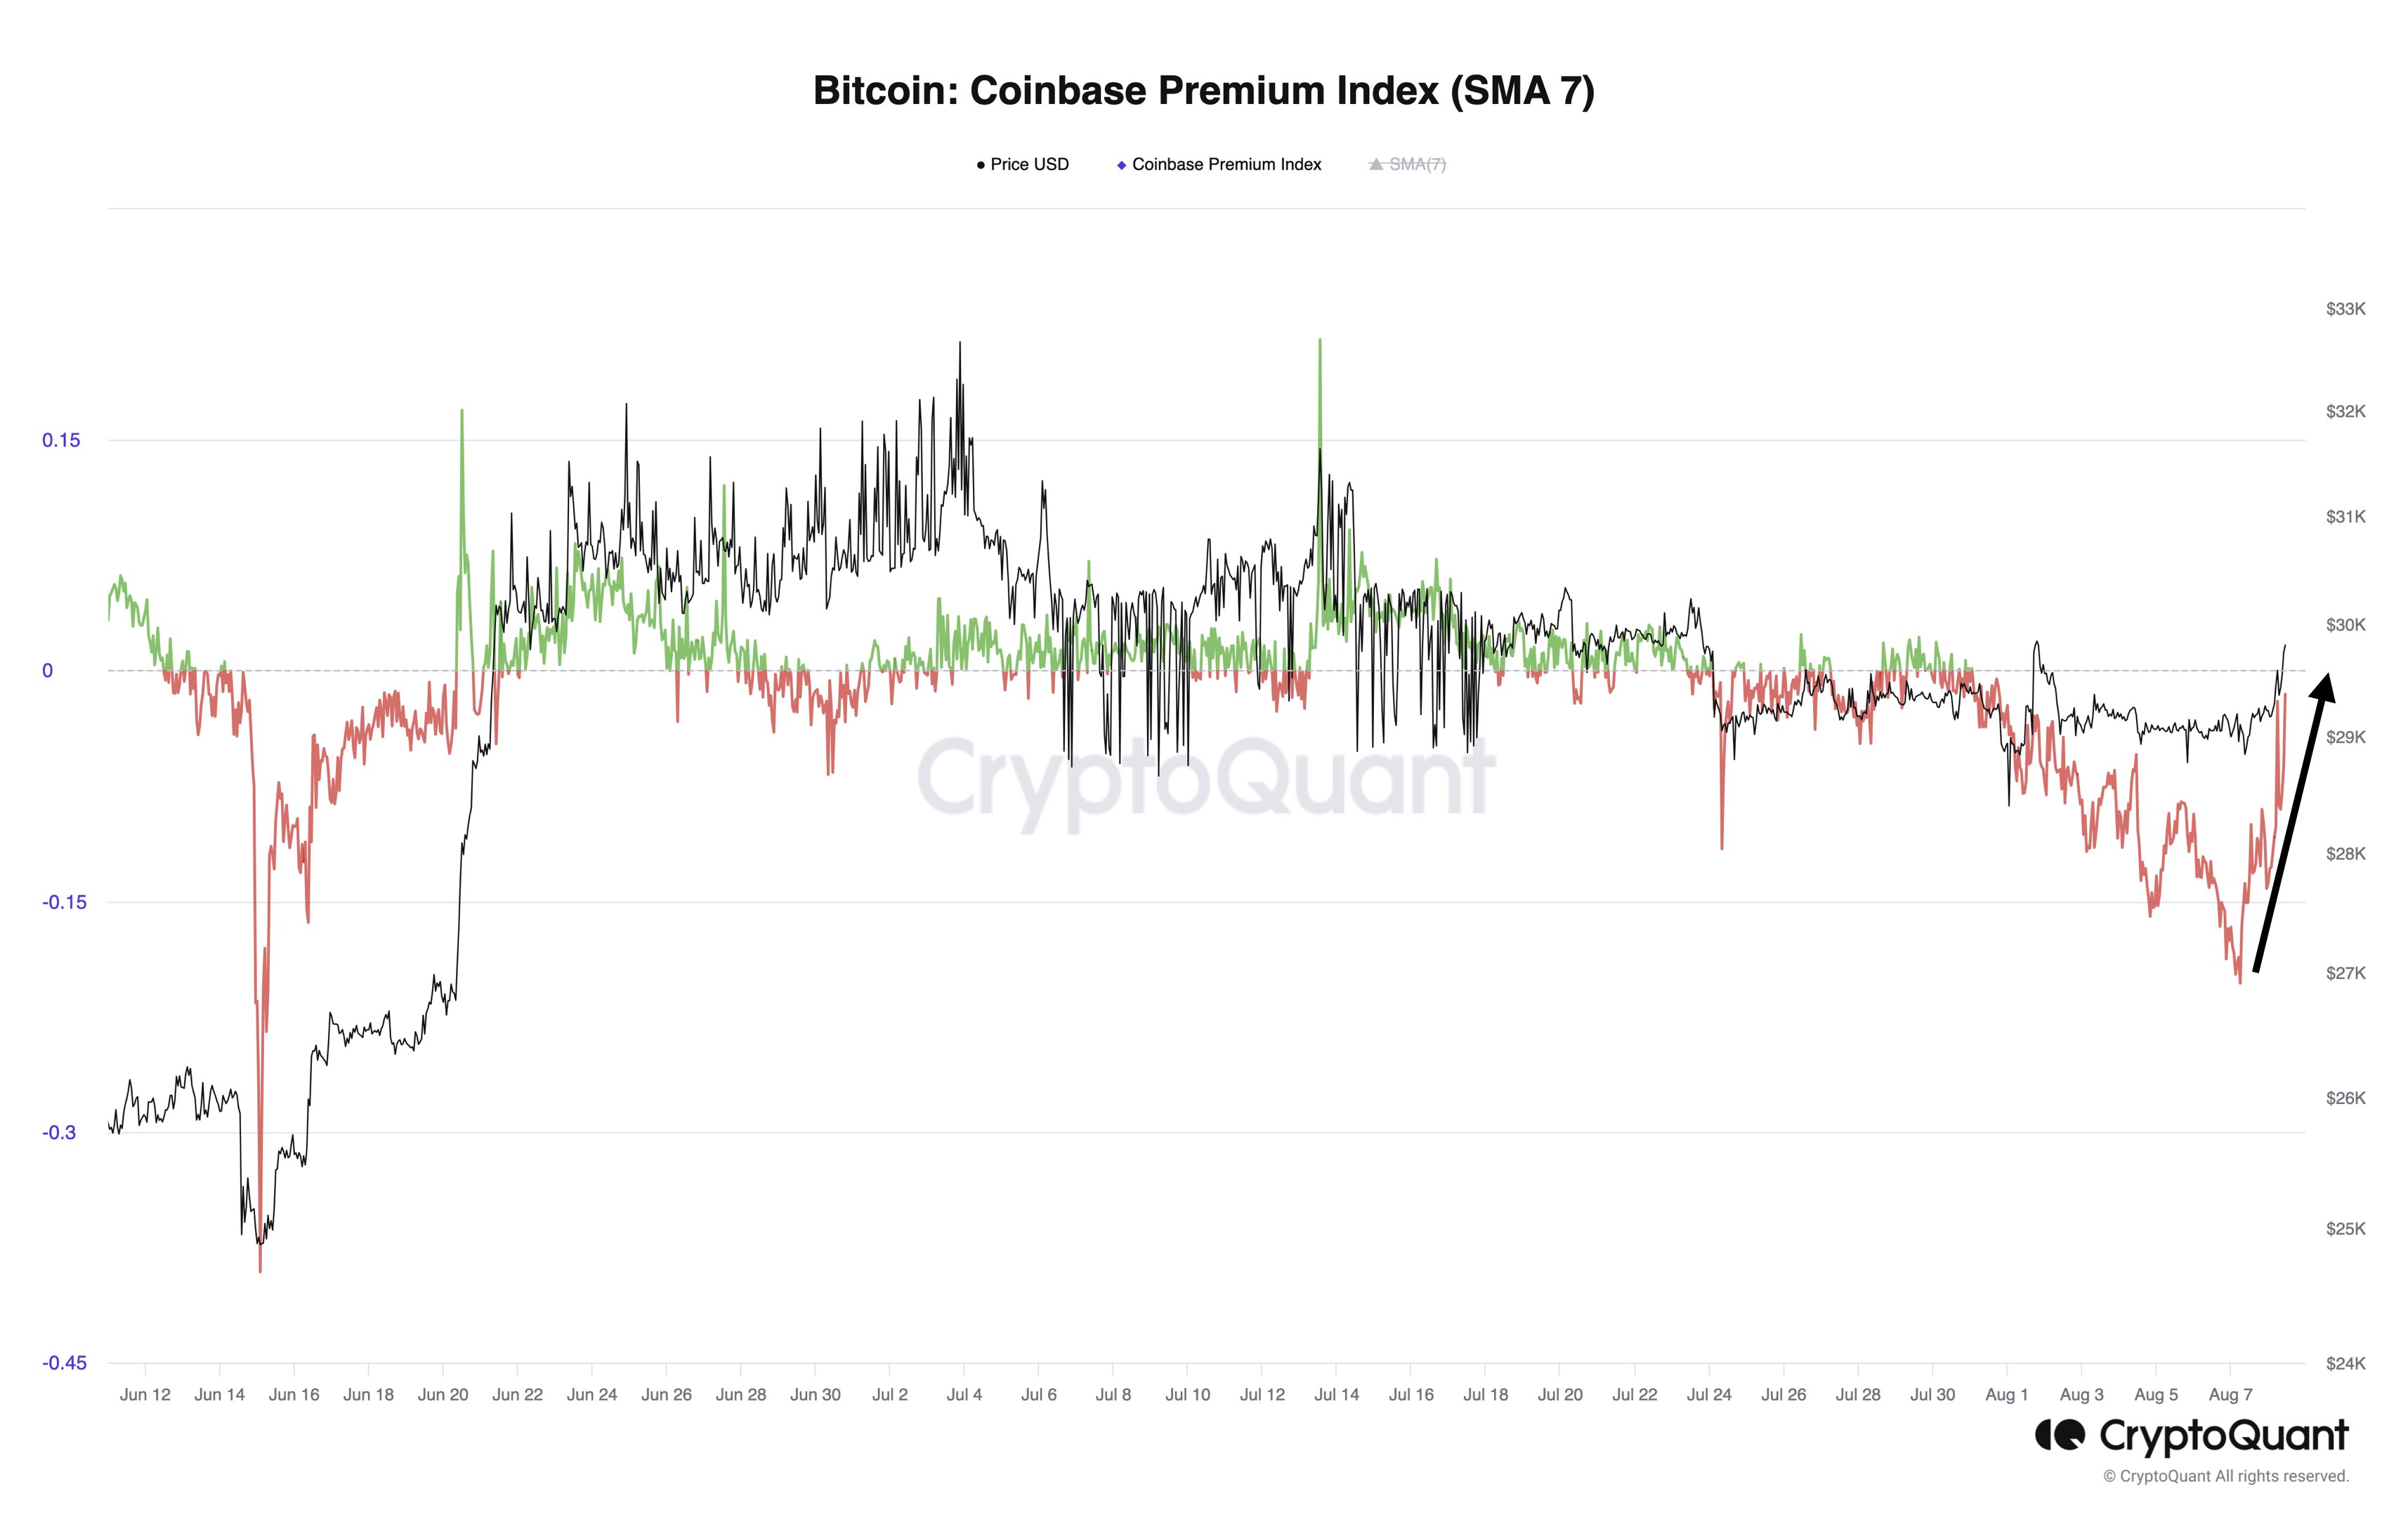
Now, here is a chart that shows the trend in the Bitcoin Coinbase Premium Gap over the last few years:

Bitcoin Coinbase Premium Gap

As displayed in the above graph, the Bitcoin Coinbase Premium Gap has plunged into negative values recently, implying that the selling pressure on Coinbase has risen.

Earlier, the metric had a notable positive streak, and this run coincided with a rally in the cryptocurrency’s price. The asset fell as the indicator flipped towards red, suggesting increased selling pressure may have contributed.

US-based institutional investors commonly use Coinbase, while Binance has a more global audience. As such, the Premium Gap can provide hints about American whales’ buying or selling behavior.

It would appear that these institutional players were buying during the recent rally, but as soon as they switched towards selling, the price suffered for it. The last bull market also saw significant buying pressure from these investors, while the bear market saw the indicator restricted to negative or neutral levels.

Bitcoin has been trying to recover from its recent drawdown, but from the chart, it’s apparent that the Coinbase Premium Gap is still at deep red values.

Thus, the fact that large American investors are falling behind in buying pressure may not bode well for this recovery attempt if the recent pattern followed by the metric is anything to go by.

BTC Price

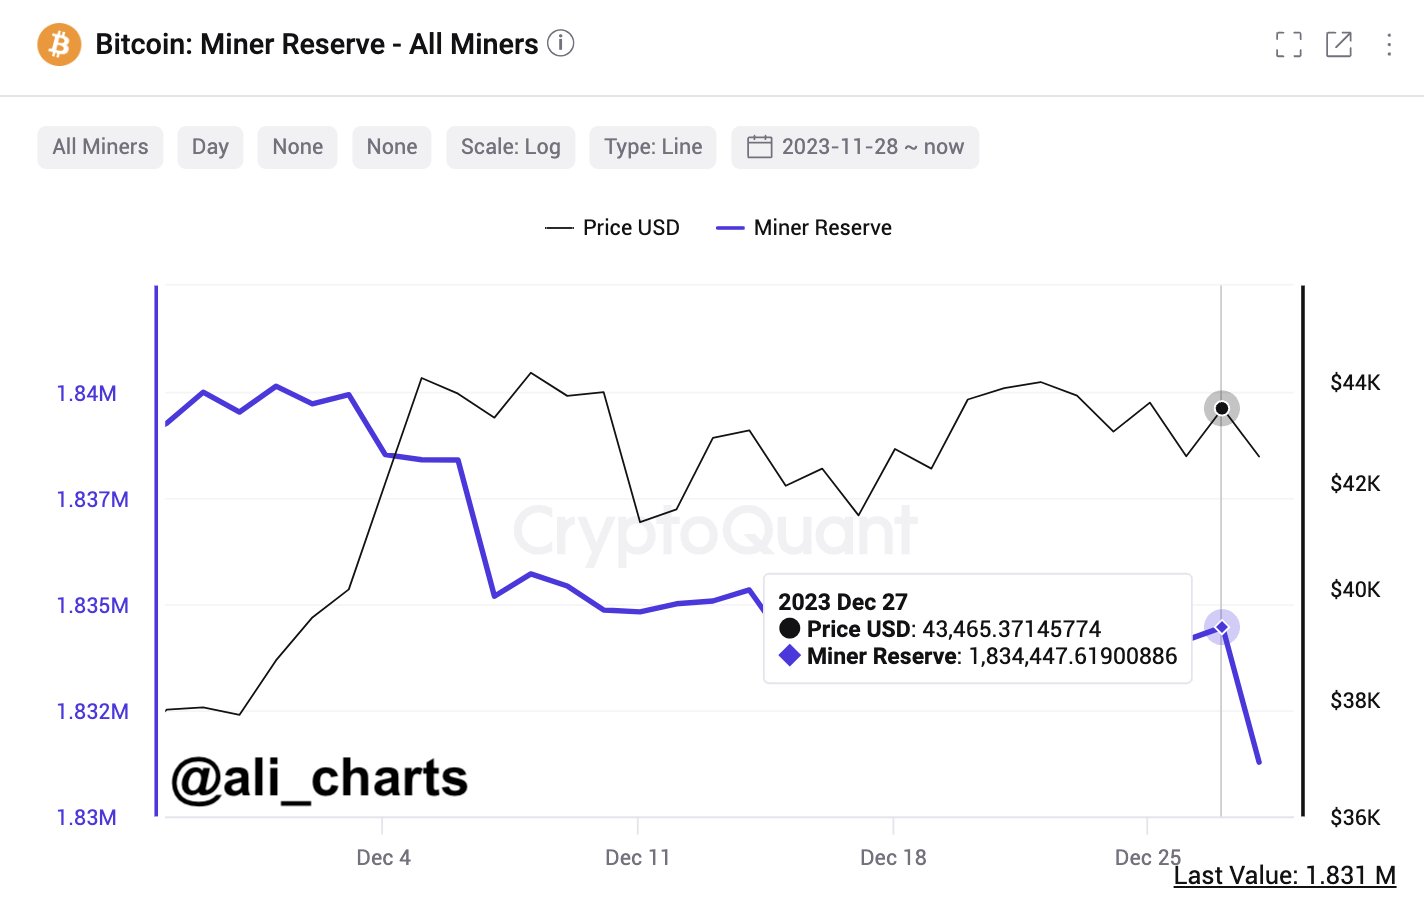
Since the visit below the $39,000 level, Bitcoin has seen a notable rebound below the $43,000 mark. The chart below shows how the coin has performed over the past month.

Bitcoin Price Chart

This recovery has stood so far, but given the negative Coinbase Premium Gap, the cryptocurrency may encounter some resistance soon.

Analyst Says “Rapid Price Recovery” Is Likely For Bitcoin, Here’s Why

An analyst has explained that a Bitcoin price recovery may be highly likely based on this pattern forming in a metric.

Bitcoin Coinbase Premium Gap Is Becoming Less Negative

In a CryptoQuant Quicktake post, an analyst pointed out how the selling pressure on Coinbase has been diminishing recently. The relevant indicator here is the “Coinbase Premium Gap,” which keeps track of the difference between the Bitcoin prices listed on cryptocurrency exchanges Coinbase and Binance.

When the value of this metric is positive, it means that the price listed on Coinbase is greater than that on Binance right now. Such a trend suggests either the buying pressure on the former is higher or the selling pressure is lower.

On the other hand, negative values imply the buying pressure on Binance may be greater as the price of the cryptocurrency listed there is higher.

Now, here is a chart that shows the trend in the Bitcoin Coinbase Premium Gap over the last couple of weeks:

Bitcoin Coinbase Premium Gap

Between the start of the month and around the time the Bitcoin spot ETFs went live, the Coinbase Premium Gap had remained optimistic, implying that buying pressure on the exchange had been stronger.

The exchange is popularly known to be used by US institutional investors, so it’s possible that the positive premium was due to these large entities constantly accumulating in the leadup to the ETFs.

The chart reveals that the Coinbase Premium Gap took a sharp plunge into negative territory once this event was over, implying that the American holders significantly increased their selling pressure.

Coinciding with this negative spike, Bitcoin observed its first major post-ETF plunge. This event started the indicator’s extended run inside the red zone, a sharp contrast to its trend in the year thus far.

Almost a week after this first crash, the cryptocurrency registered another sharp plummet, and with this drawdown, too, the selling pressure on Coinbase went up.

During the past few days, BTC has experienced another wave of price drops, but this time, the Coinbase Premium Gap hasn’t reached highly negative values. Instead, the indicator even briefly revisited the neutral mark during this plunge.

This would imply that the selling pressure from the US institutional traders may now be weakening. While they are still likely selling, the degree of their selling isn’t much higher than that of the global investors who use Binance.

“In the current range, there is a high likelihood of a rapid price recovery,” the analyst says, based on this pattern that has taken shape in the Coinbase Premium Gap.

BTC Price

Following the latest drawdown, Bitcoin has broken under the $39,000 level for the first time since the start of December.

Bitcoin Price Chart

Bitcoin Erases Recovery As Miners Cash Out 3,000 BTC

On-chain data shows the Bitcoin miners have participated in a 3,000 BTC selloff recently, something that may explain the asset’s latest pullback.

Bitcoin Miner Reserve Has Taken A Plunge Recently

As pointed out by analyst Ali in a new post on X, the BTC miners have participated in some selling recently. The indicator of interest here is the “miner reserve,” which keeps track of the total amount of Bitcoin sitting in the wallets of all miners.

When the value of this metric goes up, it means that the miners are receiving a net number of coins in their addresses right now. Such a trend suggests that these chain validators are choosing to accumulate the asset currently, which can naturally have bullish effects on the price.

On the other hand, a decline implies that this cohort is transferring coins out of their wallets at the moment. Generally, the miners make such outflows when they are looking to sell their BTC, so this kind of trend can have bearish implications for the cryptocurrency.

Now, here is a chart that shows the trend in the Bitcoin miner reserve over the past month:

Bitcoin Miner Reserve

As displayed in the above graph, the Bitcoin miner reserve has registered a sharp drop during the past couple of days. During this withdrawal spree, these chain validators transferred out more than 3,000 BTC from their wallets, worth around $128 million at the current exchange rate.

Bitcoin had recovered to the $43,800 level earlier after news had come out about Microstrategy completing another substantial purchase. As the miners made these outflows, though, the cryptocurrency witnessed a drawdown towards the $42,000 mark.

Given the timing, it would appear possible that the miners had made these transfers to cash in on the recovery and this extra selling pressure may have contributed to the decline that the asset ended up seeing.

Miners are a group that has to pay constant operating costs in the form of electricity bills, so they regularly sell some of the BTC they mine and earn from transaction fees in order to cover these expenses.

More often not, though, the miners only participate in relatively low levels of selling, which is readily absorbed by the market and the cryptocurrency doesn’t feel too much impact

This time around, though, these chain validators have sold a sizeable amount inside a narrow window, which is potentially why Bitcoin has appeared to have been affected.

In some other news, the market intelligence platform IntoTheBlock has revealed the average holding time on the Bitcoin blockchain and how it compares against other networks.

Bitcoin Holding Time

As is visible above, Bitcoin holders carry their coins for 4.3 years on average, which is far greater than what Cardano (ADA) and Avalanche (AVAX) blockchains observe.

While miners don’t tend to HODL because of their running costs, it would appear that the normal investors on the BTC network are more than making up for it by holding for very extended periods.

BTC Price

The market doesn’t seem to be too discouraged after the drop due to the selling pressure from the miners, as Bitcoin is now once again making a recovery push. So far, BTC has climbed back to the $42,900 level.

Bitcoin Price Chart

Bitcoin Coinbase Premium Surges, Recovery Being Driven By US Investors?

Data shows the Bitcoin Coinbase Premium Index has recently seen a surge, a sign that buying from US investors may contribute to the recovery.

Bitcoin Coinbase Premium Index (7-Day SMA) Has Been Going Up Recently

According to data shared by Julio Moreno, the Head of Research at CryptoQuant, the Coinbase Premium Index has been sharply trending up recently. The “Coinbase Premium Index” here refers to a metric that keeps track of the percentage difference between the Bitcoin price listed on Coinbase (USD pair) and that listed on Binance (USDT pair).

This metric can help us know which platform’s user base is buying or selling more of the asset. For example, when the index’s value is greater than zero, it means that an extra amount of buying pressure has been present on Coinbase, which has pushed the asset’s price up on the platform (or just a lower amount of selling pressure than on Binance is there on Coinbase).

Coinbase is known to be used more heavily by US-based investors (especially large institutional traders), while Binance’s traffic is spread around the globe.

Thus, if more buying is happening on Coinbase, it can be a sign that the US-based investors are participating in more buying than the global traders.

Now, here is a chart that shows the trend in the 7-day Simple Moving Average (SMA) Bitcoin Coinbase Premium Index over the past couple of months:

Bitcoin Coinbase Premium Index

As displayed in the above graph, the 7-day SMA Bitcoin Coinbase Premium Index has only been negative this month, implying that the global investors have either outpaced the US traders in accumulation or the Americans have been selling to a higher degree.

Recently, however, as news has started to come out that the probability of the BTC spot ETFs being approved in the US is increasing, the indicator has turned around and is now heading up.

The metric has sharply increased in the past day, suggesting that the US-based institutional traders may now be participating in some heavy buying.

During this same period, Bitcoin has observed a recovery rally in which the cryptocurrency’s price briefly managed to touch the $30,000 mark before falling back to the current levels.

Naturally, the timing of the rally and the 7-day Coinbase Premium Index sharply going up could imply that the buying from the American holders are providing the fuel for the move.

The Grayscale Bitcoin Trust (GBTC) Premium, a metric that checks for whether GBTC is trading at a premium or a discount, has also been trending up recently, implying that the discount on the fund is decreasing (although it’s not near the positive territory yet unlike the Coinbase Premium Index).

Image

GBTC is a fund that allows users to get indirect exposure to Bitcoin in a way that traditional investors would be more familiar with. Thus, this metric holds hints about the buying or selling activity in which the more conventional US institutional traders are currently participating.

BTC Price

At the time of writing, Bitcoin is trading around $29,800, up 1% in the last week.

Bitcoin Price Chart

Bitcoin Shows Recovery: Did This Historical Line Act As Support Again?

Bitcoin on-chain data suggests a historical support line may have helped the coin once again as the asset has recovered toward $28,000 today.

Bitcoin Short-Term Holder Cost Basis May Still Be Active As Support

According to data from the on-chain analytics firm Glassnode, the BTC price approached the cost basis of the short-term holders recently. The relevant indicator here is the “realized price,” which is a metric derived from the “realized cap.”

The realized cap refers to a capitalization model for Bitcoin that says that the value of each coin in the circulating supply is not the current spot price, but the price at which it was last transacted on the blockchain.

In this way, the model accounts for the price at which each investor acquired their coins. That is, their “cost basis.” When the realized cap is divided by the number of coins in circulation (to find a sort of average value), the aforementioned realized price emerges.

Related Reading: Bitcoin Exchange Inflows Mostly Coming From Loss Holders, Weak Hands Exiting?

This realized price signifies the average value at which each holder in the market bought their coins. The metric can also be defined for only partial segments of the market, like the “short-term holders” (STHs), in which case, the indicator will tell us about the average cost basis among this group only.

The STHs are all those investors who bought their coins less than 155 days ago. The BTC holders outside this group are termed the “long-term holders” (LTHs).

Now, here is a chart that shows the trend in the Bitcoin realized price for the STHs over the past couple of years:

Bitcoin Short-Term Holder Realized Price

In the above graph, Glassnode has marked the various instances where the Bitcoin STH realized price has apparently interacted with the spot price of the asset. Back when the 2021 bull run topped out in November, the cryptocurrency’s value dropped below this indicator, signaling a change of trend.

From this point on, as the bear market took over, the STH cost basis started providing resistance to the asset. Back in January of this year, though, the price finally managed to break through this resistance as the rally began to take place.

Related Reading: Bitcoin Bulls Push BTC Back Up To $28K Amid Surging Address Activity

This break lead to another change in the wider trend, as the line seemingly turned into support for the asset. However, this isn’t an unusual pattern, as bullish periods have historically observed the metric helping the price.

Recently, Bitcoin found some struggle, as the price plunged towards the $26,000 level. The consolidation near this level meant that the price was fast approaching the STH realized price, which was slowly going up.

When Glassnode posted the chart yesterday, it described this current state as a “decision point” for the market. According to the analytics firm, a successful retest here would be a sign of strength in the bullish trend, while failure would imply weakness.

Over the past day, Bitcoin has enjoyed a rebound, with the price briefly breaking above the $28,000 level. But it may perhaps not be a coincidence that the uplift has come right as the price was nearing a retest of this historical level.

Naturally, a sustained move away from the STH realized price now would confirm that the level is still active as support, a sign that would be positive for the rally’s sustainability.

BTC Price

At the time of writing, Bitcoin is trading around $27,900, up 4% in the last week.

Bitcoin Price Chart

Bitcoin Marks One Month Of Negative Funding Rates, More Decline Incoming?

Bitcoin funding rates had first fallen below the neutral level last month. Before that, the funding rates had been fluctuating at and below neutral for the longest time. This new trend has lasted longer than expected as the digital asset’s price continues to struggle. In this report, we take a look at the state of bitcoin funding rates as well as the implications if the present trend continues.

Funding Rates Below Neutral

When bitcoin funding rates had first fallen below neutral in June, the price of the digital asset was still trading well above $30,000. Since then though, multiple crashes and dips have seen the cryptocurrency lose more than $10,000 of its value and continue to struggle to hold above its previous cycle peak.

Related Reading | Mid Cap Crypto Coins Lead In July, Best Way To Weather The Winter?

However, despite the minor upward corrections that have been recorded since then, the funding rates have refused to budge. At the time of this writing, the funding rates have now spent a complete month with below neutral numbers.

Binance and Bybit are some of the most prominent platforms when it comes to calculating funding rates and the last time the crypto exchanges had seen funding rates in the neutral level since bitcoin’s fall from $30,000 had been in mid-June. Instead, the funding rates have begun to mirror the movement of price and have not recovered since then. 

Funding rates remain below neutral | Source: Arcane Research

This comes despite a surge in the bitcoin open interest last week which reached a new all-time high. So the funding rates have deviated from the open interest and are now following the low yield rates that are being recorded in the market. 

Will Bitcoin Recover?

With bitcoin’s price above $20,000 once more, there has been some positive sentiment returning to the market. However, it remains shaky given that there is not a lot of support left at this point and the price can easily be pulled down by the bears.

This is why the decline in the bitcoin funding rates remains a concern. Naturally, the funding rates are expected to see an increase when the price of the digital asset has declined as much as it has. But the opposite has been the case so far, meaning that there is not a lot of new money coming into the space, if any.

BTC recovers just below $21,000 | Source: BTCUSD on TradingView.com

For a prominent recovery in bitcoin’s price, an uptick in funding rates would need to be seen. When sentiment picks up among perp traders, the broader market is sure to follow. 

Related Reading | Bitcoin Price Spends Four Weeks At 2017 Peak Prices, What Comes Next?

Additionally, the inflation rate from the CPI report on Wednesday was higher than expected. While that has resulted in a spike in the price of bitcoin, it has been a short one. For this to hold, the market needs to see more buying momentum.

Featured image from CNBC, charts from Arcane Research and TradingView.com

Follow Best Owie on Twitter for market insights, updates, and the occasional funny tweet…

Bitcoin Recovery Slows Down As Whale Inflows Remain Elevated

The latest recovery rally in the price of Bitcoin has now slowed down as on-chain data shows signs of dumping from whales.

Bitcoin Exchange Whale Ratio Continues To Be At High Values

As pointed out by an analyst in a CryptoQuant post, BTC whales are sending their coins to exchanges at the moment.

The “exchange whale ratio” is an indicator that measures the ratio between the sum of the top ten transactions to exchanges and the total Bitcoin exchange inflows.

In simpler terms, this metric tells us how the whale transactions (that is, the ten biggest transfers) compare with the total amount going into exchanges.

If the value of this ratio is high, it means whales are making up for a large part of the inflows right now. Such a trend can be a sign of dumping from these whales, and thus can be bearish for the crypto’s price.

Related Reading | Two Months Of Extreme Fear Leaves Crypto In Panic, Bitcoin At $20K

On the other hand, low values of the indicator imply whales are making up a healthy part of the inflows currently. This trend can prove to be either neutral or bullish for the value of BTC.

Now, here is a chart that shows the trend in the Bitcoin exchange whale ratio over the last few months:

The 72-hour MA value of the metric seems to have been high recently | Source: CryptoQuant

As you can see in the above graph, the Bitcoin exchange whale ratio has stayed at pretty high values in recent days.

Generally, the indicator’s value remains less than 0.85 during bull markets, while it stays at higher values than that in bear market periods.

Related Reading | Bitcoin Rejected At $21K, Why A Retest Of The Lows Could Be Positive

The current value of the ratio is above 0.90, which means more than 90% of the exchange inflow is from the ten largest transactions right now. This can be a hint that whales are dumping at the moment.

Bitcoin attempted a recovery rally over the last few days after hitting the low below $18k, but the run has now slowed down as the value of the coin now looks to be moving sideways.

This halt in the move may possibly be because of selling from whales that the exchange whale ratio is signaling right now.

BTC Price

At the time of writing, Bitcoin’s price floats around $20.7k, down 2% in the last seven days. Over the past month, the crypto has lost 31% in value.

The below chart shows the trend in the price of the coin over the last five days.

Looks like the value of the crypto has been consolidating sideways over the past few days | Source: BTCUSD on TradingView
Featured image from Fábio Hanashiro on Unsplash.com, charts from TradingView.com, CryptoQuant.com

Bitcoin Recovery Wades Off Celsius Liquidation, But For How Long?

The price of bitcoin has made a remarkable recovery above $20,000 after a brutal week riddled with crashes. These dips had driven decentralized finance (DeF)/ lending protocol Celsius, to the brink of liquidation. However, as the price has recovered, the platform is once again able to hold out for longer as its liquidation point is now a bit further away. The question remains if the recovery will hold and if Celsius will be able to avoid liquidation.

Liquidation Price Pushed Back

With the price of bitcoin above $20,000, the liquidation price of Celsius is now a little bit distant. This has not changed the sentiment around the lending protocol though, which has now suspended withdrawals for 7 days at this point. Its liquidation price still remains firmly at $14,000 but the company has assured the community that it continues to work to rectify the issues.

Celsius had first announced the transfer and withdrawal freeze last Monday citing unstable market conditions as the reason behind the move. Even with the recent recovery, the lending protocol remains at risk of liquidation, and as such withdrawals and transfers remain frozen.

Related Reading | Bitcoin Funding Rates Remain Negative But Open Interest Tells Another Story

In its most recent communique with the public, Celsius has said that it is working with officials to find a suitable resolution to its issues. “As has been a priority since our company’s inception, we maintain an open dialogue with regulators and officials,” said Celsius. “We plan to continue working with regulators and officials regarding this pause and our company’s determination to find a resolution.”

 However, if history is anything to go by, then it is very unlikely that investors will be able to withdraw their funds. Speculations in the space remain largely in the camp of eventual bankruptcy especially given the Three Arrows Capital (3AC) debacle.

BTC recovers above $20,000 | Source: BTCUSD on TradingView.com
Will Bitcoin Keep Recovering?

The current trajectory for bitcoin points towards more recovery to come but that it is only if this turns out to be a legitimate recovery and not a bull trap. This would essentially see the price test the $21,000 resistance level before the end of the trading day.

Related Reading | Don’t Expect A Bitcoin Recovery Anytime Soon, Galaxy Digital CEO

That said, the digital asset price is still trading below its 20-day moving average. While this can often point toward a buying opportunity, it can also show that investors are not willing to put money into the market at the prices they have over the last two weeks.

Market sentiment is also in extreme fear, pointing to even more wariness among investors. If the sentiment were to turn along with prices, then the market could see more buying pressure, which could see the uptrend continue.

Bitcoin is trading at $20,731 at the time of this writing. It remains the world’s largest cryptocurrency with a market cap of $396 billion.

Featured image from Vulcan Post, chart from TradingView.com

Follow Best Owie on Twitter for market insights, updates, and the occasional funny tweet…

Anthony Scaramucci Urges Bitcoin Holders To Think Long-Term As Downtrend Won’t Last

The bitcoin downtrend has no doubt rocked investors to their core. This is evidenced by the decline of the Fear & Greed Index into the extreme fear territory, reaching as low as 11 on the scale. Investors, understandably, are wary of the market and what the next few weeks, and by extension, months, may hold for them. If this is the beginning of a bear market, then there could be another two-year wait to the next bull rally.

Anthony Scaramucci has however urged bitcoin investors not to despair during this time. Despite the market crash that sent the digital asset to six-month lows, Scaramucci, who is the CEO of Skybridge Capital, has told investors to look towards the long-term when investing in bitcoin.

The Bitcoin Crash Is Temporary

The CEO was on CNBC’s Squawk Box to talk about the crypto market. In this interview, Scaramucci shared some insight into how he viewed the market and the current crash, which he does not believe is a cause for alarm. He urged bitcoin buyers to take some time to cool off from the market, advising them to look toward long-term investing instead of what the market is doing right now.

Related Reading | Has Bitcoin Reached Its Bottom? Analyst Says It Still Has A Long Way To Go

Holding bitcoin for the long-term has always been the mantra of bitcoin maximalists, who believe more in the future of the digital asset than what it is doing in the present. Scaramucci has resonated with this in his latest advice. The CEO explained that bitcoin investors need to buy the digital asset for the long-term, as well as other cryptocurrencies which he expects to do well in the future.

BTC trading north of $37,000 | Source: BTCUSD on TradingView.com

Scaramucci pointed to the fact that a lot of investors say that they are invested in the long-term but yet are fazed by what happens in the short term. “Everyone is a long-term investor until you have short-term losses, and then you start freaking out,” said the CEO. “Take a chill pill, stay long bitcoin, other cryptocurrencies like Algorand and Ethereum, and I think you’re going to be very well-served long-term in those investments,” he advised investors.

Forget The Dollar, BTC Is BTC

Currently, the value of bitcoin is derived from how much it sells when compared to the dollar. This is how investors measure their holdings and how well they are doing in the market. However, Scaramucci rejects this idea of valuing bitcoin in terms of dollar figures and urges investors to just look at the digital asset for what it is; bitcoin. For the CEO, BTC is BTC and the dollar is the dollar.

Related Reading | Bitcoin Whales Take Advantage Of Market Crash To Gobble Up Millions In BTC

He revealed that he tells clients of his investment firm SkyBridge Capital to invest in cryptocurrencies as long as they size it appropriately. “I don’t want my clients to miss this. I’m telling them to size it appropriately — that’s a 1% to 3% allocation, 1% to 4% at cost.” This is because the CEO believes that cryptocurrencies like bitcoin are inevitably going to be a part of the future.

Scaramucci also advised investors who get overly excited when they are investing in the market. He supports the idea of putting a small percentage of an investment portfolio into cryptocurrencies but cautioned against trying to lever digital assets like bitcoin due to its high volatility and the uncertainty that still clouds the digital asset. “It would be like levering Amazon back in 1998, ’99 and 2000,” the CEO warned.

Featured image from Vanity Fair, chart from TradingView.com