Bitcoin Forms Death Cross & TD-9 Sell Signal: Brace For Impact?

An analyst has explained how Bitcoin is forming both a death cross and TD sell signal, which may lead to potential dips in these targets.

Bitcoin Looking In Trouble As 12-Hour Chart Forms Two Bearish Signals

In a new post on X, analyst Ali discussed two signals that have recently formed in Bitcoin’s 12-hour chart. The first of these is a “death cross,” which occurs when an asset’s short-term simple moving average (SMA) dips below its long-term SMA.

Regarding the death cross, the 50-day and 100-day SMAs make up for the short-term and long-term trend lines. Historically, such formations have been considered bearish signals, with the price potentially suffering once the pattern is confirmed.

The other signal that has appeared for the cryptocurrency involves the Tom Demark (TD) Sequential. This indicator is popularly used for finding locations of probable tops and bottoms in any asset’s price.

The TD Sequential has two phases: the “setup” and “countdown.” The first phase, the setup, is said to be complete once the asset has gone through nine candles of the same polarity. After these nine candles, the price may have reached a likely reversal point.

Naturally, if the candles in the setup’s formation were red, then the signal would be a buy one, while if the prevailing trend were bullish, the reversal would be towards the downside.

Once the setup is complete, the countdown phase begins. This phase works much like the setup, except that candles are counted up to thirteen instead of nine. After the countdown’s completion, the commodity may be assumed to have reached another potential top/bottom.

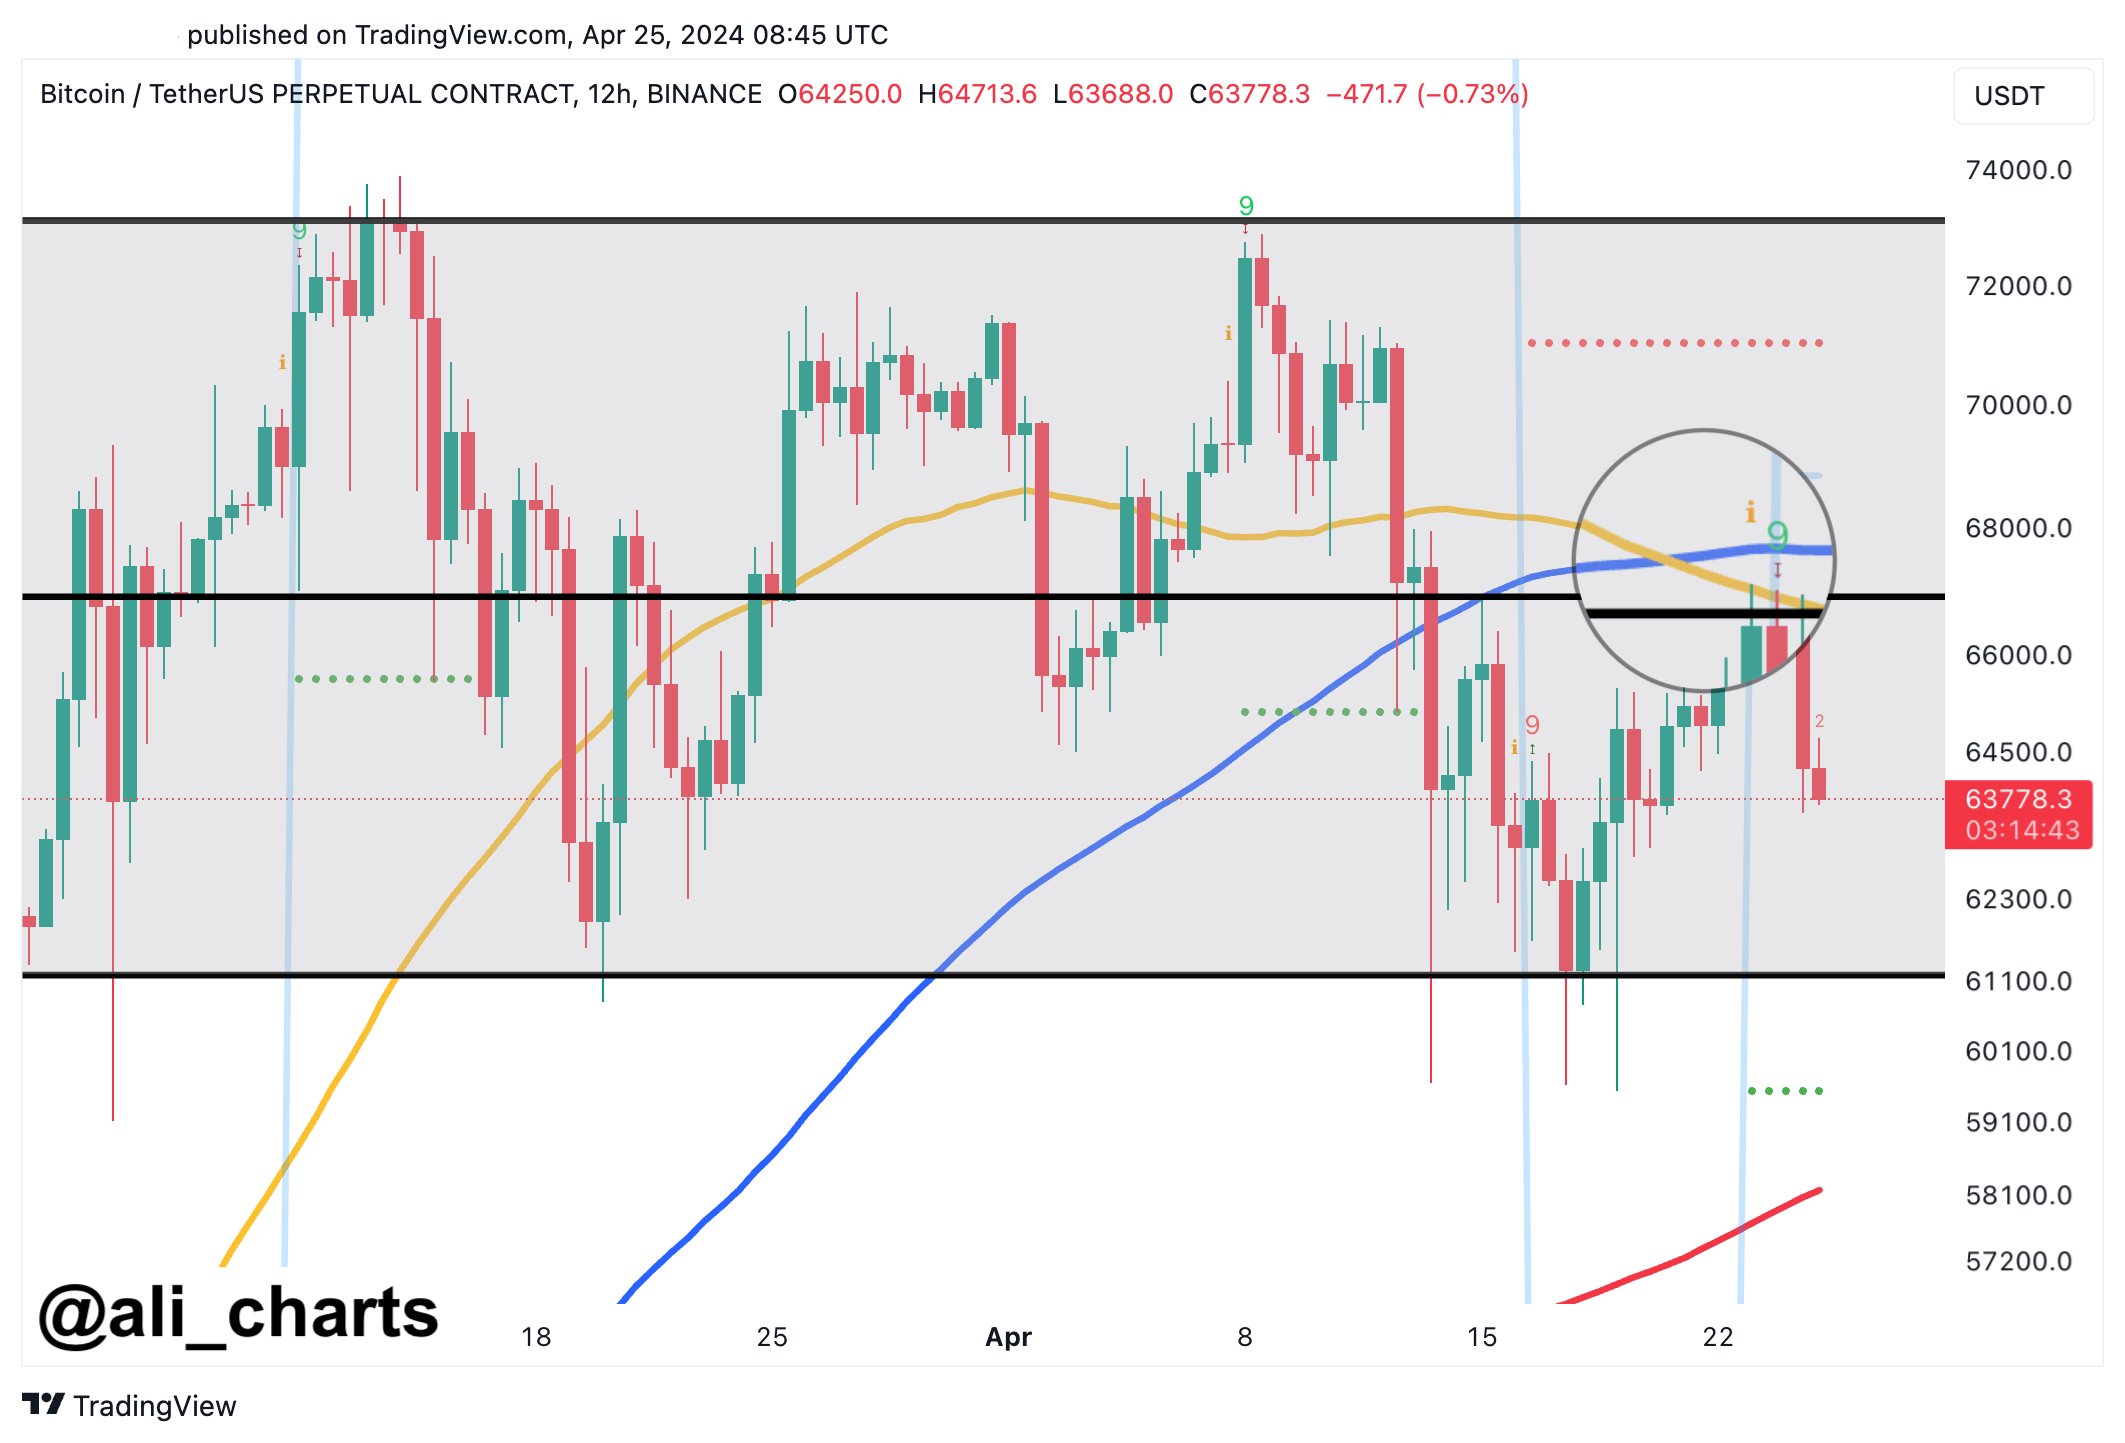
Now, here is the chart shared by Ali that highlights how signals about both of these technical analysis patterns have been witnessed in the 12-hour price of Bitcoin recently:

Bitcoin Death Cross & TD-9 Sell

As is visible in the graph, the 12-hour price of Bitcoin first saw a death cross form with the 50-day SMA moving under the 100-day SMA. Then, it observed the completion of a TD Sequential setup, with the indicator suggesting a reversal to the downward direction.

Since this double bearish pattern has appeared, BTC has been heading down, suggesting that these signals may already be in effect. “If BTC falls below $63,300, brace for possible dives to $61,000 or even $59,000,” says the analyst.

From the current price of the cryptocurrency, a potential drawdown to the first of these targets would mean a decline of 4.6%, while one to the latter level would suggest a drop of nearly 8%.

BTC Price

So far, Bitcoin has managed to prevent falls under the $63,300 target listed by the analyst, as it currently floats around $64,000.
Bitcoin Price Chart

Start Selling Bitcoin When This Happens, This Quant Says

A quant has explained that the past pattern in the Bitcoin taker buy-sell ratio metric may suggest the best window to start selling the asset.

Bitcoin Taker Buy Sell Ratio May Reveal Selling Opportunities

In a CryptoQuant Quicktake post, an analyst discussed the trend in the Bitcoin “taker buy sell ratio.” This indicator keeps track of the ratio between the Bitcoin taker buy and taker sell volumes.

When the value of this metric is greater than 1, the investors are willing to purchase coins at a higher price right now. Such a trend implies a bullish sentiment is the dominant force in the market.

On the other hand, the indicator being under the mark suggests the selling pressure may be higher than the current buying pressure in the sector. As such, the majority may share a bearish mentality.

Now, here is a chart that shows the trend in the 30-day moving average (MA) Bitcoin taker buy-sell ratio over the last few years:

Bitcoin Taker Buy Sell Ratio

As the above graph shows, the 30-day MA Bitcoin taker buy-sell ratio has recently fallen below the 1 level. The quant has highlighted in the chart the region of the metric where the bull run peaks in 2021 formed.

The indicator would appear to dip below 0.97 during both the heights registered in that bull run. According to the analyst, such indicator values suggest the euphoria phase of the market where the smart money starts to sell. Still, the prices continue to hold on as the retail investors continue to FOMO into the asset.

So far, the indicator has approached the 0.98 level in its latest decline, implying that it’s not yet at the levels where the possibility of a top might become significant if the pattern of the previous bull run is anything to go by.

The Bitcoin taker buy sell ratio may also be used as a buying signal, with the 1.02 level being an important level. The quant notes, however, that the metric is better at showing an overbought market than it is for pinpointing oversold conditions.

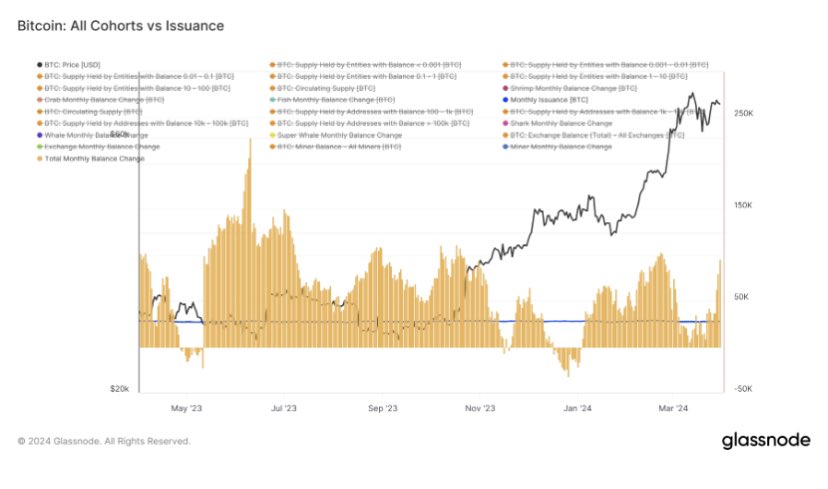
In other news, as an analyst pointed out in a post on X, all the Bitcoin investor groups have accumulated a net amount of 95,000 BTC ($6.5 billion at the current exchange rate) over the past month.

Bitcoin Accumulation

This rapid accumulation suggests that the Bitcoin investor groups have been buying up significantly more than the miners have produced. The chart shows that an accumulation streak of similar levels followed the recent rally in the asset, so this latest one can also be bullish for the asset.

BTC Price

At the time of writing, Bitcoin is trading at around $68,600, up more than 3% over the past week.

Bitcoin Price Chart

95% Of Bitcoin Now In Profit: Why This Could Be A Signal To Sell

On-chain data shows the Bitcoin supply in profit has reached levels that led to some tops in the past, like the peak of the April 2019 rally.

Bitcoin Supply In Profit Has Shot Up Following BTC’s Latest Run

As pointed out by an analyst in a CryptoQuant Quicktake post, Bitcoin supply in profit has hit very high levels after the asset’s latest rally. The “supply in profit” here refers to a metric that measures the percentage of the total circulating BTC supply that’s currently carrying some amount of unrealized gain.

This indicator works by going through the transaction history of each coin (more precisely, each UTXO) on the blockchain to see what price it was last moved at. Assuming that the previous transfer of the coin was the last time it changed hands, the price at that instance would act as its current cost basis.

As such, if the previous transfer price for any coin was less than the spot value of the cryptocurrency right now, then that particular coin would be holding a profit currently. The supply in profit sums up all such coins and calculates what percentage of the total supply they make up for.

A counterpart indicator called the “supply in loss” does the same for coins of the opposite type (that is, those with a cost basis lower than the current price). This metric’s value can also simply be found by subtracting the supply in profit from 100 (since the total supply must add up to 100%).

Now, here is a chart that shows the trend in the Bitcoin supply in profit over the past few years:

Bitcoin Supply In Profit

As displayed in the above graph, the Bitcoin supply in profit has naturally shot up recently as the asset’s price has gone through its rally. After the latest continuation of the run towards the $57,000 level, the metric has hit the 95% mark.

This means that 95% of all UTXOs in existence is carrying a profit at the moment. This may not entirely be a positive thing, however, if history is anything to go by.

As the quant has highlighted in the chart, the BTC rally that started in April 2019 topped out just as the supply in profit hit the same high levels as right now. Similarly, the local top in 2020 at the beginning of the last bull market also coincided with these levels.

The reason behind this pattern is likely to be the fact that investors in profit are more likely to sell their coins at any point. Thus, when a large percentage of holders are carrying gains, the probability of a mass selloff can spike up.

That said, in the 2017 and 2021 bull runs, as well as during the November 2021 peak, the indicator did manage to surpass these levels for a while before the top was encountered.

As such, it remains to be seen if the current rally is similar to the likes of the April 2019 run, in which case a top might be hit here, or if it’s a proper bull run, meaning that there might still be a while to go before the peak.

BTC Price

At the time of writing, Bitcoin is trading around the $56,500 level, up 8% over the past week.

Bitcoin Price Chart

Bitcoin Signal That Has Held Since December Says It’s Time To Sell

An analyst has explained that an indicator that has been holding for Bitcoin since December is now giving a sell signal for the cryptocurrency.

TD Sequential Is Providing A Sell Signal On Daily Bitcoin Chart Currently

In a new post on X, analyst Ali discussed a TD Sequential sell signal forming in the Bitcoin daily price chart. The “Tom Demark (TD) Sequential” is an indicator in technical analysis used for pinpointing locations of probable tops and bottoms in any asset’s price.

The TD Sequential has two phases. The first is called the “setup” and lasts nine candles. Once nine candles (of the same polarity) are in, the setup completes, and the indicator signals a likely reversal for the price.

The direction of such a reversal naturally depends on the type of candles that formed the setup. If these candles were green, the indicator would imply a top for the asset, while red candles would suggest a bottom.

When the setup finishes, the “countdown” phase begins. In this phase, candles of the same type are counted again, except for thirteen. Once the countdown also completes, another potential reversal could be assumed to have occurred for the price.

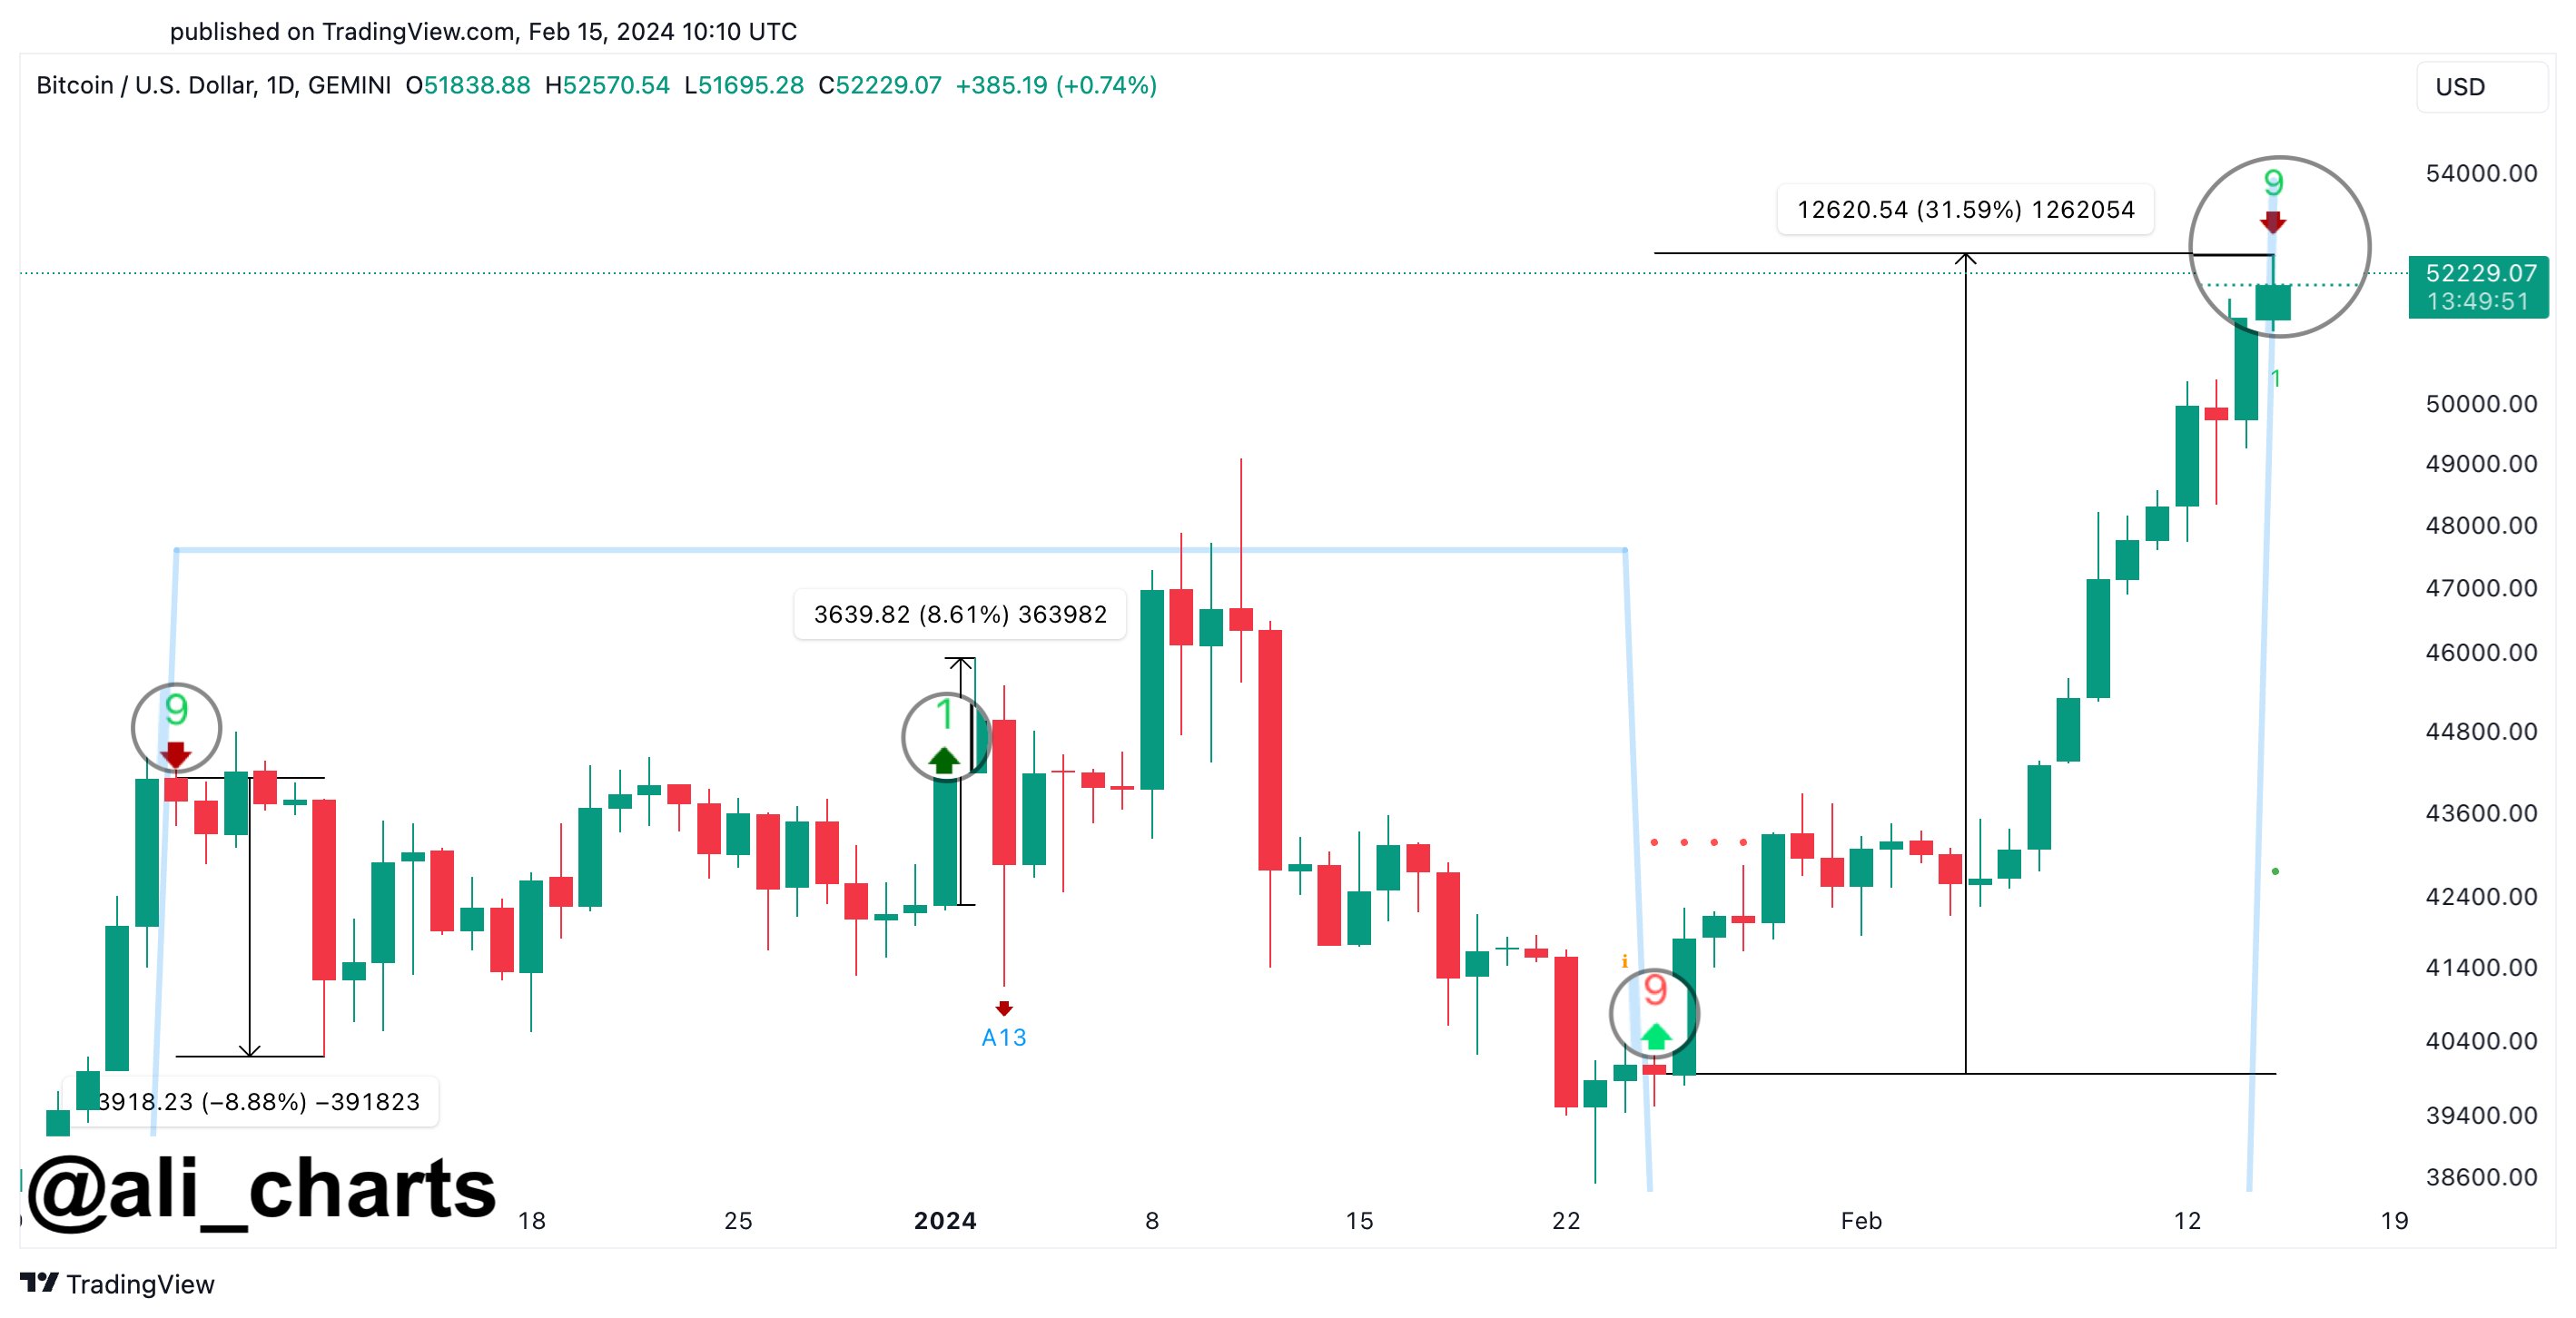
Recently, Bitcoin has finished a TD Sequential phase of the former type. Here is the chart shared by the analyst that shows this pattern forming in the daily price of the cryptocurrency:

Bitcoin Sell Signal

As is visible in the graph, the TD Sequential setup has recently finished with green candles for Bitcoin. These green candles have come for the coin as it has enjoyed some sharp bullish momentum, which has taken its price beyond the $52,000 mark.

The fact that the TD Sequential setup has formed with green candles suggests the indicator may now be providing a sell signal for the cryptocurrency’s price.

In the same chart, Ali highlighted the previous instances since December of last year where a setup was completed for the asset. It would appear that both TD Sequential buy and sell signals have held for the coin in this window.

Going by this pattern, the latest TD Sequential reversal signal might also hold for the asset. And as it’s a bearish one this time, the analyst expects a correction lasting for one to four daily candlesticks.

BTC Price

Bitcoin’s recent momentum has meant that the asset has been among the best performers in the sector, registering growth of around 16% during the past week.

Currently, the coin is hovering around the $52,500 level. The chart below shows the asset’s trajectory over the last month.

Bitcoin Price Chart