This Bitcoin Metric Foreshadowed Recent Price Drops, Quant Reveals

A quant has pointed out how a Bitcoin metric may have detected selling pressure in the market, and therefore, the subsequent price drops, in advance.

Bitcoin CDD Registered Spikes Before Recent Price Plunges

In a new post on X, an analyst has discussed about how the Coin Days Destroyed (CDD) on-chain indicator may be used to identify selling pressure in the market early.

A “coin day” refers to the quantity that 1 BTC accumulates after staying still on the blockchain for 1 day. When a token stays dormant for a while, it naturally accumulates some number of coin days, and once it’s finally transferred on the network, its coin days counter resets back to zero.

The coin days that this token had been carrying prior to this movement are said to be “destroyed” by the transaction. The CDD keeps track of the total number of such days being reset across the network on any given day.

Now, here is a chart that shows the trend in the CDD for Bitcoin over the last couple of months:

Bitcoin CDD

As displayed in the above graph, the Bitcoin CDD observed a large spike just a few days ago. Whenever this metric’s value shoots up, it means that a large amount of coins previously dormant are now on the move.

Such transfers are generally correlated with the long-term holder whales, who are large entities who carry their coins for significant periods, and thus, accumulate a large number of coin days.

Often, when these dormant entities finally break their silence, it’s for selling-related purposes. As such, spikes in the CDD can be an indication that the HODLer whales have decided to do some selling.

In the chart, the quant has highlighted the major spikes that the indicator observed during the last two months. It would appear that following the onset of such spikes, the asset’s price has generally gone on to witness some bearish action.

The aforementioned spike from a few days ago, too, has proven to be bearish for the asset so far as it occurred when Bitcoin had recovered towards $67,000, and the price has since erased this recovery. It would appear that some of these diamond hands had looked at this surge as an exit opportunity.

Last month, the CDD had seen two spikes even larger than this recent one. These spikes had occurred near what continues to be the top for the rally so far. Thus, the selling pressure from HODLers may have played a role in this top and the subsequent drawdown that followed.

Given the relationship that this metric has appeared to have held with the Bitcoin price, it may be worth keeping an eye on it, as it may continue to indicate the onset of selling pressure in the near future as well.

BTC Price

Bitcoin has continued its bearish trajectory during the past day as it has now slipped towards the $62,300 level.
Bitcoin Price Chart

Bitcoin Trader Selling Pressure Declining, CryptoQuant Head Explains Why

The head of research at the on-chain analytics firm CryptoQuant has explained why selling pressure from Bitcoin traders may be declining.

Bitcoin Short-Term Holder Realized Price Has Risen To $60,000

In a new post on X, CryptoQuant head of research Julio Moreno has discussed why the short-term holder selling pressure may be declining for BTC. The “short-term holders” (STHs) refer to the Bitcoin investors who have been holding onto their coins since less than 155 days ago.

The STHs include the “traders” of the market who make many moves within short periods and don’t tend to HODL their coins. This group can be quite reactive to market movements, easily panic selling whenever a crash or rally takes place.

Generally, investors in profits are more likely to sell their coins, so one way to gauge whether the STHs would be likely to take part in a selloff is through their profit/loss margin.

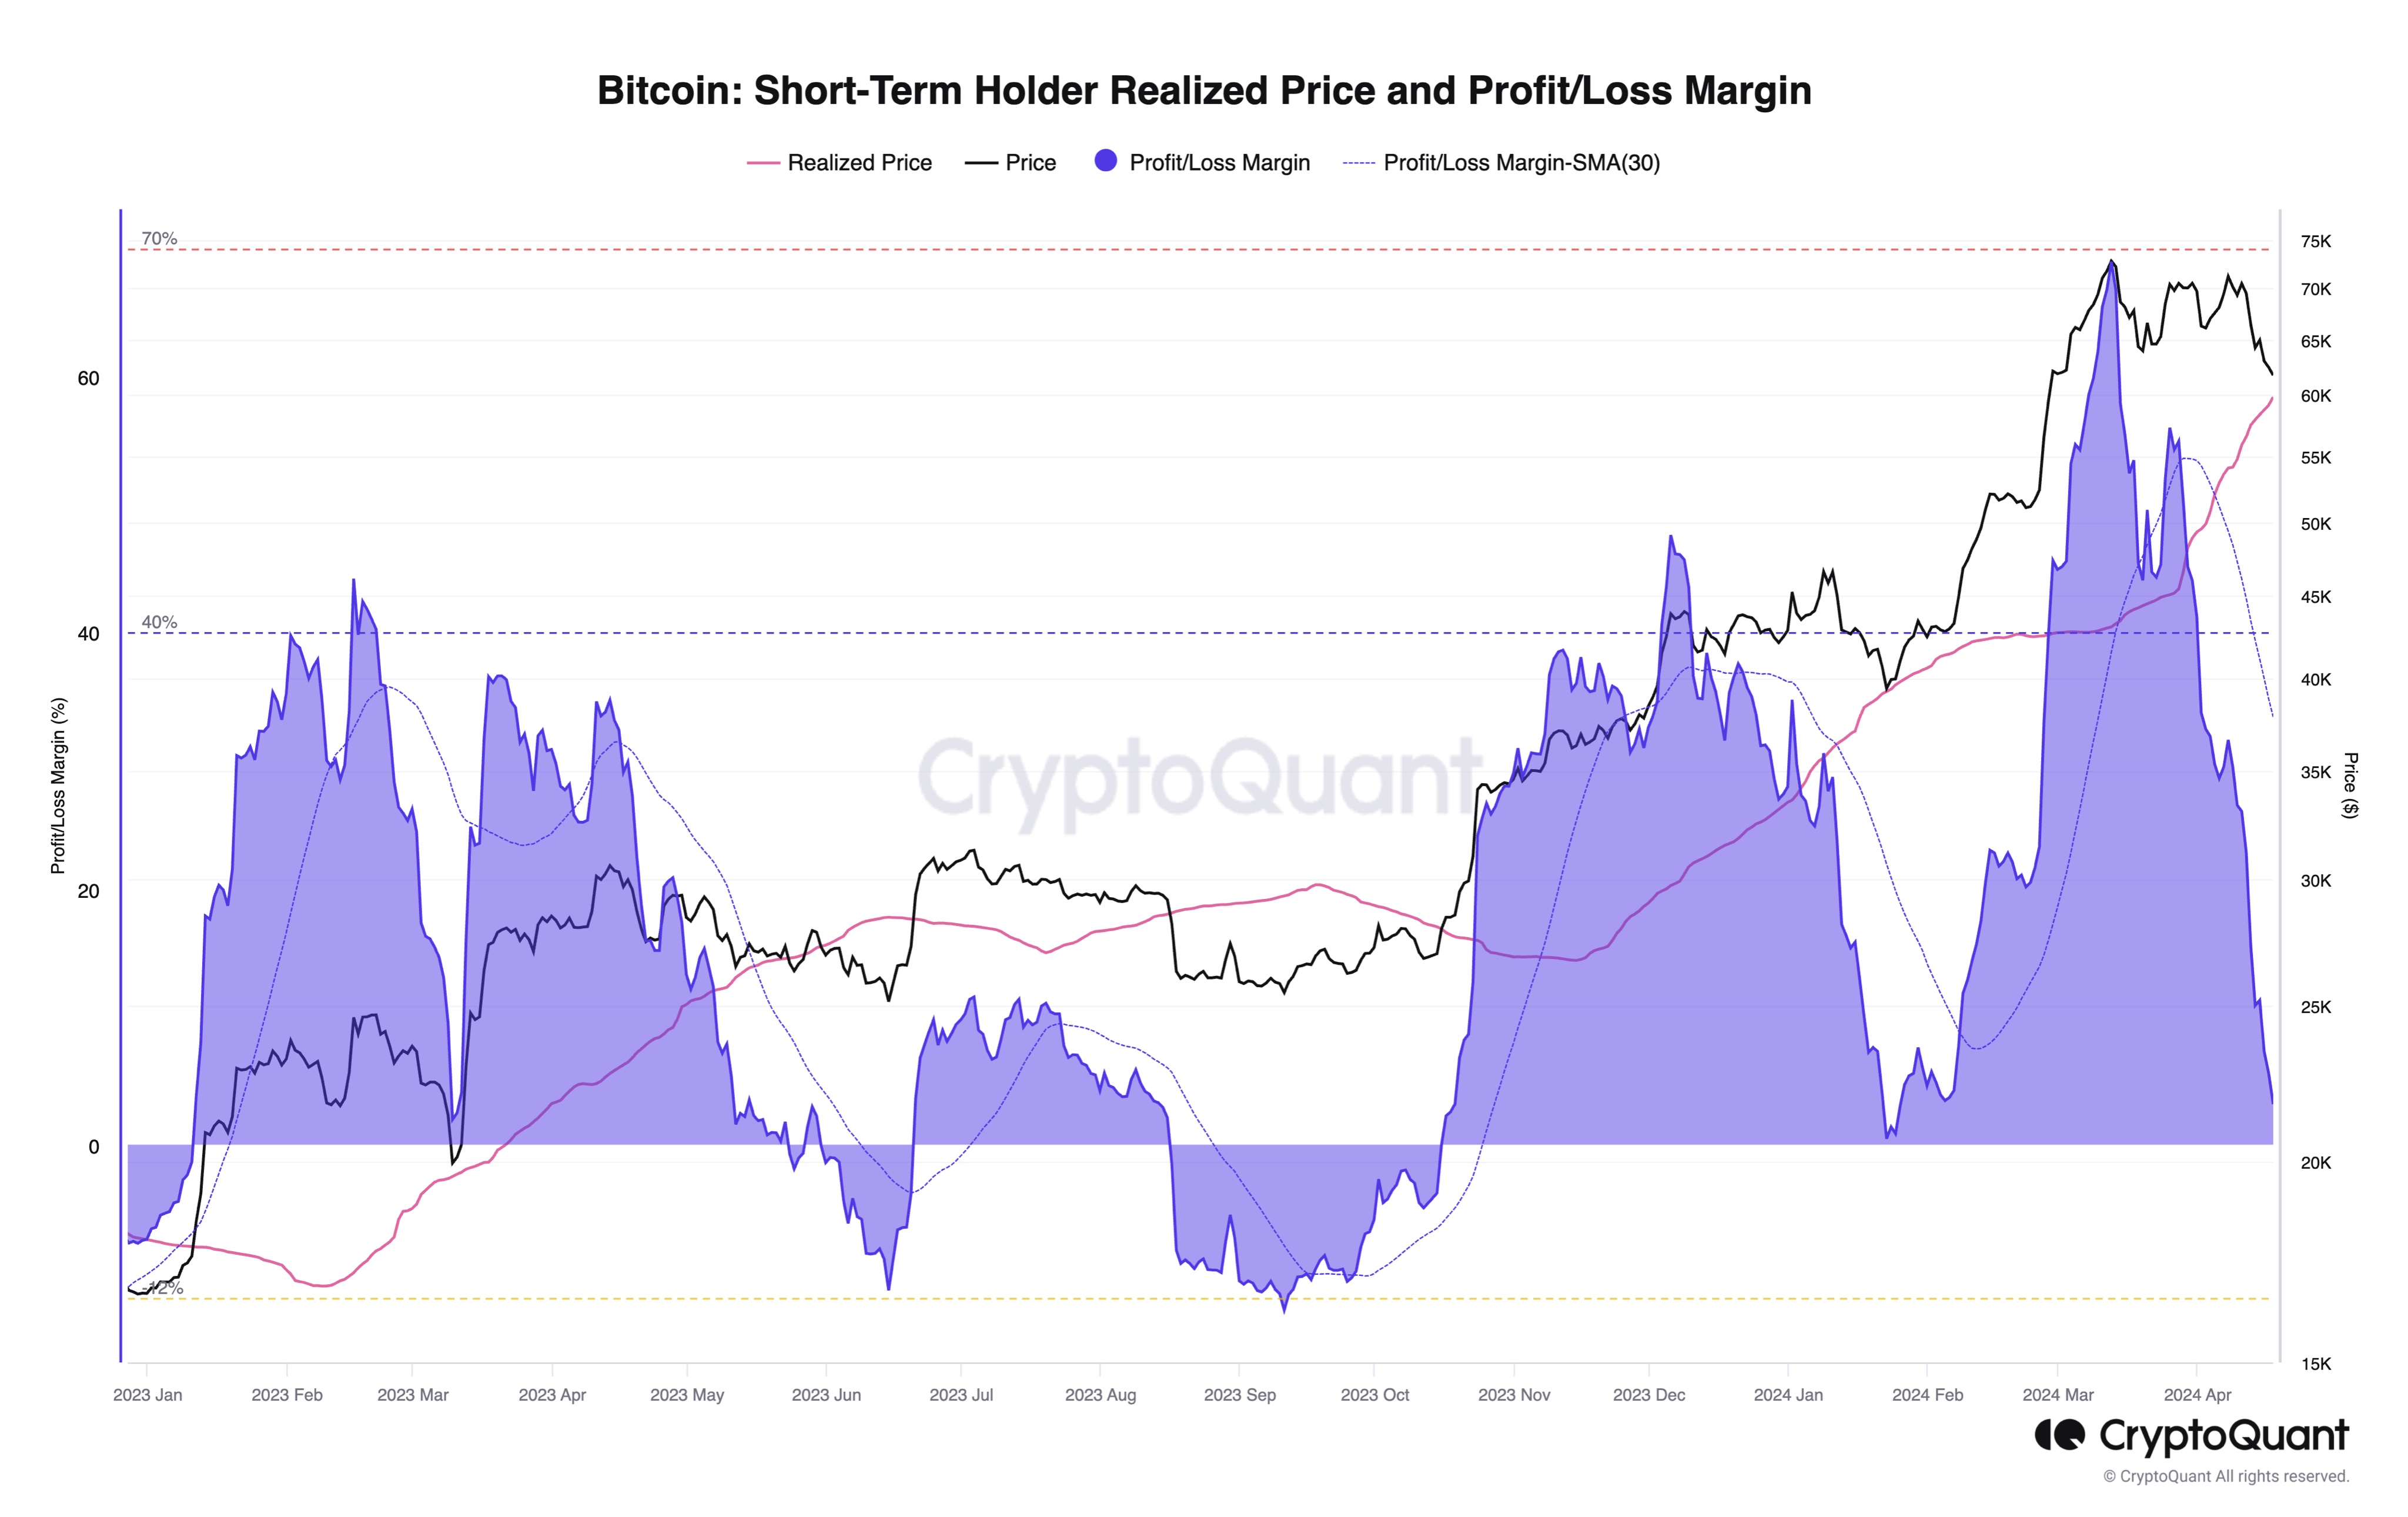
Here, Moreno has cited the profit/loss margin of this cohort based on its realized price.

Bitcoin STH Realized Price

The STH realized price (highlighted in pink) here refers to the average cost basis or acquisition price of the investors part of this cohort calculated using blockchain transaction history.

When the spot value of the cryptocurrency is above this level, it means that these holders as a whole are sitting on some net profits right now. On the other hand, the price being below the metric implies the dominance of losses.

From the above chart, it’s visible that Bitcoin has been above the STH realized price for the last few months, meaning that these traders have been enjoying profits.

This is typical during bull markets as the price keeps pushing up, letting these investors make profits. While STHs tend to stay in the green in these periods, tops do become probable to take place if these profits get extreme.

As is apparent in the graph, the profit/loss margin spiked to significant levels just as BTC set its latest all-time high, which continues to be the top thus far.

Recently, as Bitcoin has consolidated between the $60,000 to $70,000 range, the STH realized price has rapidly risen, now attaining a value of around $60,000. This occurs because as STHs have traded in this range, their acquisition prices have been repriced at these higher levels, thus pushing up the average.

BTC has been quite close to this level recently so that the STHs wouldn’t be holding that much profit now. “Bitcoin selling pressure from traders may be declining as unrealized profit margins are basically zero now,” notes the CryptoQuant head.

BTC Price

Bitcoin has continued to show action contained within its recent range as its price is still trading around $65,200.

Bitcoin Price Chart

Bitcoin Back Above $70,000 Despite Negative Taker Volume

Bitcoin has surged back above the $70,000 level during the past day despite the negative Net Taker Volume for the asset.

Bitcoin Net Taker Volume Has Seen Some Large Negative Spikes Recently

As explained by CryptoQuant Netherlands community manager Maartunn in a post on X, selling spikes of a significantly heavier scale than before have recently appeared in the Bitcoin Net Taker Volume.

The “Net Taker Volume” is an indicator that keeps track of the difference between the Bitcoin taker buy and taker sell volumes in perpetual swaps. How can the sell and buy volumes be different? As CryptoQuant explains in its data guide:

This concept is often confusing because every trade requires both a buyer and a seller of the given underlying asset. However, depending on whether the order taker is a buyer or seller (whether a transaction occurs at the ask price or the bid price), you can distinguish between long volume from taker seller volume.

When the value of this metric is positive, it means that the taker buy volume is overwhelming the taker sell volume right now. Such a trend implies a bullish sentiment is shared by the majority.

On the other hand, the negative indicator suggests that more sellers are willing to sell the coin at a lower price, a sign that a bearish mentality is the dominant one.

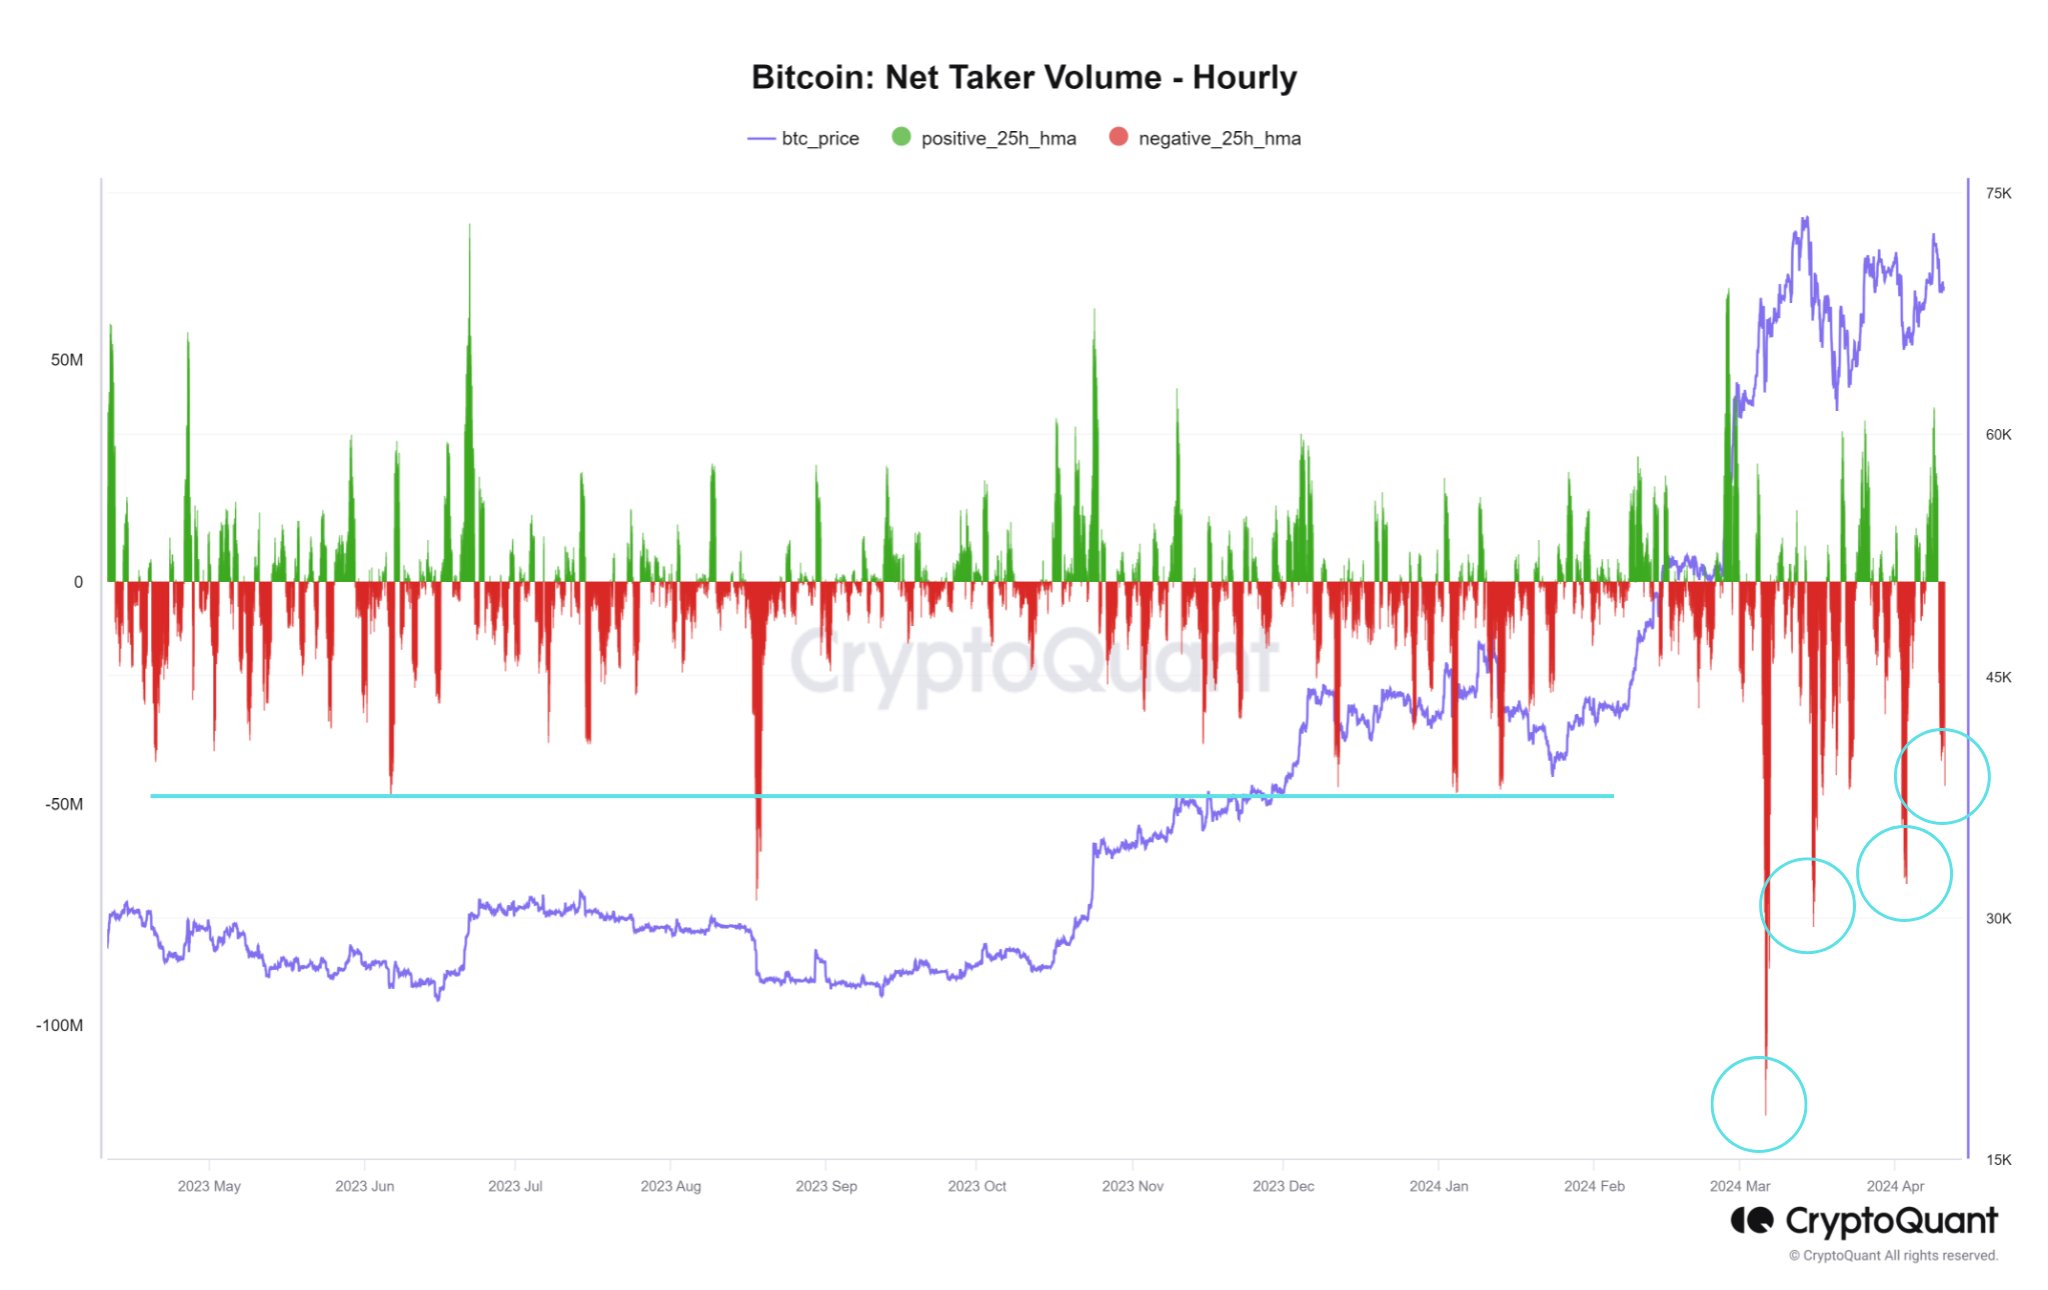
Now, here is a chart that shows the trend in the Bitcoin Net Taker Volume over the past year:

Bitcoin Net Taker Volume

As the above graph shows, the Bitcoin Net Taker Volume has recently registered a sharp negative spike, implying that the taker sell volume has been higher than the taker buy volume.

The Net Taker Volume has been seeing some large red spikes for a while, as the analyst highlighted in the chart. “Bitcoin is being hammered down massively, with selling spikes on the Net Taker Volume significantly heavier than before,” says Maartunn.

Interestingly, despite this bearish sentiment in the market, the Bitcoin price has managed to hold up relatively well. Obviously, the coin’s bullish momentum has gone while these negative Net Taker Volume spikes have taken hold, but the fact that BTC has shown strength against any sustained drawdowns is still impressive.

A pattern that’s perhaps visible in the chart is that although the Net Taker Volume has continued to see red spikes recently, their scale has gradually decreased.

Thus, if this trend continues, it’s possible that the bearish mentality will eventually run out, and buying pressure will take over Bitcoin. It now remains to be seen how the indicator develops shortly.

BTC Price

Bitcoin declined below $68,000 just yesterday, but today, the asset has already bounced back and is now trading around $70,800.

Bitcoin Price Chart

Bitcoin “Liquid Inventory Ratio” Hits All-Time Low, What It Means

On-chain data shows the Bitcoin “Liquid Inventory Ratio” has dropped to an all-time low. Here’s what this could mean for the asset.

Bitcoin Sell Side Liquidity Is Low Relative To Demand Right Now

In a post on X, CryptoQuant founder and CEO Ki Young Ju discussed the recent trend in the Liquid Inventory Ratio for Bitcoin. The Liquid Inventory Ratio is an on-chain indicator that tells us about how the total sell-side liquidity inventory of the asset compares against its demand.

The sell-side liquidity inventory of the asset is gauged using four factors: the total exchange reserve, miner holdings, OTC desk holdings, and US government-seized BTC.

Out of these, the exchange reserve (that is, the total amount sitting in the wallets of centralized exchanges) is the largest potential source of sell-side liquidity.

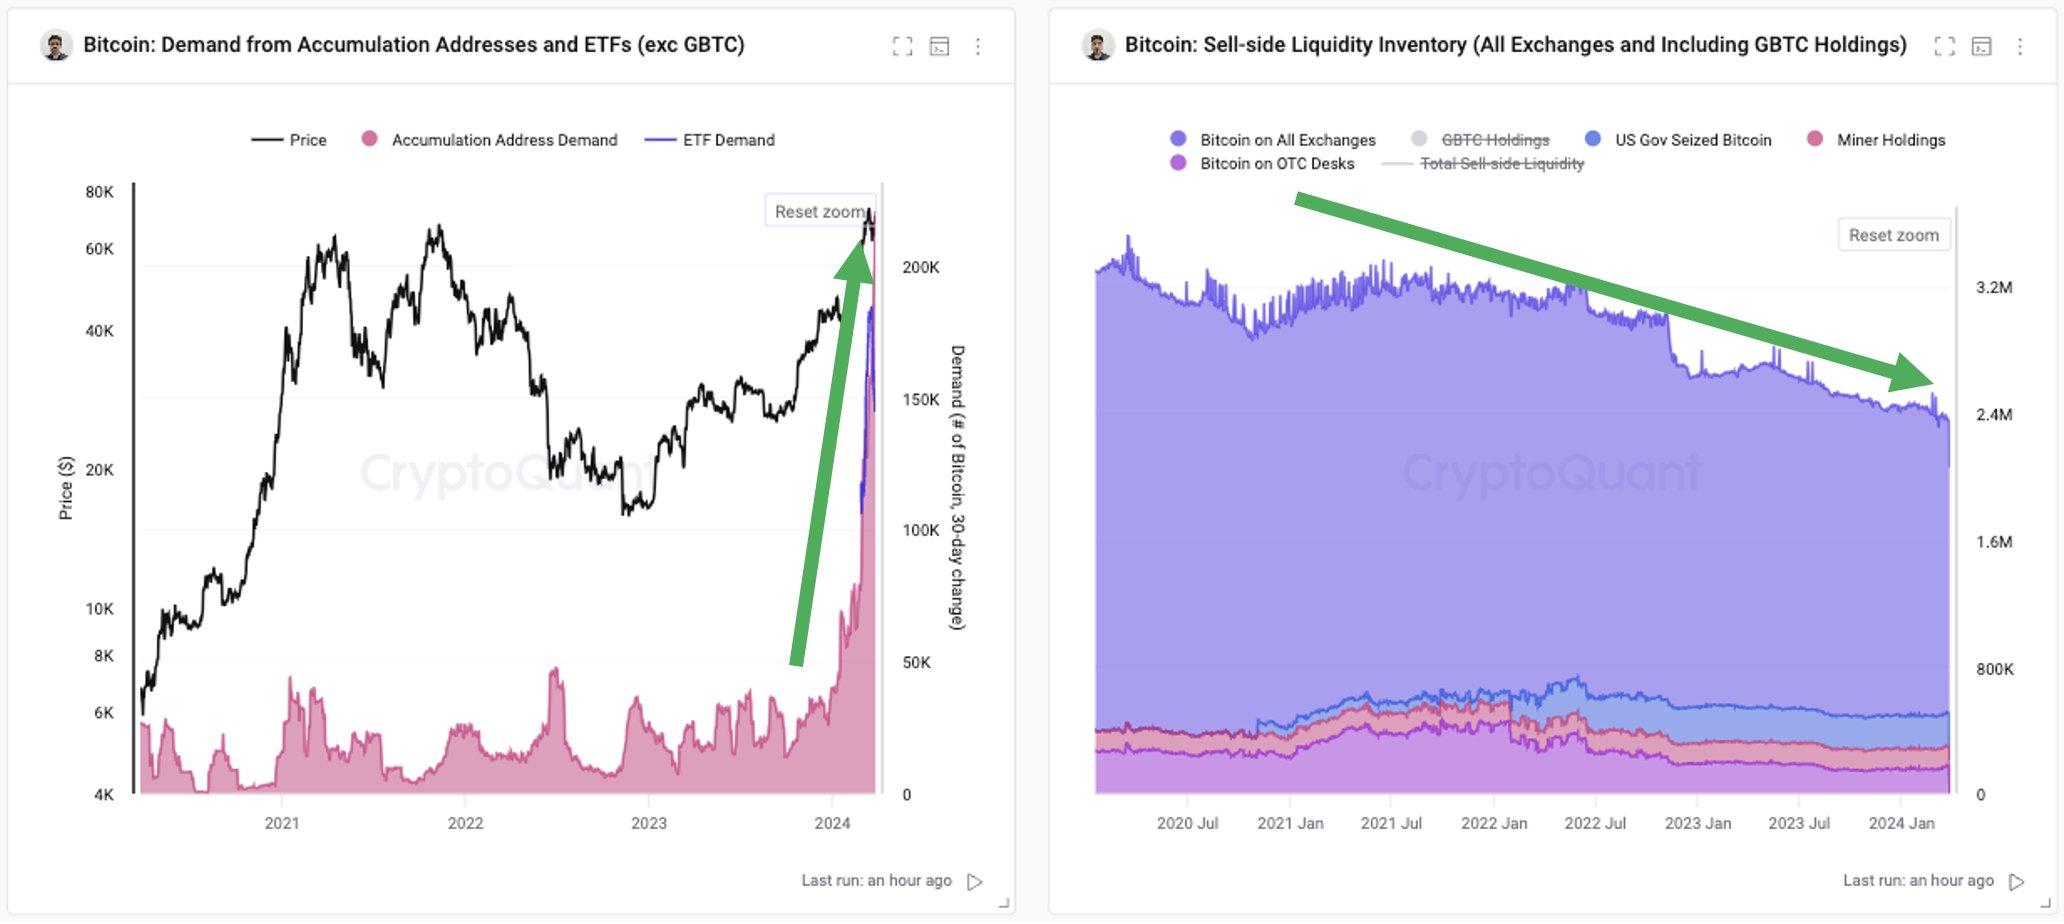
The chart on the right below shows how the sell-side liquidity inventory of the coin has changed over the last few years:

Bitcoin Sell-Side Liquidity

From the graph, it’s visible that the sell-side liquidity of the cryptocurrency has been heading down for a while now. This decline is mostly driven by the depletion of exchange reserves, as investors have been continuously pushing towards self-custody, possibly preferring to hold onto their Bitcoin for extended periods.

The chart on the left displays the trend in the total demand for the asset. Here, the demand is measured using the 30-day balance changes of “accumulation addresses.”

The accumulation addresses are those that have a history of only buying BTC and no history of selling. Exchanges and miner entities are excluded from this cohort, of course, as they count under the sell-side liquidity instead, regardless of whether they satisfy the condition for accumulation addresses or not.

Clearly, the demand for Bitcoin has exploded recently as new players like exchange-traded funds (ETFs) have entered into the arena. All this BTC is potentially going out of circulation and being locked into the wallets known for hosting a one-way traffic.

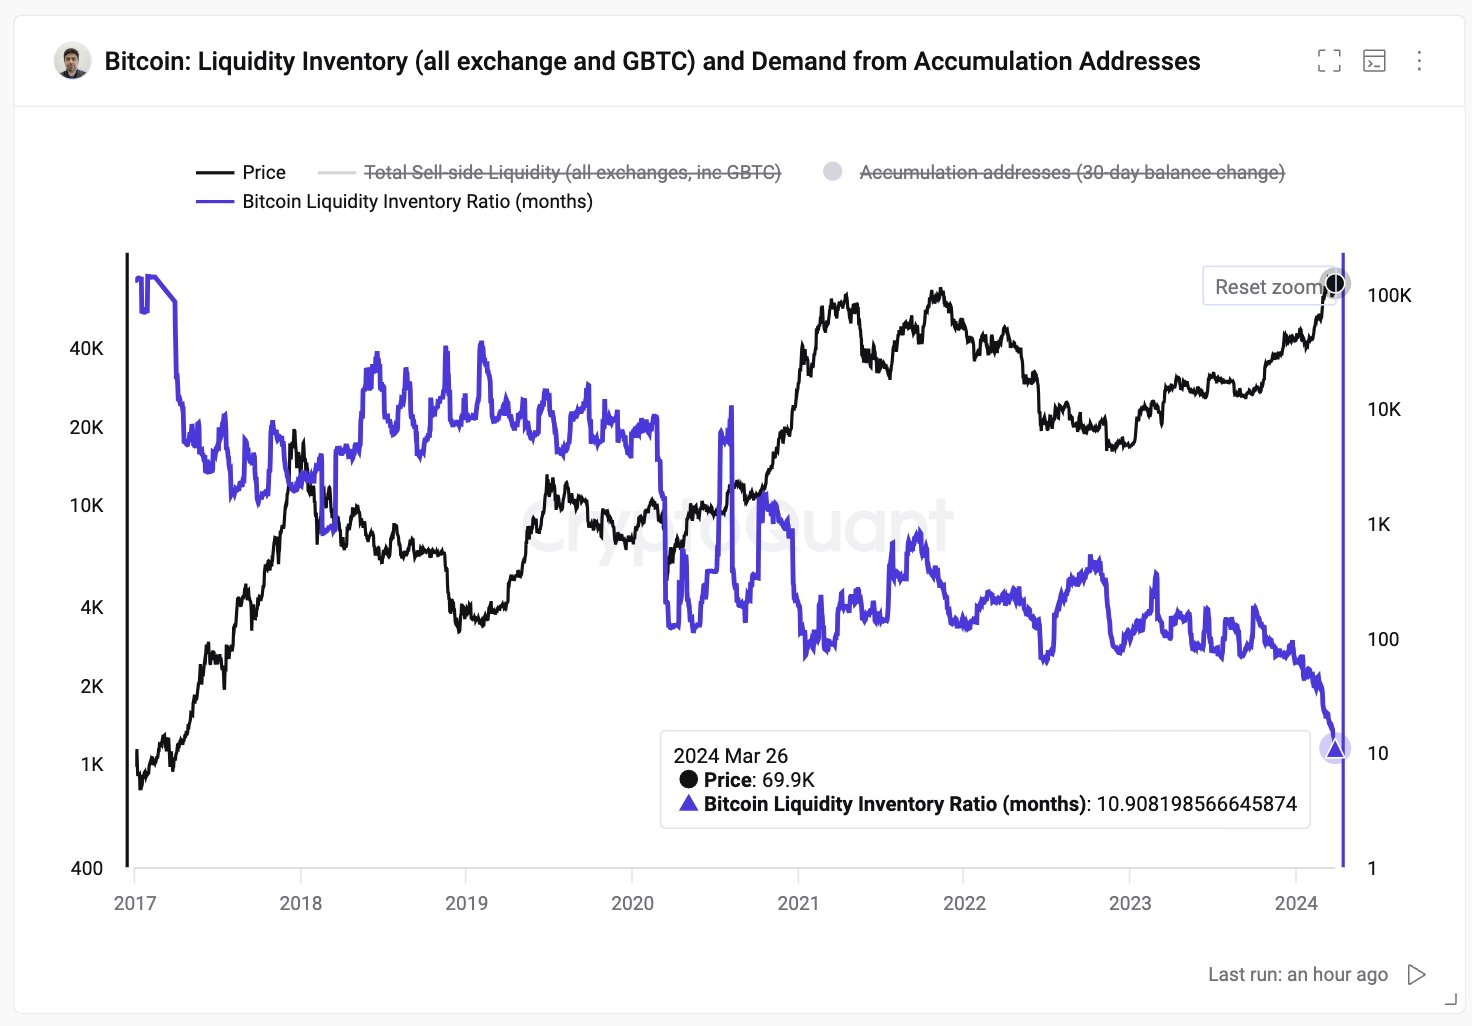
Given these two developments in the sell-side liquidity inventory and demand, it’s not surprising to see that the Liquid Inventory Ratio, which measures the ratio between the two, has plunged recently.

Bitcoin Liquid Inventory Ratio

Following the latest decline in the indicator, its value has, in fact, dropped to a new all-time low. This means that the sell-side liquidity has never been this low when compared to the demand for Bitcoin.

Given this trend, it will be interesting to see how the BTC rally plays out from here, as the supply available to buy is only continuing to tighten.

BTC Price

Bitcoin had seen some drawdown earlier, but bullish winds have seemingly returned for the coin as its price has now recovered back above $70,200.

Bitcoin Price Chart

$130M Silk Road Bitcoin Stash To Be Sold By US Government

Since mid-January Bitcoin (BTC) has been facing mounting selling pressure from various market players. This includes asset manager Grayscale, bankrupt crypto exchange FTX, and now, the US government, which is set to auction off a substantial amount of Bitcoin seized from the infamous dark web marketplace Silk Road.

Sale Of Confiscated Silk Road Bitcoin

The US government has filed a notice to sell approximately $130 million worth of Bitcoin confiscated from Silk Road. The filing states that the United States intends to dispose of the forfeited property as directed by the United States Attorney General.

Individuals or entities, except for the defendants in the case, claiming an interest in the forfeited property must file an ancillary petition within 60 days of the initial publication of the notice. 

Once all ancillary petitions have been addressed or the filing period has expired, the United States will obtain clear title to the property, enabling them to warrant good title to subsequent purchasers or transferees.

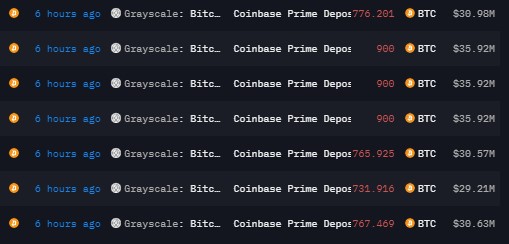
The ongoing selling pressure on BTC has resulted in a sharp 20% correction over the past 10 days. This trend is expected to continue and further amplify the selling pressure. Adding to the situation, asset manager Grayscale, while slowing down its selling activities, continues to transfer a significant amount of Bitcoin to Coinbase. 

Bitcoin

According to data from Arkham Intelligence, Grayscale recently sent an additional 10,000 BTC worth $400 million to Coinbase. 

Since the approval of the Bitcoin spot exchange-traded fund (ETF), Grayscale has deposited a total of 103,134 BTC ($4.23 billion) to Coinbase Prime. Currently, Grayscale holds 510,682 BTC ($20.43 billion).

Ideal Buying Opportunities? 

Adam Cochran, a prominent market expert, has provided insights into the recent price action and the expectations of Bitcoin buyers. Cochran highlights that aggregate open interest (OI) for BTC has decreased by 17% from recent highs but remains around 20% higher than the averages observed during more stable market ranges. 

Cochran notes that the market has seen attempts to catch falling prices, suggesting a mix of “sophisticated” and leveraged buyers.

Cochran further observes that retail investors are driven by narratives surrounding the ETF and halving events, leading them to buy dips on leverage. However, many investors remain unconvinced about the market’s direction and are waiting for a clear entry point, according to Cochran’s analysis. 

Notably, Cochran highlights that the current funding rates do not indicate a bearish sentiment, even in options trading, suggesting an expectation of a bottom formation shortly.

The market’s dynamics are influenced by emotions and probabilities, and Cochran believes that too many participants are overexposing themselves emotionally by trying to catch the bottom of the market on each dip. 

This behavior has increased the likelihood that the recent price action may not mark the bottom yet. Cochran suggests that a sentiment reset, a decline in the 3-month annualized basis by around 25%, and a further decrease in open interest would provide a healthier environment for major plays in the market.

Ultimately, Cochran emphasizes the need for a reset in expectations, highlighting that a period of doom and despair is necessary for market participants to reassess their positions. 

Cochran points out that a range between $35,000 and $37,000 BTC could be a suitable level for larger spot buys in the longer term. However, Cochran also notes that a potential drop to the $28,000 to $32,000 range could provide ideal conditions for confident, leveraged deployment.

Bitcoin

Currently, BTC is trading at $39,800, up a slight 0.6% in the past 24 hours, but down over 14% in the past fourteen days.

Featured image from Shutterstock, chart from TradingView.com

Bitcoin Sell-Side Risk Ratio Nears All-Time Lows, Big Move Soon?

On-chain data shows the Bitcoin sell-side risk ratio has approached all-time lows recently, a sign that a big move could be coming for the coin.

Bitcoin Sell-Side Risk Ratio Has Observed A Plunge Recently

As pointed out by the lead on-chain analyst at Glassnode in a Tweet, BTC sellers may have become exhausted recently. The “sell-side risk ratio” is an indicator that measures the ratio between the sum of all profits and losses being realized in the Bitcoin market and the realized cap.

The “realized cap” here refers to the capitalization model for Bitcoin that calculates a sort of “true” value for the cryptocurrency by assuming that each coin in the supply is not worth the same as the current spot price, but the price at which it was last moved.

As the profits and losses being harvested in the market are nothing but a measure of the selling pressure in the market, this indicator tells us how the selling pressure (or the sell-side risk) looks like relative to the value of the cryptocurrency (the realized cap).

When the value of this indicator is high, it means the investors are participating in a high amount of profit/loss realization right now. Such a market is usually high risk, as the price tends to be more volatile during periods with these values.

On the other hand, low values imply the holders are reluctant to sell currently. These conditions generally occur when the market has calmed down and accumulation tends to take place in such periods.

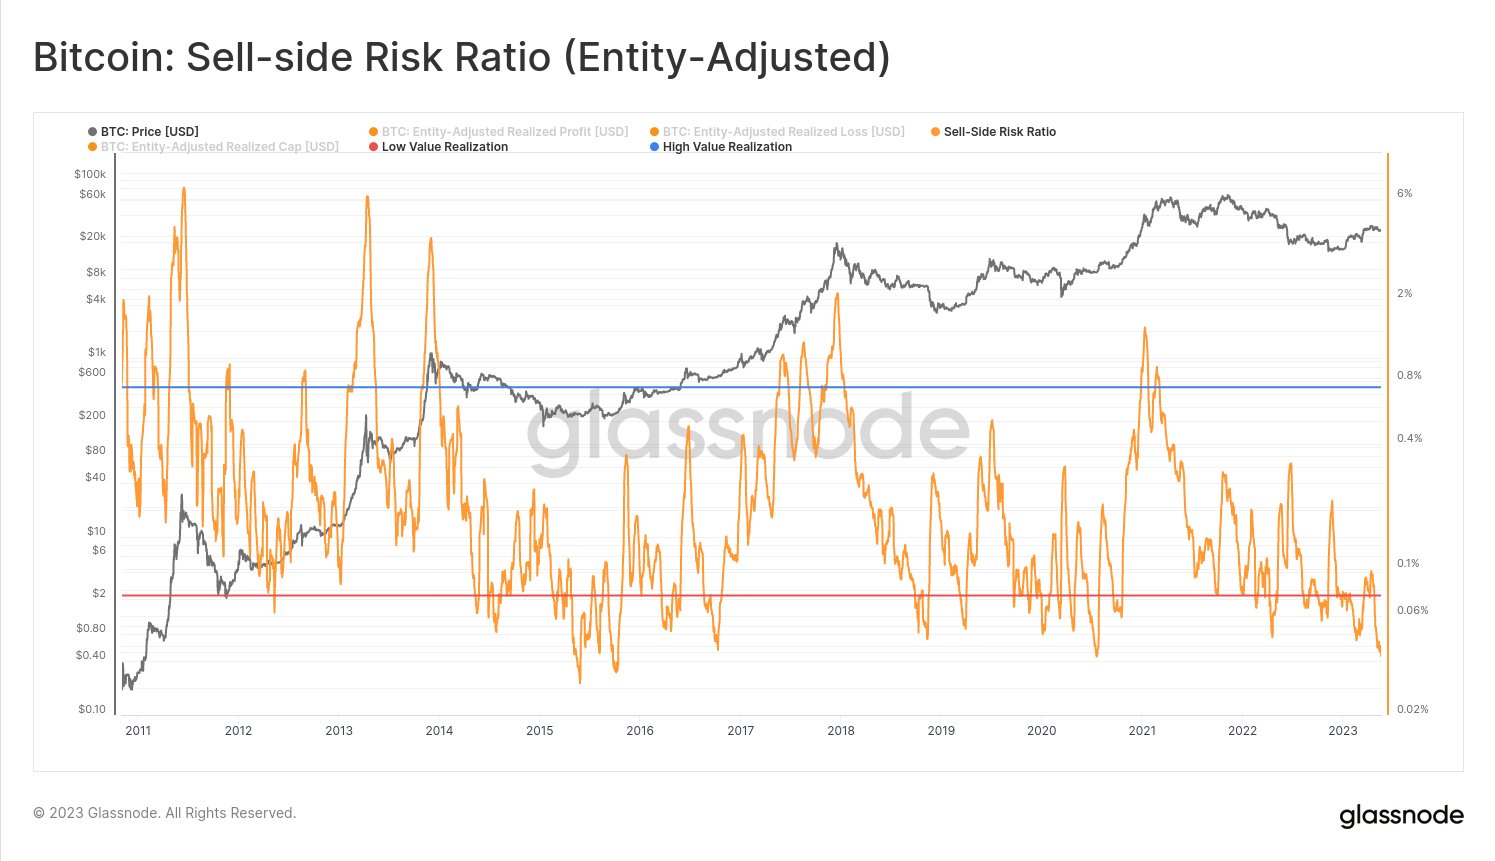
Now, here is a chart that shows the trend in the Bitcoin sell-side risk ratio over the history of the cryptocurrency:

Bitcoin Sell-Side Risk Ratio

As shown in the above graph, the Bitcoin sell-side risk ratio has seen a sharp plunge recently, a sign that there is little profit or loss realization going in the market right now.

The indicator is now below the “low value realization” line that the analytics firm has defined (colored in red in the chart). Historically, whenever the metric has plunged into this zone, the market has built up towards a sizeable move in the price.

Since such low values of the indicator imply the lack of sellers in the market, the common expectation may be that this can be a bullish sign. However, as is visible from the graph, this hasn’t necessarily been the case.

Both bullish and bearish price action has occurred following the formation of this pattern. Just back in March of this year, the indicator had shown this trend, but the cryptocurrency had followed up with a sharp correction.

Breaks into the high value realization zone (that is, the condition where there is a large amount of selling going on), though, have generally always been bearish for Bitcoin.

As the indicator has once again dipped into the low value realization area, it’s possible that a large move in the price may follow soon. Although it’s uncertain which direction exactly this volatility might go.

BTC Price

At the time of writing, Bitcoin is trading around $26,100, down 2% in the last week.

Bitcoin Price Chart

Bitcoin Selling Pressure Becoming Exhausted? This Metric May Hint So

The on-chain data for the stablecoin redemptions during the recent price plunge could suggest there aren’t many Bitcoin holders selling anymore.

Stablecoin Redeem Count Has Remained Low Recently

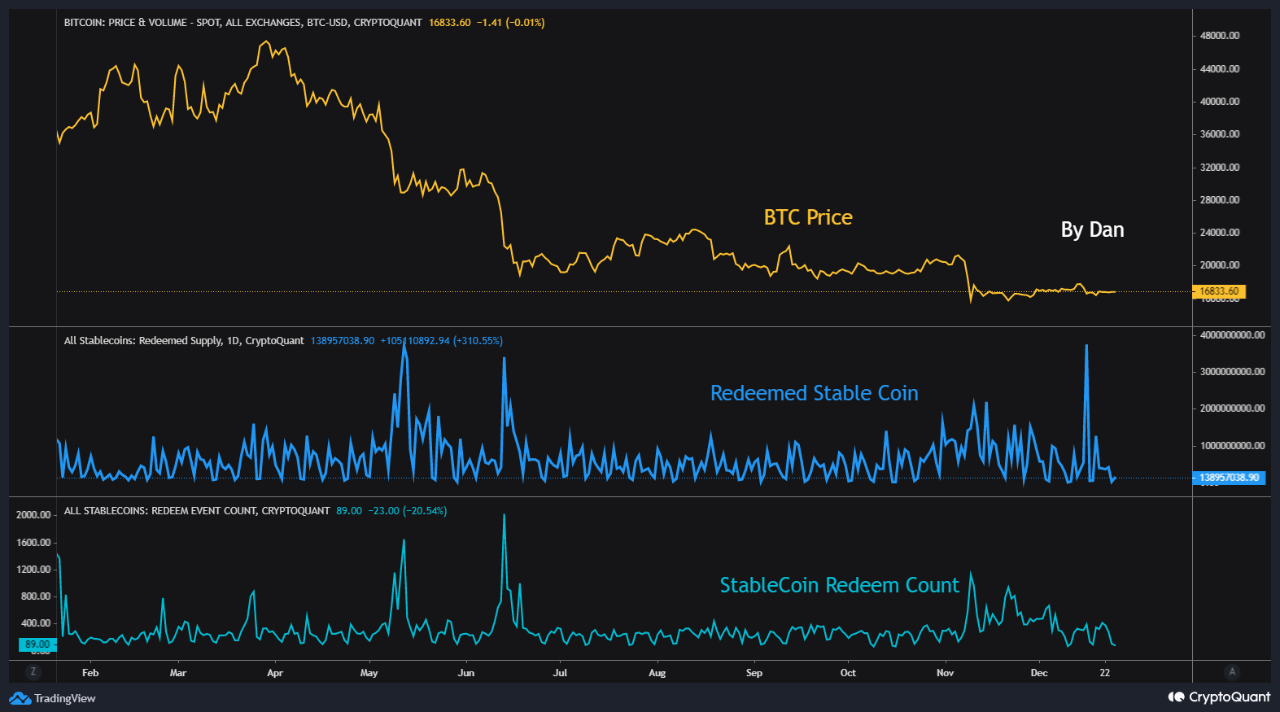
As pointed out by an analyst in a CryptoQuant post, large stablecoin redemptions have usually accompanied major declines in the Bitcoin price during this bear market. A stablecoin is said to be “redeemed” when an investor exchanges the token for fiat through the issuer of said coin.

Investors usually use stablecoins when they want to escape the volatility associated with tokens like Bitcoin. Thus, redemptions of them can be a sign that investors are exiting the market currently. The “stablecoins redeemed supply” is an indicator that measures the total amount of such redemptions happening across the market of all types of stables.

Another metric that keeps track of these withdrawals is the “stablecoins redeem event count,” which, as its name already implies, measures the total number of redemptions taking place in the market rather than the total sum of their value.

Now, here is a chart that shows the trend in both these stablecoin redemptions indicators over the past year:

Bitcoin vs Stablecoin Redemptions

As the above graph displays, during the large declines in the price of Bitcoin in this bear market so far, the stablecoins redeemed supply has usually registered high values. This trend makes sense as investors would be converting to stables to sell off during the crash, and then redeeming them for fiat.

The stablecoin redeem count also observed spikes during such dumping events, except for the most recent one. This implies that in the price plunges before the latest one, many investors always took part in stablecoin redemptions, showing that the market had a uniform and more natural selling appetite.

In the most recent decline where Bitcoin went from above $18k to below $17k, however, the redeemed count has stayed low while the redeemed supply has still observed very high values. This means that only a few whales were involved in this dumping event, a possible sign that largescale selling pressure may be getting depleted in the market.

BTC Price

At the time of writing, Bitcoin’s price floats around $16,800, up 1% in the last seven days. Over the past month, the crypto has gained 2% in value.

Bitcoin Price Chart

This Bitcoin Metric Suggests Selling Pressure May Be Reaching Exhaustion

On-chain data shows the Bitcoin binary CDD has been going down recently, a sign that selling pressure may be getting exhausted in the market.

Bitcoin 21-Day MA Binary CDD Has Been Observing Downtrend Recently

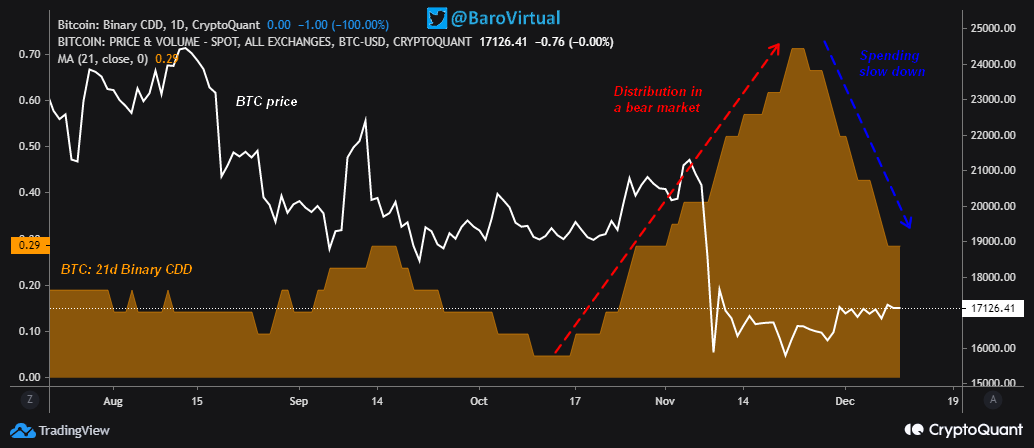
As pointed out by an analyst in a CryptoQuant post, there was some heavy distribution going on in the market just a while ago. The relevant indicator here is “Coin Days Destroyed” (CDD). A coin day is the amount that 1 BTC accumulates after sitting still in a single address for 1 day.

When a coin that was previously dormant (and was thus carrying some coin days) makes some movement on the chain, its coin days counter resets back to zero, and the coin days it had accumulated are said to be “destroyed.” The CDD metric measures the total amount of such coin days being destroyed across the network on any given day.

When this indicator has a large value, it means long-term holders are possibly moving or selling their coins as this cohort tends to stack up huge numbers of coin days. “Binary CDD,” the version of the metric being used here, tells us whether the supply-adjusted CDD is more or less than the average supply-adjusted CDD.

Related Reading: Bitcoin Bottom Or More Pain? Here’s What BitMEX Founder Arthur Hayes Thinks

As the name already implies, this indicator can have only two values, 0 and 1. It’s 0 when the Bitcoin CDD is less than the average, while it’s 1 when it’s more. Here is a chart that shows the trend in the 21-day moving average value of this metric over the last few months:

Bitcoin CDD

As you can see in the above graph, the 21-day MA Bitcoin binary CDD had been climbing up between mid-October and late November, suggesting that the long-term holders were dumping. The BTC price took a large hit while this trend was taking place. However, in the last couple of weeks or so, the indicator has been rapidly going down instead.

This could be a sign that the selling pressure that was previously present in the BTC market is now getting exhausted, which is something that can pave way for a bottom formation in the price.

BTC Price

At the time of writing, Bitcoin’s price floats around $17k, down 1% in the last week. Over the past month, the crypto has gained 1% in value.

Below is a chart that shows the trend in the price of the coin over the last five days.

Bitcoin Price Chart

Bitcoin Whale Selling Pressure Continues As BTC Dips Under $20k

On-chain data shows Bitcoin whales have continued to put selling pressure on the market as the price of the crypto now drops below $20k.

Bitcoin Exchange Whale Ratio Has Spiked Up To High Values

As pointed out by a post from CryptoQuant, the exchange inflows that followed the US CPI release lead to the price crashing 10% in only a couple of hours.

The “exchange whale ratio” is an indicator that measures the ratio between the sum of the top 10 Bitcoin transactions to exchanges, to the total exchange inflows.

Since the ten largest transfers to exchanges are usually from the whales, this metric’s value tells us how much of the total inflows are coming from these humungous holders.

When the value of the ratio is high, it means whales are making up for a large part of the total transactions to exchanges. Such a trend can be a sign of dumping from this cohort.

Now, here is a chart that shows the trend in the Bitcoin exchange whale ratio (EMA 7) over the year 2022 so far:

The value of the metric seems to have been quite high in recent days | Source: CryptoQuant

As you can see in the above graph, the 7-day exponential moving average of the Bitcoin whale ratio has been elevated recently. This shows that a big part of the recent activity on exchanges has been coming from these holders.

Another indicator, the Spent Output Value Bands, tells us what the individual contributions to the inflows are from the different holder groups in the market. Investors are put into these cohorts based on the amount of BTC they are holding in their wallets.

The below chart shows the trend in this metric specifically for the 1k to 10k BTC and 10k+ BTC holder groups.

Looks like the two cohorts have been active in recent days | Source: CryptoQuant

As the graph shows, both the whales holding between 1k to 10k BTC and those with 10k or more BTC have actively contributed to the exchanges recently.

A few large spikes from them came right before the recent plummet in the Bitcoin price that took its value down to $20k.

The quant in the post notes that later today’s values of the exchange whale ratio can be important in judging how severe its moving average is going to be.

BTC Price

At the time of writing, Bitcoin’s price floats around $19.7k, down 6% in the past week.

The value of the crypto has dipped below $20k now | Source: BTCUSD on TradingView
Featured image from Andrew Bain on Unsplash.com, charts from TradingView.com, CryptoQuant.com

Bitcoin Selling Pressure Continues As Long-Term Holder SOPR Spikes Up

On-chain data shows the Bitcoin long-term holder SOPR has recently observed spikes, suggesting that this cohort is still continuing to sell.

Bitcoin Long-Term Holder SOPR Spiked Up When Price Crossed $30k

As pointed out by a CryptoQuant post, selling pressure in the market still looks to be high as long-term holders are also looking to sell.

The “spent output profit ratio” is an indicator that tells us whether the overall market is selling Bitcoin at a profit or loss right now.

The metric works by checking the on-chain history of each coin being sold to see what price it last moved at. It then divides the current price (that is, the selling price) with the last price.

When the value of this ratio is greater than one, it means investors are, on an average, selling at a profit at the moment.

On the other hand, values of the indicator less than one imply that the Bitcoin market as a whole is realizing loss currently.

A cohort of BTC investors is the “long-term holder” (LTH) group, who hold their coins for at least 155 days before selling.

Related Reading | Bitcoin Bearish Signal: Whales Ramp Up Dumping

The “LTH SOPR” tells us about profit or loss realization from specifically this group. Here is a chart that shows the trend in this indicator (EMA 144) over the past month:

It seems like the value of the metric has observed some spikes recently | Source: CryptoQuant

As you can see in the above graph, the Bitcoin long-term holder SOPR (EMA 144) had a couple of spikes in the last few days.

One took place on 13th May, while the other occurred on the 18th. During both these instances, the price had crossed $30k shortly before.

Related Reading | Funding Rates Fall To Yearly Lows Following Bitcoin’s Fall Below $29,000

This means that LTHs have been feeling pressure in the current market to realize their profits as soon as the price reaches above $30k.

Usually, Bitcoin long-term holders are the least likely cohort to sell. So, selling pressure from this group can prove to be bearish for the crypto’s price.

BTC Price

At the time of writing, Bitcoin’s price floats around $29.4k, up 3% in the last seven days. Over the past month, the crypto has lost 28% in value.

The below chart shows the trend in the price of the coin over the last five days.

Looks like the price of the crypto has seen some decline over the past two days | Source: BTCUSD on TradingView

Over the past week, Bitcoin has mostly consolidated around the $30k mark, failing to gain any ground above the mark. As long as selling at the level continues, the crypto won’t be able to make any real recovery.

Featured image from Unsplash.com, charts from TradingView.com, CryptoQuant.com