Bitcoin Long-Term Holders Slow Down After 700,000 BTC Selloff, Reversal Sign?

On-chain data shows the Bitcoin long-term holder selling pressure has been running out recently after an extended selloff from the group.

Bitcoin Long-Term Holders Have Sold Huge In Past 4 Months

As analyst James Van Straten explained in a post on X, the long-term holders have massively reduced distribution during the last ten days. The “long-term holders” (LTHs) here refer to the Bitcoin investors carrying their coins since more than 155 days ago.

The LTHs comprise one of the two main divisions of the BTC sector, with the other cohort known as the “short-term holders” (STHs). The STHs are naturally the investors who bought within the past 155 days.

Statistically, the longer an investor holds onto their coins, the less likely they become to sell at any point. As such, the LTHs represent the more committed part of the BTC market.

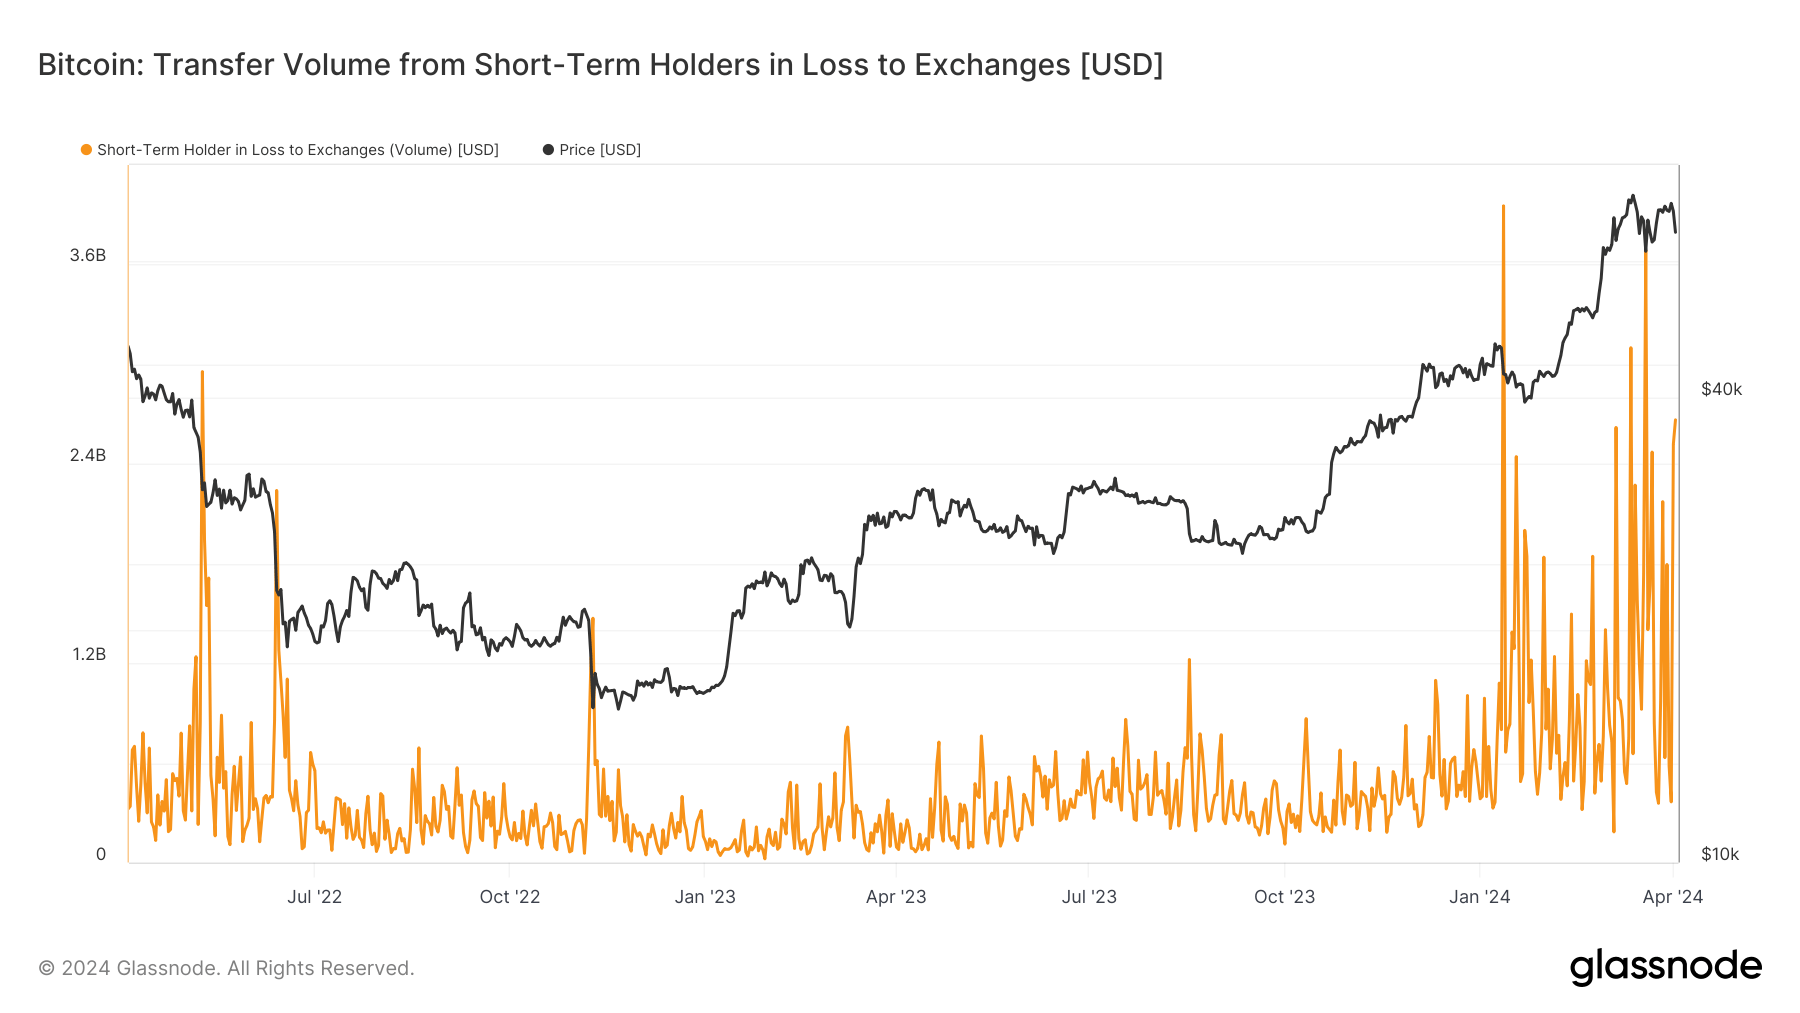
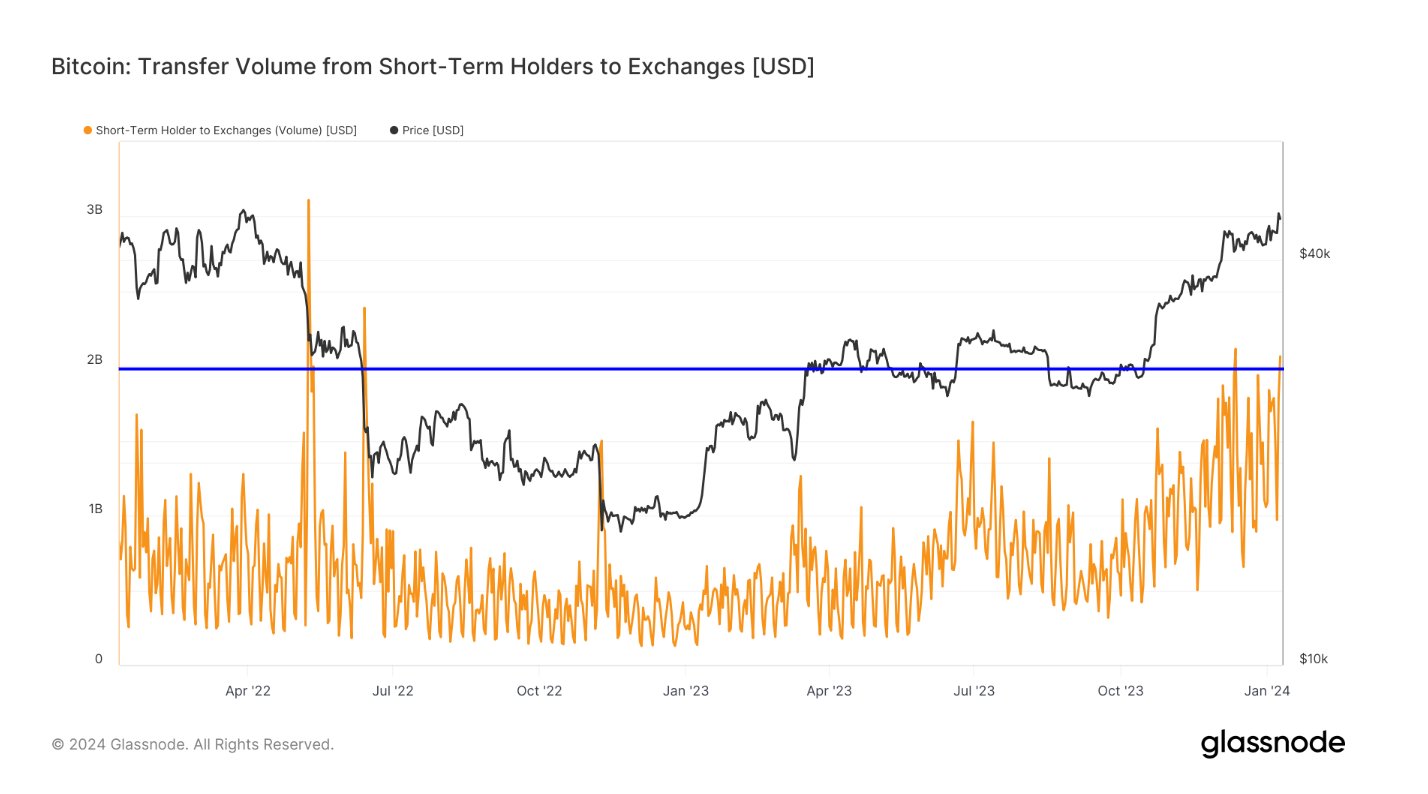
The STHs, on the other hand, are fickle-minded hands who may sell at the first sight of any FUD or profit-taking opportunity. As such, selling from the STHs is usually not that noteworthy. However, Selloffs from the LTHs can be something to watch for, as they rarely occur.

One way to track the behavior of these Bitcoin cohorts is through the total amount of supply they carry in their respective combined wallets. The chart below shows the STH and LTH supply trend over the past year.

Bitcoin STH & LTH Supply

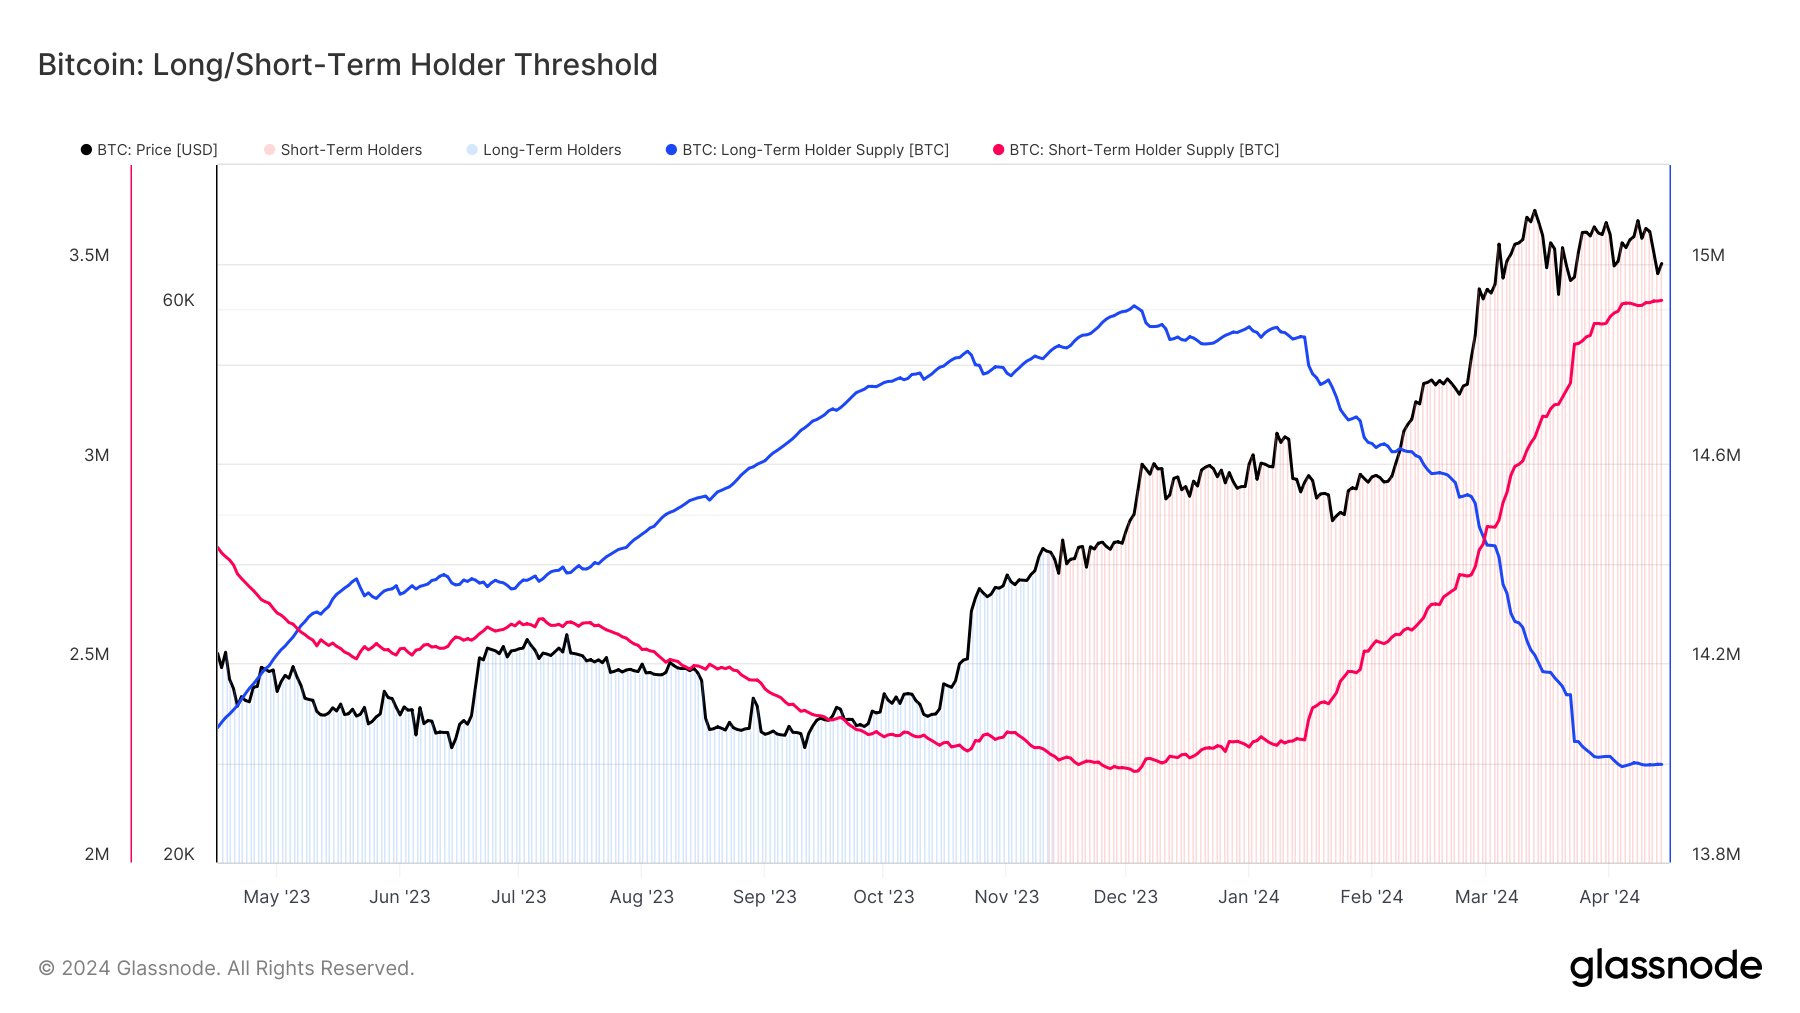
As displayed in the above graph, the supply of Bitcoin LTHs increased through most of 2023. At the same time, the supply of STHs naturally decreased.

Something to note here is that this increase in the LTH supply didn’t mean that these HODLers were buying then. Instead, some STHs bought 155 days ago and have finally held long enough to qualify for the cohort.

Thus, there is a 155-day delay between accumulation and the increase registered in the LTH supply. When it comes to selling, though, no such time lag exists, as the LTHs who transfer coins on the blockchain immediately eject from the group and become part of the STHs.

The chart shows that this trend of the supply of these diamond hands going up flipped this year, and the LTHs have been selling instead. In the past four months, these investors have distributed 700,000 BTC.

This excludes the selloff from Grayscale Bitcoin Trust (GBTC), which has constantly been bleeding coins since the US SEC approved the spot exchange-traded funds (ETFs) in January. These coins had also matured enough to become part of the LTHs.

Recently, as the price has gone through some bearish action, the LTH supply has flatlined, implying that the selling from these HODLers has finally stopped, at least for now. Given this new trend, it now remains to be seen how BTC’s value develops from here.

BTC Price

Following the latest drawdown in Bitcoin, its price has dropped towards the $63,200 level.

Bitcoin Price Chart

Bitcoin Short-Term Holders Capitulate: $5.2 Billion Sold At Loss

On-chain data shows the recent Bitcoin drawdown has shaken up the short-term holders, leading them to make large exchange deposits at a loss.

Bitcoin Short-Term Holders Have Transferred Huge Volume In Loss To Exchanges

As analyst James Van Straten pointed out in a post on X, the BTC short-term holders have recently participated in a large amount of loss-taking. The “short-term holders” (STHs) are the Bitcoin investors who bought their coins within the past 155 days.

The STHs make up one of the two main divisions of the BTC market, which is done on the basis of holding time, with the other cohort being known as the long-term holders (LTHs).

Statistically, the longer an investor holds onto their coins, the less likely they become to sell them at any point. As such, the STHs would reflect the weak-minded side of the market, while the LTHs would be the persistent diamond hands.

Given their fickle nature, the STHs usually easily react whenever a notable sector change occurs, like a price rally or crash. Recently, BTC has registered a significant drawdown, so these investors would likely have made some moves.

Indeed, on-chain data would confirm this. Below is a Glassnode chart shared by Straten, which reveals the trend in the transfer volume in loss (in USD) going from the wallets of the STHs to centralized exchanges.

Bitcoin STH Capitulation

As displayed in the above graph, Bitcoin short-term holders have recently deposited a large number of tokens holding a loss into exchange-affiliated wallets.

Exchange inflows usually suggest demand for using the services these platforms provide, which can include selling. As these latest deposits from the STHs have come following a sharp drop in the price, it would appear possible that the panic-sellers indeed made these inflows.

As the Bitcoin price is currently near the all-time high (ATH), most of the STH group would be holding a profit. So, all this loss volume can only come from those who bought at the recent highs.

This isn’t the first time the market has observed such quick capitulation from FOMO buyers this year. The chart shows that the exchange transfer volume in loss from the STHs also spiked very high during the plunge that followed the latest price ATH.

The spike back then was even greater in scale than the one witnessed recently and suggested the shakeout of the holders who the news of the ATH had driven in.

In the latest capitulation event, the Bitcoin STHs have deposited $5.2 billion worth of underwater coins to the exchanges within a two-day window.

BTC Price

Since the plunge a few days ago, Bitcoin has been unable to find any significant upward momentum, as its price has only been able to recover to $66,500.

Bitcoin Price Chart

Bitcoin Traders Capitulate: Here’s What Happened Last 2 Times

On-chain data shows the Bitcoin investors have been capitulating recently, a sign that FUD has been gripping the market.

Bitcoin Total Amount Of Holders Has Seen A Drop Recently

According to data from the on-chain analytics firm Santiment, the Bitcoin Total Amount of Holders has registered a notable decline recently. The “Total Amount of Holders” here is an indicator that measures the total number of addresses on the BTC blockchain that are carrying some non-zero balance right now.

When the value of this metric trends up, it can mean that fresh hands are potentially investing into the cryptocurrency, opening new addresses and adding coins to them.

The indicator would naturally also increase if any investors who had left the asset before are returning back to it and filling up their wallets again. Another possible reason for the trend can also be due to holders breaking up their holdings into multiple wallets, for purposes like privacy.

In general, though, an increase in the Total Amount of Holders is usually a sign that net adoption of the coin is taking place, which can be a bullish sign in the long term.

On the other hand, a decline in the indicator can signal that some investors have decided to leave the cryptocurrency behind, as they have completely liquidated their holdings.

Now, here is a chart that shows the trend in the Bitcoin Total Amount of Holders over the past few months:

Bitcoin Total Amount of Holders

As displayed in the above graph, the Bitcoin Total Amount of Holders has suffered a decrease during the past 10 days or so. In all, 311,000 addresses have completely emptied themselves inside this window.

“To a novice trader, this may appear to be a concern with less overall active participants. However, historically this stat has reflected FUD moments in the market, indicating small BTC wallets are typically capitulating as large wallets scoop up their coins,” explains Santiment.

From the chart, it’s visible that there have also been two other instances of mass capitulation within the past few months. More specifically, 1.1 million addresses exited between the 23rd of September and 23rd of October, while 757,000 capitulated between the 21st of January and 13th of February.

Interestingly, during these capitulation events, the price went up 28% and 24%, respectively. So far since the latest selloff from the small hands has started, the cryptocurrency is down about 3%.

“If history is any indication, Bitcoin has a strong chance of putting up positive returns before this exodus of non-0 wallets this round (due to traders thinking the top is in) finally stops,” notes the analytics firm.

BTC Price

Since Bitcoin’s low at $60,600, the asset has enjoyed some sharp recovery as its price has now surged to the $66,800 level.

Bitcoin Price Chart

Bitcoin Miner Selloff Poses “Negligible Impact”, Quant Argues

On-chain data shows the Bitcoin miners have been selling recently, but this quant has argued that this selloff shouldn’t have much impact on the market.

Bitcoin Miner Reserve Has Registered A Decline Recently

In a CryptoQuant Quicktake post, an analyst discussed the latest selling pressure that the miners have been putting on the market. The indicator of interest here is the “miner reserve,” which keeps track of the total amount of Bitcoin that the miners combined hold in their wallets right now.

This metric can naturally provide information about the collective behavior of these chain validators. Generally, the miners withdraw their coins from their reserve when they want to sell, so a decline in the indicator can potentially have bearish consequences for the asset.

A rise in the metric, on the other hand, may be bullish for the cryptocurrency’s price as it suggests the miners as a whole are in accumulation mode at the moment.

Now, here is a chart that shows the trend in the Bitcoin miner reserve over the past year:

Bitcoin Miner Reserve

As displayed in the above graph, the Bitcoin miner reserve has been on its way down since October, implying that this cohort has withdrawn a net amount of BTC from their wallets during this period.

This latest selloff from the miners has recently been a topic in the community, with many speculating about the possible bearish impact arising from it. The quant has a different opinion on the matter, however.

“The sell-off of Bitcoin reserves by miners, as discussed on X and various portals, is unfounded,” explains the analyst. To back this claim, the quant has pointed out the exact numbers involved here.

Before this selling started, the miner reserve had a value of around 1,84,997 BTC. Following the decline that the indicator has witnessed since then, the miners now hold about 1,833,222 BTC.

This represents a decrease of 12,755 BTC, which, although substantial on its own, doesn’t seem too large in the grand scheme of things, especially considering the size of the miner reserve itself. “The minimal amount of bitcoin sold has negligible impact on the market,” notes the analyst.

Bitcoin Miner Inflows & Outflows

The above chart shows the data for the Bitcoin inflows and outflows being made by the miners. There have indeed been outflows taking place recently, which is why there has been talk of a selloff.

At the same time, the inflow transaction volume has also been at significant levels, making up for these outflows. This is the reason for the relatively small net decrease in the total miner reserve.

BTC Price

Bitcoin had recovered beyond the $43,000 mark earlier, but the asset has seen a setback during the past day as it has slipped back towards $42,500.

Bitcoin Price Chart

Bitcoin Capitulation: Holders Flee BTC As Post-ETF Disappointment Hits

On-chain data shows that Bitcoin investors have been clearing out their wallets recently as the asset continues to be disappointing in this post-ETF era.

Bitcoin Small Wallets Have Been Displaying Signs Of Capitulation

According to data from the on-chain analytics firm Santiment, the number of small BTC wallets has seen a sharp decline during the last few days. The indicator of relevance here is the “Supply Distribution,” which tells us about the amount of wallets that currently belong to the different holder groups on the Bitcoin network.

The addresses are divided into these groups based on the number of coins they are carrying in their balance right now. A wallet carrying 0.5 BTC, for instance, would belong inside the 0 to 1 BTC cohort.

Now, here is a chart that shows the trend in the Supply Distribution for three different Bitcoin wallet groups over the last few months:

Bitcoin Supply Distribution

The first wallet group on the chart is the “0 to 1” coins cohort. The owners of such small wallets are usually the retail investors, popularly known as the “shrimps.”

From the graph, it’s visible that these small hands have seen the total number of their wallets go down in the last few days. To be more specific, around 487,300 shrimps have cleared out their wallets in this selloff, a decline of almost 1%.

“History tells us that this is typically a sign of capitulation, which can lead to a market price bounce until smaller traders begin to get optimistic toward crypto as an investment vehicle once again,” explains the analytics firm.

“The disappointment of market performances since the 11 ETF approvals over 2 weeks ago is largely attributed as the cause for these wallet liquidations,” Santiment adds.

The spot ETFs have been one of the main topics in the cryptocurrency community during the last few months, and the price rally in Bitcoin was in part driven by anticipation around them. Unlike what some investors had imagined, though, the market sold at the news, and BTC has been unable to recover so far.

The shrimps aren’t the only ones that have capitulated recently, though, as the 1-1,000 coins group has seen a decline of 4,752 wallets since January 5th, while the 1,000+ BTC entities have shed 27 addresses since December 27.

The former group includes the mid-sized Bitcoin holder groups like the “sharks,” while the latter cohort includes the largest of the hands on the network: the “whales.”

Clearly, however, these larger entities had started selling ahead of the spot ETF approvals, while the shrimps had still been optimistic about the event. And interestingly, since the smallholders have started their latest capitulation, the whales have, in fact, seen some growth in their addresses.

BTC Price

Bitcoin has seen some sharp recovery push in the past day as the asset’s price has now bounced back to the $40,800 mark.

Bitcoin Price Chart

Bitcoin Erases $49,000 ETF Rally As Coinbase Users Take To Selling

Bitcoin had earlier shown a sharp rally toward the $49,000 mark, but the asset was quick to retrace the entire surge as the Coinbase Premium turned negative.

Bitcoin Coinbase Premium Gap Plunged Into Negative During Past Day

As pointed out by CryptoQuant Netherlands community manager Maartunn in a post on X, the Coinbase Premium Gap has now turned notably negative after being mostly positive for the last few days.

The “Coinbase Premium Gap” refers to the difference between the Bitcoin prices listed on the cryptocurrency exchanges Coinbase (USD pair) and Binance (USDT pair).

This indicator’s value basically provides hints about how the buying or selling behaviors on these two largest platforms in the sector differ from each other right now.

When the metric has a positive value, it means that the price listed on Coinbase is higher than on Binance currently. Such a trend implies the former platform’s users are participating in a higher amount of buying (or lower amount of selling) than the Binance users.

On the other hand, the indicator being positive suggests that Binance might be observing a higher degree of buying pressure at the moment as the price listed on the exchange is greater.

Now, here is a chart that shows the trend in the Bitcoin Coinbase Premium Gap since the start of the year:

Bitcoin Coinbase Premium Gap

As displayed in the above graph, the Bitcoin Coinbase Premium Gap has observed a sharp plunge down into the negative territory during the past day or so. Before this plummet, the indicator had been mostly at positive values since the start of the year.

There were a few dips into the red zone earlier as well, but the indicator only attained minor negative values during these drops. This time, though, the premium is down to significantly negative levels.

The price surges this year were being driven by the buyers on Coinbase, as the price rose every time the premium did as well. Coinbase is popularly known to be used by US institutional investors, so the green premium suggested that these large entities were buying, most likely in anticipation of the ETFs, which finally gained approval on January 10th.

A while after this approval, BTC went on to sharply rally toward the $49,000 level, but the asset’s run was very short-lived as its price plummeted hard back towards the price prior to the move, thus erasing all the gains.

The Coinbase Premium Gap had been notably positive alongside the surge, but the indicator then showed its plunge into the negative territory alongside this quick retrace. It would appear that some American institutional traders may have used the opportunity to harvest their profits.

BTC Price

Bitcoin has been moving sideways since the quick rally and drawdown, as its price is still floating around the $45,800 level.

Bitcoin Price Chart

Sell The News: Bitcoin Short-Term Holders Participate In $2 Billion Selloff

On-chain data shows that Bitcoin short-term holders have deposited $2 billion in BTC to exchanges, the fourth largest amount in the last two years.

Bitcoin Short-Term Holder Exchange Inflows Have Spiked Up

As analyst James V. Straten explained in a new post on X, the BTC short-term holders have potentially participated in a very sizeable selloff recently. The “short-term holders” (STHs) are the Bitcoin investors who bought their coins within the last 155 days.

The STHs comprise one of the two main divisions of the BTC market based on holding time; the other segment is called the “long-term holder” (LTH) cohort and includes the holders who mature past the 155-day cutoff.

Statistically, the probability that a holder would sell or move their coins on the blockchain drops the longer they keep them dormant. As such, the STHs are more likely to participate in selling at any point than the LTHs.

This behavior of the STHs is usually especially apparent whenever the cryptocurrency observes a sharp rally or crash, as these fickle-minded investors can’t help but fall prey to the FOMO or FUD of the situation.

One way to track whether the STHs are selling or not is through their exchange inflows. Investors may deposit to these central entities when they want to sell, so the volume going to these platforms can naturally provide some measure of the degree of selling pressure the holders are currently exerting.

Now, here is a chart that shows the trend in the Bitcoin STH transfer volume going towards exchanges (in USD) over the past couple of years:

Bitcoin STH Exchange Inflows

As displayed in the above graph, the Bitcoin volume going from the wallets held by the STHs toward the exchanges has registered a spike recently. “Yesterday, over $2B worth of Bitcoin got sent to exchanges from STHs,” notes Straten.

From the chart, it’s apparent that during the last couple of years, there have only been three instances where the market saw these weak hands transfer more significant amounts to these platforms.

According to the analyst, $1.3 billion of the total $2 billion inflow volume from the STHs involved coins carrying some profits. While the rest, $750 million, moved at a loss.

If these inflows were indeed for selling, it would appear that both types of sellers were in the market during the spike: those capitulating at a loss and those harvesting their profits. Straten remarks that the profitability ratio of this inflow volume is a bit suspicious, as the asset mostly moved flat or negative during this period.

This potential selloff from the STHs has come as the Bitcoin spot ETF is not far from being decided by the US SEC. The commission’s X account was also compromised earlier, and someone posted a fake approval announcement using it, to which the market reacted strongly.

Given the timing of the inflows, it would appear that the BTC STHs expect the event to be a sell-the-news type of deal, so once the decision is made, more inflows could follow.

BTC Price

At the time of writing, Bitcoin is trading at around $45,200, up more than 4% in the past week.

Bitcoin Price Chart

Bitcoin Whales Do $2.2 Billion Selloff, But BTC Stays Strong

On-chain data shows Bitcoin whales have sold $2.2 billion worth of BTC in the past week, but price has continued to hold strong so far.

Bitcoin Whales Have Distributed Around 50,000 BTC In Past Week

As pointed out by an analyst in a post on X, the BTC whales have been participating in some selling over the past week. The relevant indicator here is the “Supply Distribution” metric from the on-chain analytics firm Santiment, which tells us about the total amount of Bitcoin that the different investor groups are carrying in their combined wallets currently.

In the context of the current discussion, “whale” entities are of interest. These humongous investors are typically defined to be the addresses who carry between 1,000 to 10,000 BTC.

At the current exchange rate of the asset, this range converts to about $43.8 million at the lower end and $438 million at the upper limit. Due to the sheer scale of their holdings, the whales can carry some influence, and therefore, they can be entities worth tracking on the blockchain.

Now, here is a chart that shows the trend in the Bitcoin Supply Distribution specifically for these large holders over the past month:

Bitcoin Whale Supply

As displayed in the above graph, the supply held by the Bitcoin whales has been showing a decline in the past week, after remaining stagnant for the preceding few weeks.

Most of the selling had come while BTC was still trading at the recent lows, suggesting that these were whales who had been panicking after BTC had failed its recovery run towards $44,000.

In total, these humongous investors have shed about 50,000 BTC from their combined wallets during this latest selloff, which is worth almost $2.2 billion right now.

Despite this selling, Bitcoin has gone on to hit another local bottom and make a recovery push again, this time actually making a retest of the $44,000 level (although the asset has slumped again since then, as it’s now trading below the mark once more).

Another analyst has also given a whale selling alert in a CryptoQuant Quicktake post, citing the data for the “exchange inflow mean,” which is an indicator that measures the mean amount of Bitcoin that’s being transferred to centralized exchanges.

quicktake-image

Exchange inflows can be a sign of selling as investors generally use these platforms for this purpose. The mean value of these deposit transactions shooting up naturally implies that large entities like the whales are involved and potentially participating in a selloff.

From the chart, it’s apparent that this metric has seen a couple of spikes in the last two days, suggesting that the whales are still continuing to make moves towards selling.

BTC Price

At the time of writing, Bitcoin is trading around $43,500, up 3% in the past week.

Bitcoin Price Chart

Bitcoin Sharks & Whales Do $2.2 Billion Selloff, But BTC Hangs On At $37,000

On-chain data shows the Bitcoin sharks and whales have participated in a selloff of around $2.2 billion during the past week.

Bitcoin Wallets With 100 To 10,000 BTC Have Been Selling Recently

As pointed out by analyst Ali in a post on X, the large BTC investors might have been harvesting their profits recently. The indicator of interest here is the “BTC Supply Distribution,” which keeps track of the total amount of Bitcoin the different wallet groups in the sector are holding.

The addresses or investors are divided into these groups based on the total number of coins they currently carry. For instance, the 1 to 10 coins cohort includes all wallets with a balance of at least 1 and at most 10 BTC.

In the context of the current discussion, the 100 to 10,000 BTC range is of focus. The 100 to 1,000 coins group is popularly called the “sharks,” while the 1,000 to 10,000 cohort includes the whales.

Both groups carry significant amounts, so their behavior can be relevant for the wider market. Though the whales are much larger of the two, and thus hold much more influence on the network.

Now, here is a chart that shows the trend in the combined Supply Distribution of the Bitcoin sharks and whales over the past couple of months:

Bitcoin Sharks & Whales

As displayed in the above graph, the 100 to 10,000 coins Bitcoin investors have seen their supply go through a steep drawdown during the past week. During this drop, these humongous entities have sold around 60,000 BTC, worth about $2.2 billion at the current asset price.

This is a notable amount, and considering that the timing of the distribution has coincided with BTC’s latest break above the $37,000 level, it would appear possible that these key holders have participated in this huge selloff to harvest the profits that they would have amassed in the rally.

The sharks and whales also took part in some selling when BTC had broken above $35,000 last month, but both the rate and the scale of the selloff were lesser when compared to the one now, as the Supply Distribution for these cohorts has plunged rather steeply this time around.

So far, however, despite this large selloff, Bitcoin hasn’t had much trouble maintaining around the $37,000 mark. The asset initially saw a pullback when the selling started, as it retraced towards $36,000, but it rebounded back quickly enough.

That said, BTC may not be able to break out of its sideways movement toward the upside without the backing of the sharks and whales. The aforementioned surge towards the $37,000 had also occurred just after these investors had made some huge buying moves.

BTC Price

Bitcoin has continued to consolidate around the $37,000 level during the past few days as the chart below shows.

Bitcoin Price Chart

This Metric Suggests Bitcoin Could Be In Danger Of Another Selloff

A Bitcoin on-chain indicator is currently forming a pattern that has previously led to significant selloffs of the cryptocurrency.

Bitcoin 100-Day SMA Supply Adjusted Dormancy Has Rapidly Gone Up

As pointed out by an analyst in a CryptoQuant post, the selloff could potentially be even stronger than the one seen in November 2018. A relevant concept here is of a “coin day,” which is the amount of 1 BTC accumulated after sitting still on the chain for 1 day. Thus, when a token stays dormant for a certain number of days, it gains coin days of the same amount.

However, when this coin is finally moved, its coin days naturally reset back to zero, and the coin days it had previously accumulated are said to be destroyed. An indicator called the “Coin Days Destroyed” (CDD) measures the total amount of such coin days being destroyed through transfers on the entire Bitcoin network.

When the CDD is divided by the total number of coins being involved in transactions, a new metric called the “average dormancy” is obtained. This metric is so named because it tells us how dormant the average coin being transferred on the chain currently is (as dormancy is nothing but the number of coin days).

When the average dormancy is high, it means coins being moved right now are quite aged on average. On the other hand, low values imply investors are currently transferring coins that they only recently acquired.

Now, here is a chart that shows the trend in the 100-day simple moving average (SMA) Bitcoin dormancy over the last few years:

Bitcoin Supply Adjusted Dormancy

Note that the version of the metric in the graph is actually the supply-adjusted dormancy, which is simply calculated by dividing the original indicator by the total amount of Bitcoin supply that’s currently in circulation.

The reason behind this change lies in the fact that the supply of the crypto isn’t constant, but rather moving up with time. So, accounting for this adjustment makes it so that comparisons with previous cycles are easier to do.

As you can see in the above chart, the Bitcoin supply-adjusted dormancy has been on a steady uptrend since the lows observed following the FTX crash. This means that the old supply has been observing rising activity recently, suggesting that the long-term holders might be exerting selling pressure on the market.

The quant notes that a similar trend in the indicator was also seen back in August 2018, where the metric started on an uptrend from the lows seen early in that month. Three months after this uptrend started, BTC observed its final leg down of the bear market, during the crash of November 2018.

If this previous trend is anything to go by, then Bitcoin could be at risk for another selloff soon. And since the uptrend in the metric this time around is even sharper, a potential plunge might be deeper as well.

BTC Price

At the time of writing, Bitcoin is trading around $20,900, up 11% in the last week.

Bitcoin Price Chart

Bitcoin On-Chain Data: Selling From Whales Holding 1k+ BTC Behind Crash

On-chain data shows Bitcoin whales with more than 1k BTC were the main sellers in the latest crash, as other cohorts displayed muted activity.

Bitcoin Spent Output Value Bands Shows Spike From 1k-10k Group

As pointed out by an analyst in a CryptoQuant post, unlike in the previous declines, the 10-100 BTC and 100-1k BTC cohorts didn’t show any spikes in activity during the latest crash.

The relevant indicator here is the “Spent Output Value Bands” (SOVB). which displays the number of coins being moved by each value band in the Bitcoin market.

These “value bands” or groups are divided based on the amount of coins moved in each transaction on the chain. For example, the 1k-10k BTC value band includes all transfers that involved between 1k and 10k BTC.

The Spent Output metric for this value band then specifically measures the total amount of Bitcoin that was shifted using transactions of size falling in this range.

Now, here is a chart that shows the trend in the Bitcoin SOVB for 10-100 BTC:

Bitcoin Spent Output Value Bands

The value of the metric seems to have been normal recently | Source: CryptoQuant

As you can see in the above graph, during the previous selloffs, the Bitcoin Spent Output chart for the 10-100 BTC value band spiked up, suggesting that investors with at least 10 to 100 BTC were heavily selling their coins.

A similar trend was also seen for the 100-1k BTC value band, as the below chart displays.

Bitcoin Sharks

Looks like this metric has also not significantly gone up in recent days | Source: CryptoQuant

In the most recent crash, however, while there was a spike in these indicators, it was nowhere near as sharp as in the previous instances. This suggests that these value bands didn’t see much dumping this time.

The 1k-10k BTC cohort, though, has showed a different behavior. Below is the Spent Output graph for this value band.

Bitcoin Whales

The indicator has shot up | Source: CryptoQuant

As is apparent from the chart, the 1k-10k BTC value band registered a large amount of movement in the crash, suggesting that transactions worth more than 1k BTC accounted for the majority of the selling this time around. Such big transfers belong to the whales, meaning that whales drove this crash.

While whale dumping is negative for the market, the quant notes that the decline in the other two cohorts could be a sign that selling pressure is now almost exhausted in the Bitcoin market.

BTC Price

At the time of writing, Bitcoin’s price floats around $17.1k, down 15% in the last week.

Bitcoin Price Chart

BTC plummets down | Source: BTCUSD on TradingView
Featured image from Georg Wolf on Unsplash.com, charts from TradingView.com, CryptoQuant.com

Bitcoin Coinbase Premium Gap Approaches Zero, Selloff Ending?

On-chain data shows the Bitcoin coinbase premium gap has improved recently and is now approaching a neutral value, suggesting the selling pressure may be drying up.

Bitcoin Coinbase Premium Gap Close To Zero, But Still Negative

As pointed out by an analyst in a CryptoQuant post, the selling pressure from US investors seems to have reduced in recent days.

The “Coinbase Premium Gap” is an indicator that measures the difference in the Bitcoin prices listed on crypto exchanges Coinbase (USD pair) and Binance (USDT pair).

The quant notes that US investors are known to use the Coinbase platform, especially high-net entities and institutions.

When the value of this metric is positive, it means the price on Coinbase is higher at the moment. Such a trend suggests there has been buying from US investors recently.

Related Reading | Bitcoin Whale Presence On Derivatives Still High, More Volatility Ahead?

On the other hand, a negative premium gap implies there has been some selling on the crypto exchange as the price is lesser than on Binance.

Now, here is a chart that shows the trend in the Bitcoin Coinbase premium gap over the year 2022 so far:

The value of the metric looks to be negative right now | Source: CryptoQuant

As you can see in the above graph, the Bitcoin Coinbase premium gap has been negative in the last couple of months.

During the LUNA crash, it reached a highly red value of $131, which means there was some heavy selling from US investors then.

During the consolidation period that followed, as well as during the latest crash, the value of the indicator moved sideways around a negative $20.

Related Reading | Is Bitcoin Like Buying Google Early? Check Out The Shocking Comparison

Over the last few days, however, the trend seems to have changed and the premium gap is now observing some upwards movement.

While the indicator still has a negative value, it’s quite close to zero now as the gap between Coinbase and Binance stands at just -$5.

This shows that the selling pressure from US investors has been dying down recently, a sign that could prove to be bullish for the price of Bitcoin.

BTC Price

At the time of writing, Bitcoin’s price floats around $21.2k, up 11% in the last seven days. Over the past month, the crypto has lost 28% in value.

The below chart shows the trend in the price of the coin over the last five days.

Looks like the value of the crypto has been going up over the last few days | Source: BTCUSD on TradingView

Since the low below $18k, Bitcoin has been trying to gradually make some recovery. However, the crypto is currently finding it difficult to leave the $21k level.

Featured image from Unsplash.com, charts from TradingView.com, CryptoQuant.com

Bitcoin Short-Term Holders Were Behind The Selloff To Below $36k

On-chain data shows Bitcoin short-term holders seem to have been behind the latest selloff that has taken the price of the crypto below $36k.

Bitcoin Investors Holding Coins Aged Between 1 Day And 6 Months Sold Big Yesterday

As pointed out by an analyst in a CryptoQuant post, short-term holders seem to have sold the heaviest during the recent selloff.

The relevant indicator here is the “exchange inflow,” which measures the total amount of coins moving into exchange wallets.

A modification of this metric is the “exchange inflow spent output age bands.” it tells us how much the different Bitcoin holder groups are contributing to the inflow.

The various groups are divided based on how many days the investors held their coins before transferring them to the exchange.

The 1-day to 6-month coin age group is generally considered the “short-term holders” (STH). This cohort is usually the likeliest to sell their coins.

All investors holding their Bitcoin for longer periods of time are the “long-term holders” (LTH). Now, here is a chart that shows the trend in the below 6-month and between 6 to 18-month age group inflows over the last few months:

Looks like STH inflows spiked up recently | Source: CryptoQuant

As you can see in the above graph, the 1-day to 6-month coin age group sent a large amount of coins just yesterday.

The inflow spike amounted to more than 60k coins being transferred by this group. Investors usually send their Bitcoin to exchanges for selling purposes, hence these coins took part in the selloff that has now taken the price below $36k.

Related Reading | One Coin, Two Trades: Why Bitcoin Futures And Spot Signals Don’t Match Up

The 6-month to 18-month group, on the other hand, doesn’t seem to have moved too many coins over the past day.

The older Bitcoin LTH groups have also not shown much activity recently. The below chart shows the trend in their inflows.

The 1.5-year to 3-year cohort only looks to have sold around 500 BTC yesterday | Source: CryptoQuant

From these trends, it seems like the only investors that took part in the selling yesterday were the short-term holders, who are generally the more fickle ones. The long-term holders still look to be holding strong.

Related Reading | Bitcoin Long Squeeze Incoming? Funding Rates Surge Up

BTC Price

At the time of writing, Bitcoin’s price floats around $35.8k, down 8% in the last seven days. Over the past month, the crypto has lost 21% in value.

The below chart shows the trend in the price of the coin over the last five days.

The price of Bitcoin seems to have plummeted down over the past day | Source: BTCUSD on TradingView

Featured image from Unsplash.com, charts from TradingView.com, CryptoQuant.com

On-chain Data Suggests Bitcoin Miners Were Behind The Selloff

On-chain shows Bitcoin miner outflows have been elevated recently, suggesting miners were involved in the recent selloff that took the price of the crypto below $42k.

Bitcoin Miner Outflows Spiked Up Before The Crash Below $42k

As pointed out by an analyst in a CryptoQuant post, BTC miners seem to have been one of the sellers behind the price drop to $42k.

The relevant indicator here is the “miner outflow,” which measures the total amount of Bitcoin exiting wallets of all miners.

When the value of this metric spikes up, it means miners are moving a large number of coins out of their wallets right now. Such a trend can be bearish for the price of the crypto as it may be a sign of dumping from these original whales.

Related Reading | Ark CEO Cathie Wood Is As Bullish As Ever, Sees Bitcoin Hitting $1 Million By 2030

On the other hand, low values of these outflows suggest a normal or healthy amount of selling from miners. This trend, when sustained, can prove to be bullish for the BTC price.

Now, here is a chart that shows the trend in the Bitcoin miner outflows over the past several months:

Looks like the value of the indicator has shot up recently | Source: CryptoQuant

As you can see in the above graph, the Bitcoin miner outflows seem to have shown spikes in recent weeks, just before the selloff.

This would suggest that miners look to have played a role in the dump recently, sending the price of the coin diving below the $42k level.

A trend like this has been observed a few times in the past several months already, as the quant has marked in the chart.

Related Reading | Mexico’s Third Richest Man Says No To Bonds, Yes To Bitcoin

Currently, it’s unclear whether Bitcoin miners have already calmed down or if more selling is coming in the next few days.

BTC Price

After around twenty days of holding strongly above the level, Bitcoin’s price is now once again revisiting the $41k mark.

At the time of writing, the coin’s price floats around $41.1k, down 11% in the last seven days. Over the past month, the crypto has gained 4% in value.

The below chart shows the trend in the price of BTC over the last five days.

The value of BTC seems to have taken a plunge over the past twenty-four hours | Source: BTCUSD on TradingView

Due to this sharp downtrend in the price of the coin as well as the wider market, crypto futures has collected a huge amount of liquidations today. In the last 24 hours, liquidations have amounted to more than $322 million, $175 million of which occurred in the past 4 hours alone.

Featured image from Unsplash.com, charts from TradingView.com, CryptoQuant.com

Current Stretch Of Bitcoin Fear Surpasses 2021 Selloff

Data shows the current stretch of Bitcoin fear has surpassed that during the 2021 selloff as market continues to be extremely fearful.

Bitcoin Fear And Greed Index Shows Market Sentiment Is Again Extremely Fearful This Week

As per the latest weekly report from Arcane Research, sentiment among BTC investors has once again been that of extreme fear this week.

The “fear and greed index” is an indicator that tells us about the general sentiment currently among Bitcoin holders.

The metric uses a numeric scale that goes from one to hundred for representing this sentiment. All values above fifty signal “greed” in the market, while index values below the cutoff imply holders are fearful right now.

Extreme values of above 75 and below 25 indicate market sentiments of extreme greed and extreme fear, respectively.

Historically, Bitcoin tops have usually formed while investors are extremely greedy. Similarly, bottom formations have taken place during periods of extreme fear.

Because of this, some investors think buying during extreme greed is the best, while extreme fear is ideal for selling.

Related Reading | 82% Of Bitcoin Short-Term Holder Supply Now In Loss, Capitulation Ahead?

This investment philosophy is called “contrarian trading.” Warren Buffet sums it up the best: “Be fearful when others are greedy, and greedy when others are fearful.”

Now, here is a chart that shows the trend in the Bitcoin fear and greed index over the past year:

The indicator’s value seems to be around 21 at the moment | Source: Arcane Research’s The Weekly Update – Week 10, 2022

As you can see in the above graph, the Bitcoin fear and greed index has been in fear (usually extreme fear) territory since November 2021 now, with the exception of a couple spikes to neutral values (around 50) that lasted very brief.

This stretch of fear is now longer than the one following the selloff last year between May 2021 and July 2021. Currently, the metric has a value of 21, indicating the market is extremely fearful.

Related Reading | Bitcoin Detractor Peter Schiff Lays On What Will Trigger Bitcoin Recovery

Last week as well the general investor sentiment was that of extreme fear. If contrarian investing is anything to go by, periods like now may be a good time to buy more Bitcoin.

The macro uncertainties looming over the market like the Russian invasion of Ukraine may be fueling the current fear sentiment. Right now, it’s hard to say when greed may return among BTC investors.

BTC Price

At the time of writing, Bitcoin’s price floats around $40.4k, down 4% in the last seven days. The below chart shows the trend in the price of BTC over the last five days.

BTC’s price looks to have surged up over the past 24 hours | Source: BTCUSD on TradingView
Featured image from Unsplash.com, charts from TradingView.com, Arcane Research