Bitcoin Hash Ribbons Form Capitulation Signal: What It Means

On-chain data shows the Bitcoin Hash Ribbons have recently gone through a crossover. Here’s what it could mean for the cryptocurrency.

Bitcoin Hash Ribbons Suggest Miner Capitulation Is On

As explained by CryptoQuant community manager Maartunn in a Quicktake post, miners are capitulating right now if the Hash Ribbons indicator is to be believed. This on-chain metric is generally used to determine whether miners are in distress.

BTC runs on a proof-of-work (PoW) consensus mechanism where miners play the role of validators and compete against each other using computing power to get a chance to add the next block to the chain.

This computing power, when measured across the network, can provide insight into the health of the miners as a whole. Due to this reason, the Hash Ribbons indicator makes use of this total Bitcoin “Hashrate” to judge the situation of the miners.

Naturally, a rise in the Hashrate suggests the network is attracting miners right now, while a decline could imply low profitability is making some of these validators pull out from BTC.

The Hash Ribbons indicator uses two moving averages (MA) of the Hashrate, 30-day and 60-day, to represent whether these behaviors are particularly intense or not at the moment. When the 30-day ribbon moves under the 60-day one, it suggests that miners are mass capitulating. On the other hand, the opposite cross suggests network is observing growth again.

Now, what relevance do these trends have for Bitcoin? According to Charles Edwards, the creator of the Hash Ribbons, the miners have historically been quite resilient, and they only quit when things get especially bad for the cryptocurrency. As such, the market may be more likely to approach a bottom whenever these chain validators show capitulation.

Below is a chart that shows how the miners’ behaviour has looked recently according to this indicator:

quicktake-image

As Maartunn has highlighted in the graph, the Bitcoin Hash Ribbons have seen a crossover recently. More specifically, the cross has involved the 30-day moving under the 60-day, implying that the miners are capitulating.

Miner profits come down to three factors: BTC spot price, transaction fees, and electricity costs in the area that they are located in. Historically, the fees has been quite low in comparison to the block rewards, so miner financials have been dependent on the price (as the block rewards only have this variable attached to them) and electricity prices.

Recently, the BTC price has been stuck in consolidation while the block rewards have been slashed in half in the latest Halving event. This has led to tightening revenues for these chain validators, so it’s not surprising to see that the miners with the least efficient machines have already started ditching the network in hordes.

In the chart, past instances of miner capitulation are shown with the green lines. It’s visible that while miner capitulation has generally indeed occurred near profitable buying points into the asset, these bottoms haven’t immediately appeared after the crossovers have occurred. As the analyst notes, “It unfolds in the subsequent days and weeks after less efficient miners throw in the towel.”

BTC Price

Bitcoin has continued to move overall flat over the past week as its price is still trading around $62,700.

Bitcoin Price Chart

Start Selling Bitcoin When This Happens, This Quant Says

A quant has explained that the past pattern in the Bitcoin taker buy-sell ratio metric may suggest the best window to start selling the asset.

Bitcoin Taker Buy Sell Ratio May Reveal Selling Opportunities

In a CryptoQuant Quicktake post, an analyst discussed the trend in the Bitcoin “taker buy sell ratio.” This indicator keeps track of the ratio between the Bitcoin taker buy and taker sell volumes.

When the value of this metric is greater than 1, the investors are willing to purchase coins at a higher price right now. Such a trend implies a bullish sentiment is the dominant force in the market.

On the other hand, the indicator being under the mark suggests the selling pressure may be higher than the current buying pressure in the sector. As such, the majority may share a bearish mentality.

Now, here is a chart that shows the trend in the 30-day moving average (MA) Bitcoin taker buy-sell ratio over the last few years:

Bitcoin Taker Buy Sell Ratio

As the above graph shows, the 30-day MA Bitcoin taker buy-sell ratio has recently fallen below the 1 level. The quant has highlighted in the chart the region of the metric where the bull run peaks in 2021 formed.

The indicator would appear to dip below 0.97 during both the heights registered in that bull run. According to the analyst, such indicator values suggest the euphoria phase of the market where the smart money starts to sell. Still, the prices continue to hold on as the retail investors continue to FOMO into the asset.

So far, the indicator has approached the 0.98 level in its latest decline, implying that it’s not yet at the levels where the possibility of a top might become significant if the pattern of the previous bull run is anything to go by.

The Bitcoin taker buy sell ratio may also be used as a buying signal, with the 1.02 level being an important level. The quant notes, however, that the metric is better at showing an overbought market than it is for pinpointing oversold conditions.

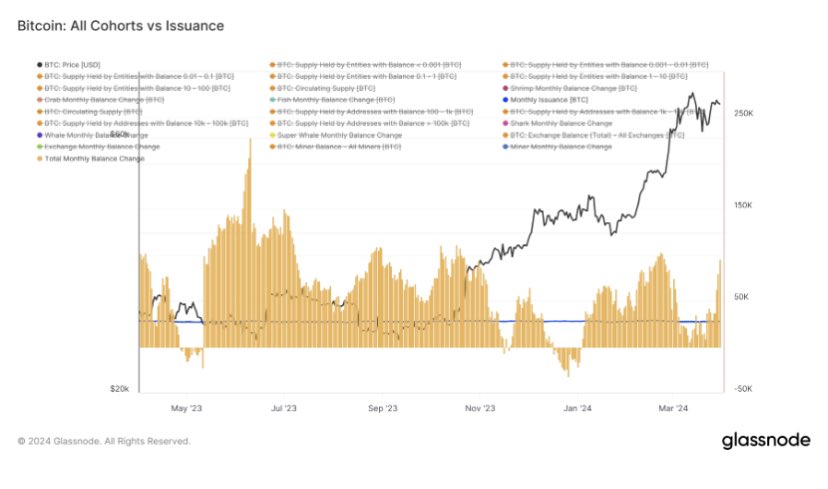
In other news, as an analyst pointed out in a post on X, all the Bitcoin investor groups have accumulated a net amount of 95,000 BTC ($6.5 billion at the current exchange rate) over the past month.

Bitcoin Accumulation

This rapid accumulation suggests that the Bitcoin investor groups have been buying up significantly more than the miners have produced. The chart shows that an accumulation streak of similar levels followed the recent rally in the asset, so this latest one can also be bullish for the asset.

BTC Price

At the time of writing, Bitcoin is trading at around $68,600, up more than 3% over the past week.

Bitcoin Price Chart

Bitcoin FOMO Hasn’t Spiked Yet: Green Signal For Rally To Continue?

Data shows social media users aren’t yet showing FOMO around Bitcoin, a sign that the current rally could still have the potential to continue.

Bitcoin Social Volume Hasn’t Been Too High Recently

According to data from the analytics firm Santiment, the crowd FOMO that may be associated with a rally like BTC has seen recently hasn’t yet cropped up on social media.

The indicator of interest here is the “Social Volume,” which keeps track of the total amount of discussion any given topic or term is receiving on the major social media platforms right now.

The metric measures this by counting up the posts/threads/messages that are making at least one mention of the given term. The reason it tracks the number of posts themselves rather than the mentions is so that a few threads with a significant number of mentions can’t skew the indicator by themselves.

When a topic truly receives widespread attention on social media, a large number of posts crop up as users across the platforms participate in talks. Mentions, on the other hand, can sometimes spike just because some niche circles decide to discuss the term.

As such, measuring Social Volume through posts is what provides a better representation of the general trend being followed. Now, here is a chart that shows the trend in the indicator for terms related to Bitcoin and cryptocurrency:

Bitcoin Social Volume

As displayed in the above graph, the Bitcoin Social Volume hasn’t been too out of the ordinary recently, despite the sharp rally that the asset’s price has witnessed.

Generally, the indicator tends to rise as rapid moves in the cryptocurrency take place since users get spurred to talk more about the coin. When discussions rise too high, though, it’s often a sign that FOMO is increasing in the sector.

Historically, Bitcoin has tended to move against the expectations of the majority, so such a rise in FOMO has often resulted in top formations for the asset. When discussions rise alongside a drawdown instead (that is, a signal that FUD is going up), a bottom rather takes place for the coin.

From the chart, it’s visible that last month, the indicator registered a spike around the time of the spot ETF approvals, which coincided with the top, but such FOMO hasn’t reappeared for the coin yet.

“Despite Bitcoin’s +74% price rise in 4 months, the crowd FOMO that would normally be associated with this kind of surge has not been present,” notes the analytics firm.

“There was certainly an interest in BTC in the weeks directly before and after the SEC’s approval of 11 ETF’s, but the lack of new greed in the space can actually be considered a promising sign that this rally can continue,” explains Santiment.

BTC Price

Bitcoin has seen some pullback in the past day as its price has slipped under the $51,000 level.

Bitcoin Price Chart

Why An 18% Drop In Bitcoin Could Still Be Bullish

Bitcoin is currently experiencing a downward correction after the price moved past $50K on Monday. While corrections down are to be expected with such a rally, indicators point to this being a bearish scenario for bitcoin. The price looks set to drop further after this correction. This would most likely see bitcoin lost a good percentage of the gains it had made last week.

Related Reading | South African Man Loses $900,000 Worth Of Bitcoin After Accidentally Deleting Keys

Even though bearish scenarios look negative for the market at large, this scenario is most likely going to play into the favor of bitcoin. Bullish indicators are much easier to spot as indicating an upward trend. But bearish indicators can do as well a job when it comes to speculating on the movement of the digital asset. This current bearish scenario puts BTC in a position to experience a significant downward drop from here on out.

Bitcoin Set To Lose 18%

Current trends, when compared to that of the previous bull markets, show that a bearish situation is most likely the next setup for the digital asset. This scenario would see the price of bitcoin drop 18% in the coming weeks. Leading to a price drop that would put the floor of the downtrend at $41. This meaning bitcoin would end up losing over $9K from its recent high of $50K.

BTC set to witness an 18% drop | Source: Twitter

While an 18% price drop is significant, this is needed to complete a setup that would most likely send bitcoin barreling up to $100K. These indicators are behind the recent ambitious price predictions of analysts across the crypto space putting the price of BTC by the end of the year at $100K. The price drop will provide an opportunity for investors to buy into the asset while the market gathers momentum.

A bullish signal that would drive the price of bitcoin up 250% got triggered last week. Bitcoin hash ribbons have shown significant buy pressure in the market.  The only catch is a dip is required to complete this trigger. An 18% dip would be the perfect setup for this signal. Completely the bullish setup that saw the price of BTC move up 250% last time a setup like this was completed.

Bullish setup requires dip to complete | Source: Twitter
Some Bullish Indicators In The Market

Other things are most likely going to play into the rebound of bitcoin after the dip. Significant buy pressure in the market will see the value of the digital asset go up. While a dip will further encourage this buying pressure by providing an opportunity for investors to buy in at a slightly lower price in wait for the next run-up.

BTC price drops back down to $47K | Source: BTCUSD on TradingView.com

Data also shows that holders of BTC are holding for the long term now. This is evident in the number of short-term holders hitting an all-time low. Long-term holding bitcoin addresses have increased. Diamond hands are becoming the more popular way to invest in cryptocurrencies. Hence introducing scarcity into the market as investors consolidate their coins to long-term holding addresses.

Related Reading | Here’s What Bitcoin Exchange Inventory Levels Means For The Bull Rally

Last but not least is market sentiment. For most of the months following the all-time high, market sentiment had gone into extreme fear. With the recent resumption of the rally, market sentiment has risen out of extreme fear and overall market sentiment has now moved into extreme greed. This plays further into the buying pressure that is currently being experienced in the market because investors, old and new alike, want a share of what bitcoin has to offer.

Featured image from CNBC.ca, charts from Twitter and TradingView.com