Timing The Breakout: When Will Bitcoin Escape The Post-Halving Consolidation?

Bitcoin (BTC), the largest cryptocurrency in the market, has been trading within a re-accumulation range between the $59,000 and $70,000 price levels for the past month and a half. 

Crypto analyst Rekt Capital recently shared its perspective on this phase and its potential duration, drawing from historical patterns and data in a post on social media platform X (formerly Twitter).

Breakout Timing And Historical Patterns

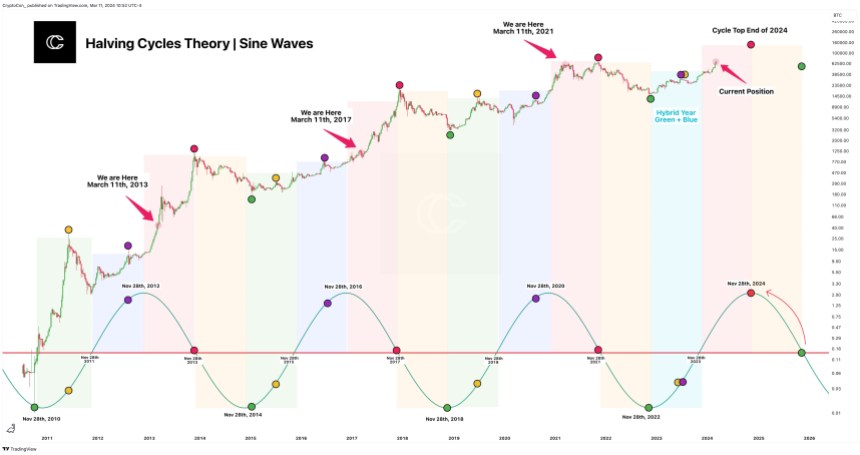
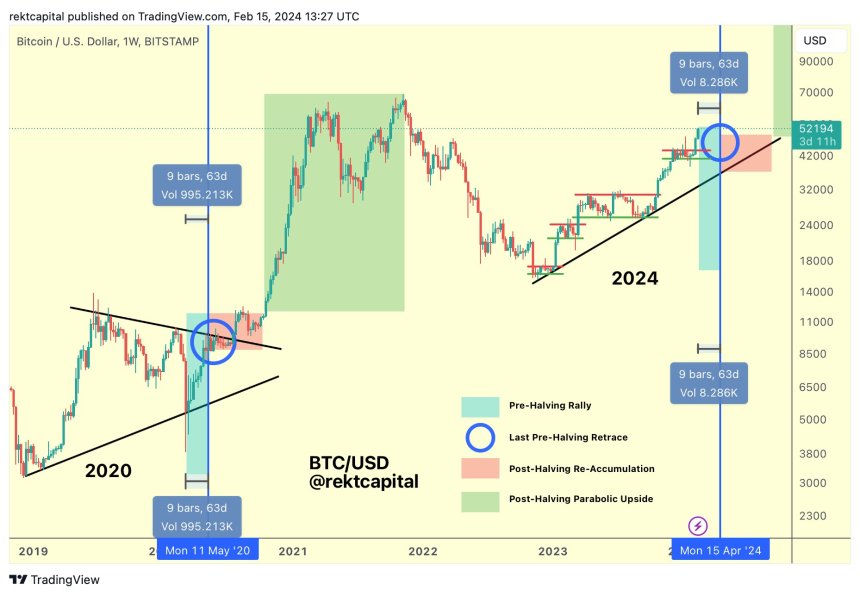
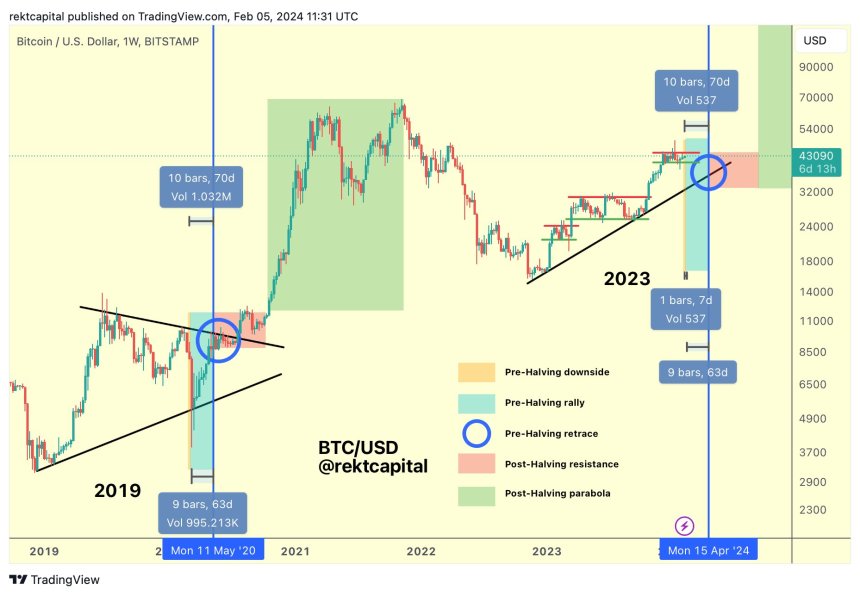
According to Rekt’s analysis, Bitcoin tends to experience a re-accumulation range following the Halving event, which occurs every four years to counteract any inflationary effect on Bitcoin by lowering the reward amount for miners and maintaining scarcity. 

Historically, This consolidation phase lasts up to 150 days before Bitcoin breaks into a parabolic uptrend. Based on this pattern, if Bitcoin continues to consolidate for the next 150 days, Rekt suggests a breakout would be expected in September 2024.

The ideal duration of a re-accumulation range is crucial in determining Bitcoin’s future trajectory. Rekt Capital noted that when Bitcoin reached a new all-time high (ATH) of $73,700 in mid-March, it accelerated its cycle by 260 days. However, with over 49 days of consolidation, the acceleration has reduced to approximately 210 days.

Resetting The Bitcoin Halving Cycle

Repeating historical trends, where Bitcoin consolidates for 150 days after the Halving, would still indicate an acceleration in the current cycle, albeit by a lesser extent of 60 days. 

Nevertheless, Rekt contends that Bitcoin would ideally need to consolidate for at least 210 days to fully resynchronize with its historical Halving cycles and reset the current acceleration in this cycle to 0. This would bring the rate of acceleration to 0 days and potentially lead to a breakout around November 2024.

The analyst further suggested that to achieve a 200+ day post-Halving consolidation and fully resynchronize with historical Halving cycles, Bitcoin would need to replicate its mid-2023 re-accumulation range, which lasted 224 days before a new uptrend emerged. Rekt concluded:

Overall, how long this current Re-Accumulation Range will last will dictate the remaining acceleration in this cycle and ultimately influence where Bitcoin will finally peak in its Bull Market. 

Bitcoin

The largest cryptocurrency, with a market capitalization of $1.2 billion, is currently trading at $64,400, showing minimal fluctuations compared to Thursday’s price movements. 

Recently, Bitcoin has encountered resistance at the $66,000 level, hindering its ability to consolidate above this threshold. Conversely, the $63,400 level may serve as a support base for the cryptocurrency in the event of heightened downward volatility over the weekend.

Featured image from Shutterstock, chart from TradingView.com

Vertex AI Price Forecast: Bitcoin Has 60% Chance Of Hitting $100,000, Key Predictions Unveiled

On-chain analytics firm Spot On Chain’s team of analysts, using Google Cloud’s Vertex artificial intelligence (AI), has conducted an in-depth analysis to forecast the future price of Bitcoin (BTC). 

Their latest report provides valuable insights into the leading cryptocurrency’s short-, medium-, and long-term outlook.

Bitcoin Price Forecasts

According to Spot On Chain’s report, Bitcoin prices are expected to fluctuate between $56,000 and $70,000 during May, June, and July 2024. 

This projected range indicates the potential for market volatility, with a 48% probability assigned to the scenario where BTC prices may dip below $60,000. Moreover, the report advises a cautious approach, acknowledging the possibility of short-term fluctuations or corrections in the price.

Spot On Chain’s analysis reveals a significant movement in the latter half of 2024, with a compelling 63% probability of Bitcoin reaching $100,000. 

This mid-term projection reflects a prevailing bullish sentiment in the market, further fueled by anticipated rate cuts after the Federal Open Market Committee’s (FOMC) December 2023 meeting. 

These rate cuts aim to bring the federal funds rate down to 4.6% and are expected to boost demand for risk-on assets such as stocks and Bitcoin.

Looking ahead to the first half of 2025, Spot On Chain’s modeling indicates a strong probability that Bitcoin will cross the $150,000 threshold. Specifically, a 42% probability is assigned to this scenario, indicating a bullish outlook for Bitcoin’s price trajectory.

What’s more, looking at the entire year of 2025, the probability of Bitcoin exceeding $150,000 rises to an eye-popping 70%. Based on historical data and patterns in previous cycles, Bitcoin reached a new all-time high approximately 6 to 12 months after the Halving event

Price Consolidation On The Horizon?

Crypto analyst Retk Capital has also provided insights into the current Bitcoin price action, shedding light on key resistance levels and the potential for a consolidation phase before an anticipated parabolic upside.

According to Retk Capital’s analysis, Bitcoin has consistently been rejected from the $65,600 resistance level, failing to regain it as a support level. 

This resistance zone has significantly impeded Bitcoin’s upward movement in recent days, as seen on the cryptocurrency’s daily BTC/USD chart below. 

Bitcoin

Retk Capital further highlights that Bitcoin has been witnessing downside wicks into a pool of liquidity at approximately $60,600. This occurrence has been observed over multiple weeks, indicating the presence of buyers in that price range. 

If Bitcoin experiences further downward movement, the analyst believes that there is a possibility that it may approach this area once again. The analyst further notes:

Price dropping without context can be emotionally challenging. However, understanding that this downside is part of the consolation within a technical range-bound structure that will precede Parabolic Upside makes this experience much more comforting.

As of this writing, BTC is trading at $63,900, down nearly 8% over the past two weeks and the same percentage over the past 30 days.

Featured image from Shutterstock, chart from TradingView.com

The $86,500 Bitcoin Question: Will The Halving Spark A Price Surge This April?

The cryptocurrency market has undergone a substantial downturn, with many of the top 100 cryptocurrencies experiencing sharp price drops. Bitcoin, the leading digital asset, hit a low of $61,600 on Tuesday. 

However, industry experts suggest a potential rebound to higher highs may be on the horizon as the highly anticipated Halving event draws near. 

Adrian Zduńczyk, a crypto trader and technical analyst, provides valuable insights into the market dynamics, highlighting key factors such as bull market indicators, ETFs, and the imminent Halving event.

Mixed Signals For BTC

According to Zduńczyk’s analysis, the market exhibits bullish signs, with the 200-week and 50-week moving averages (MAs) at $33,700  and $39,900, respectively. 

The Net Unrealized Profit/Loss (NUPL) ratio is 0.55, indicating a favorable trading environment. Additionally, the 7-week correlation with the S&P 500 (SPX) remains firm at 0.71. 

In terms of daily trends, Zduńczyk notes that Bitcoin is currently in a choppy range between $59,000 and $74,000, with the 200-day Simple Moving Average (SMA) rising at $46,600 and the 200-day Bitcoin Production Cost (BPRO) rising at $57,700. 

However, the analyst notes that the medium-term momentum is declining, and the 50-day Average True Range (ATR) volatility has increased to $3270. This suggests that Bitcoin’s overall price trend is losing strength or momentum in the medium-term timeframe.

Bitcoin Aims For $86,500

Zduńczyk highlights the market sentiment. The Fear & Greed Index is at 65, indicating a state of greed among market participants. The analyst notes that the current phase of the market cycle is characterized by belief. 

Moreover, miners are still profitable at prices above $41,800, and as mining difficulty rises post-Halving, a price spike is expected. 

Notably, previous Halving events have triggered substantial price rallies, with Bitcoin experiencing significant gains of 90X, 30X, and 7X. Importantly, Bitcoin has never returned to Halving prices after these rallies.

Examining seasonality trends, the monthly opening price for April stands at $71,000, suggesting a positive outlook for the month. The average gain for April is estimated at 21.95%, implying an end-of-month target of $86,500, according to Zduńczyk. 

Moreover, the period from April 16 to 30 has historically seen average gains of 14.69%, further reinforcing positive expectations and further price gains for BTC during the upcoming weeks. According to Zduńczyk, this timeframe could attract investors seeking to buy the dip. 

Bitcoin

Despite the overall positive outlook, BTC is trading at $62,600, reflecting a consistent decline over the past month. In the last 30 days, BTC has experienced a 9% drop from its mid-March all-time high of $73,700.

Moreover, in its quest for new highs and surpassing the $80,000 threshold, BTC has encountered a significant obstacle at the $70,000 level. Despite surpassing its all-time high, BTC has struggled to consolidate above this level for over a week.

Nonetheless, as emphasized by Zduńczyk, the potential synergy between the success of the ETF market in the United States and the upcoming Halving event may hold the key to revitalizing BTC’s price trajectory. 

Featured image from Shutterstock, chart from TradingView.com

FOMO Gives Way To Fear: Bitcoin-Ethereum Ratio Signals Shift In Crypto Sentiment

The recent ratio between Bitcoin (BTC) and Ethereum (ETH) prices suggests a potential decline in risk appetite within the crypto market. The ratio has reached its highest level since April 2021, indicating a stronger demand for Bitcoin than its smaller rival, Ethereum.

This development has led crypto asset trading firm QCP Capital to speculate that this shift in the ratio could be an early indication of a transition from “fear of missing out” (FOMO) to outright fear. 

Bitcoin And Ethereum Performance

Regarding recent market trends, the second quarter of 2024 has begun with relatively subdued activity. Bitcoin’s price has dipped below the $70,000 mark and has remained range-bound between $65,000 and $68,000 for the past few days despite briefly touching the $70,000 mark on Monday. 

According to QCP’s analysis, the inflow of funds into the spot Bitcoin Exchange-Traded Fund (ETF) market has not been substantial enough to drive significant price movements in either direction. 

As a result, the company has observed that funding rates have stabilized, and the front end of the forward curve has declined from previous highs of 50% to less than 20% currently.

Interestingly, while the front end of the forward curve has decreased, the back end remains elevated. This has led to interest in rolling spot-forward basis positions further out, potentially driven by the continued demand for long-dated Bitcoin calls extending into 2025.

Bitcoin

On the other hand, Ethereum’s performance has been relatively weak. QCP also notes that the ETHBTC ratio cross-tests a critical support level after breaking below 0.05. Notably, there has been sustained selling of Ethereum calls, resulting in lower volatility and downward pressure on the price.

Ultimately, QCP finds that these developments are prompting speculation as to whether this could be an early sign of FOMO turning into fear, particularly about Ethereum’s role as a proxy for altcoins.

While Bitcoin may find support from topside demand and ETF inflows, Ethereum’s performance and its impact on altcoins will be important factors to watch closely.

Will BTC Experience A Double-Top?

Renowned crypto analyst Crypto Con has raised an intriguing question about whether BTC is poised for a double top similar to the patterns observed in 2013 and 2021.

Analyzing previous market cycles, Crypto Con highlights that more evident double tops, such as those witnessed in the first and third cycles of 2021, triggered significant initial surges on the Fisher Transform indicator. 

In contrast, the 2017 double-top formation showed a more subtle initial rise in June. Notably, all final cycle tops ended with a regular bearish divergence, where the price reached higher levels while the indicator declined, as seen in the chart below.

Bitcoin

Currently, Bitcoin is approaching levels similar to those seen in 2017, as seen in the lower part of the chart. Crypto Con suggests that if the Fisher Transform indicator can consolidate around these levels without spiking to the line seen in 2013 and 2021, it could indicate a higher likelihood of a single top formation, which is the analyst’s most likely outcome, for December 2024, marking the top of this cycle.

Featured image from Shutterstock, chart from TradingView.com 

Grayscale Drops Bombshell Report: Crypto Bull Run Progresses To ‘Middle’ Phase, Future Outlook Detailed

The cryptocurrency market has witnessed a significant surge after a prolonged bear market and the intensified crypto winter caused by the collapse of crypto exchanges and firms during 2022 and part of 2023. 

Notably, Bitcoin and other major cryptocurrencies have experienced substantial price surges, accompanied by renewed interest from institutional investors entering the market through recently approved spot Bitcoin exchange-traded funds (ETFs). 

Adding to the industry’s positive outlook, asset manager and Bitcoin ETF issuer, Grayscale, believes that the current state of the market indicates that the industry is in the “middle” stages of a crypto bull run. 

Grayscale recently released a comprehensive report detailing their key findings and insights into what lies ahead. A closer analysis of the report by market expert Miles Deutscher sheds light on the factors contributing to this assessment.

On-Chain Metrics And Institutional Demand

Grayscale’s report starts by highlighting several key signals indicating that the market is currently in the middle of a bull run. These include Bitcoin’s price surpassing its all-time high before the Halving event, the total crypto market cap reaching its previous peak, and the growing attention from traditional finance (TradFi) towards meme coins.

To understand how long this rally might sustain, Grayscale emphasizes two specific price drivers: spot Bitcoin ETF inflows and strong on-chain fundamentals.

Grayscale notes that nearly $12 billion has flowed into Bitcoin ETFs in just three months, indicating significant “pent-up” retail demand. Moreover, ETF inflows have consistently exceeded BTC issuance, creating upward price pressure due to the demand-supply imbalance.

Grayscale’s research focuses on three critical on-chain metrics: stablecoin inflows, decentralized finance (DeFi) total value locked (TVL), and BTC outflows from exchanges.

According to Deutscher, the increase in stablecoin supply on centralized exchanges (CEXs) and decentralized exchanges (DEXs) by approximately 6% between February and March suggests enhanced liquidity, making more capital readily available for trading.

Crypto

Furthermore, for the analyst, the doubling of the total value locked into DeFi since 2023 represents growing user engagement, increased liquidity, and improved user experience within the DeFi ecosystem.

The outflows from exchanges, which currently account for about 12% of BTC’s circulating supply (the lowest in five years), indicate rising investor confidence in BTC’s value and a preference for holding rather than selling.

Based on these catalysts, Grayscale asserts that the market is in the “mid-phase” of the bull run, likening it to the “5th inning” in baseball. 

Promising Outlook For Crypto Industry

Several key metrics support Grayscale’s analysis, including the Net Unrealized Profit/Loss (NUPL) ratio, which indicates that investors who bought BTC at lower prices continue to hold despite rising prices

According to Deutscher, the Market Value Realized Value (MVRV) Z-Score, currently at 3, implies that there is still room for growth in this cycle. Additionally, the ColinTalksCrypto Bitcoin Bull Run Index (CBBI), which integrates multiple ratios, currently stands at 79/100, suggesting that the market is approaching historical cycle peaks with some upward momentum remaining. 

Furthermore, retail interest has yet to fully return this cycle, as evidenced by lower cryptocurrency YouTube subscription rates and reduced Google Trends interest for “crypto” compared to the previous cycle.

Crypto

Ultimately, Grayscale retains a “cautiously optimistic” stance regarding the future of this bull cycle, given the promising signals and analysis outlined in their report.

Crypto

Featured image from Shutterstock, chart from TradingView.com 

High-Stakes Week For Bitcoin And Ethereum As Central Bank Decisions Approach: Key Predictions

This week could mark a pivotal moment in the first quarter of 2024 for the entire crypto market and the two largest cryptocurrencies, Bitcoin (BTC) and Ethereum (ETH), as major central banks, led by the Bank of Japan and the US Federal Reserve (Fed), prepare to announce their interest rate decisions

According to crypto futures exchange Blofin, these announcements will set the tone for monetary policy in the coming months. The impact of safe-haven sentiment has led to a pullback in both BTC and ETH prices, with traders expressing greater optimism for BTC. 

Bitcoin Price Movement Range Projected At 9.78%

As per a recent on-chain analysis report released by the exchange, crypto traders are expecting BTC’s price movement range to reach 9.78% over the next seven days, with a projected 30-day range of 20.33%. 

However, despite the expected volatility, the report indicates that traders remain bullish on BTC in the medium to long term. 

Skewness analysis suggests that price declines and pullbacks are expected to induce volatility, but the duration of this round of pullback is expected to be relatively short. Risk aversion to macro uncertainty is seen as the primary trigger. 

The latest dealers’ gamma distribution supports the expected wide range of BTC price fluctuations, with gamma peaks around $65,000 and $75,000. With the quarterly settlement approaching, market makers’ influence on BTC price movement is gradually recovering, providing support during price drops but making it challenging to surpass the $75,000 level. 

Bitcoin

In addition, on-chain data shows a decline in spot investors’ enthusiasm for buying BTC, although the number of addresses holding more than 100 BTC continues to increase, as seen in the chart above. The reduced number of addresses holding over 1,000 BTC suggests that significant holders have decided to sell at BTC’s new highs. 

Despite caution over potential price fluctuations, the hedging effect contributes to the increasing possibility of BTC price stabilization, making holding BTC a favorable choice.

Bearish Sentiment Dominates Front-Month Options For Ethereum

According to the report, similar to BTC, traders expect relatively high volatility levels for ETH in the short term, with projected price movement ranges of 10% over seven days and 20.32% over 30 days. However, the report suggests that traders are less optimistic about ETH’s future performance compared to Bitcoin. 

Furthermore, Blofin finds that bearish sentiment dominates the front-month options, while bullish sentiment remains favorable in the back-months. Blofin emphasizes that expectations of rate cuts may support the ETH price, but the pricing of Ethereum tail risk indicates “increased pessimism” regarding significant events impacting the ETH price, with spot Ethereum ETFs seen as a potential trigger. 

Finally, Blofin explains that the high leverage of altcoins has long been a “source of risk” in the cryptocurrency market. The recent price decline has led to the liquidation of many highly leveraged altcoin positions, resulting in lower annualized funding rates for perpetual contracts. 

This deleveraging of altcoins, coupled with their relatively small market share of less than 20%, has helped to mitigate risk and contribute to market stability, according to the report. However, despite the overall decline in altcoin leverage, speculation in meme coins continues.

Bitcoin

At present, the price of Bitcoin stands at $62,500, reflecting a significant decline of 7.5% within the last 24 hours. Similarly, Ethereum is trading at $3,276, experiencing a 6.8% drop during the same period.

Featured image from Shutterstock, chart from TradingView.com

The Price Peak Puzzle: Unraveling The Timing Of Bitcoin Bull Market Peak

As Bitcoin (BTC) continues its remarkable ascent, reaching a new all-time high (ATH) of $72,300, investors wonder when the current bull market will peak. Considering historical data and the upcoming halving event scheduled for April 2024, crypto analyst Rekt Capital has provided insights into potential timing. 

Bitcoin Peak Expected Sooner Than Expected?

By examining previous halving cycles and the “acceleration” observed in the current cycle, Rekt Capital suggests that Bitcoin’s bull market may peak within 266-315 days from breaking its old all-time high, potentially occurring in December 2024 or February 2025.

Rekt Capital’s analysis reveals that Bitcoin has historically peaked in its bull market approximately 518-546 days after a halving event. However, the current cycle demonstrates accelerated growth, reducing approximately 260 days. 

According to the analyst, this acceleration has the potential to halve the typical cycle length, indicating that Bitcoin’s peak in the current bull market may occur much sooner than anticipated.

Bitcoin

Rekt Capital’s perspective, measuring the bull market peak from when an old all-time high is breached, provides valuable insights. In this cycle, Bitcoin recently broke to new all-time highs, indicating a potential milestone in the market. 

If the accelerated perspective holds, the next bull market peak is estimated to occur within 266-315 days from this breakout, landing somewhere between December 2024 and February 2025, according to the analysis provided by Rekt. 

Roughly every four years, Bitcoin’s halving events have historically played a crucial role in shaping market cycles. These events reduce the block reward miners receive, thereby reducing the rate of new Bitcoin supply, but this time may be different, according to Rekt, another analyst.  

From Four-Year Cycle To New Horizons

Similar to Rekt’s analysis, market expert Crypto Con suggests that the “conventional four-year cycle” may no longer hold, as Bitcoin is reaching new all-time highs sooner than expected, and as such, Crypto Con believes that the “boundaries of the traditional cycle” are being pushed, potentially signaling a paradigm shift in Bitcoin’s market dynamics. 

Historically, Bitcoin’s price cycles have adhered to a four-year pattern, characterized by market peaks around four years after each halving event. However, Crypto Con challenges this notion, arguing that the current cycle deviates from the “traditional timeline.” 

Bitcoin’s recent entry into “price discovery mode” and the achievement of new ATHs approximately a year earlier than expected suggest that the four-year cycle may no longer hold its predictive power.

Bitcoin

Crypto Con’s analysis indicates that the current market trajectory aligns more closely with the 2017 bull run than with previous cycles. Comparing the first tops of cycles 1 and 3 (2013 and 2021) to the present, both instances were on the verge of forming their initial peaks around April, mirroring the current market conditions. 

This observation supports the possibility of Bitcoin’s next bull market peak occurring in late 2024 rather than the previously anticipated late 2025.

Featured image from Shutterstock, chart from TradingView.com 

Bitcoin ETF Frenzy: BlackRock Smashes Expectations With $788 Million Inflows In One Day

BlackRock’s Bitcoin ETF, IBIT, achieved a remarkable milestone on March 5. Attracting a staggering $788 million, it exceeded its previous record of $612 million in inflows in a single day. This surge in investment coincided with Bitcoin reaching a new all-time high (ATH) of $69,300, surpassing its previous ATH set in 2021.

Bitcoin ETF Trading Volumes Reaches Record $10 Billion

Shortly after Bitcoin hit its new milestone, the market experienced a notable price correction, dropping below $60,000. However, this dip seemed to entice ETF buyers who saw it as an opportunity to accumulate Bitcoin at a discounted price. 

As a result, the Bitcoin price has quickly recovered and reached the $65,200 level, positioning itself for further price gains and consolidation above its ATH.

Bitcoin ETF

According to Bloomberg ETF expert Eric Balchunas, the ten Bitcoin ETFs traded a staggering $10 billion in volume on the same day, breaking the previous record set just a week ago. 

The expert noted that this surge in trading activity is not entirely unexpected, as volatility and volume often go hand in hand with ETFs. Balchunas also highlighted that several ETFs, including Blackrock’s IBIT, Fidelity (FBTC), Bitwise (BITB), and Arkham (ARKB), achieved record-breaking trading volumes.

Interestingly, while the Bitcoin ETFs experienced a surge in inflows, the Grayscale Bitcoin Trust (GBTC) continued its trend of outflows since the ETFs launched on January 11. 

Balchunas noted that GBTC has seen nearly $10 billion in outflows, yet its total assets under management remain unchanged since its launch. This phenomenon can be attributed to the bull market subsidy, wherein investors continue to hold assets despite outflows, generating revenue for the trust.

A Temporary Halt Before Further Gains?

Bitcoin’s recent price action has encountered resistance at its ATH level of $69,000, signaling a temporary rejection from this crucial point. This coincides with the activation of the Golden Ratio Multiplier, the first and only cycle top indicator to have fired thus far.

The Golden Ratio Multiplier, an indicator often used in technical analysis, has seen its cycle top band (level 5) rise to $69,099, aligning perfectly with Bitcoin’s recent peak. However, considering this is the sole indicator predicting a cycle top, some analysts, including Crypto Con, believe that a significant market correction may not have occurred yet.

Bitcoin ETF

According to Crypto Con, this current phase represents a temporary resting place for Bitcoin’s early parabolic ascent. Crypto Con suggests that once Bitcoin breaks through the ATH, it will begin a new phase characterized by heightened market activity and potential price gains. 

Bitcoin ETF

Featured image from Shutterstock, chart from TradingView.com

Deribit Exchange Expects Bitcoin To Rise 20% In The Next 30 Days, Targeting $80,000

In a significant milestone for the cryptocurrency market, Bitcoin (BTC), the largest digital asset, shattered its previous records, surging past the $69,000 mark to establish a new all-time high (ATH) of $69,300 on Tuesday. 

The achievement marked a historic moment for BTC, which hadn’t reached such levels in over two years. However, the crypto’s upward trajectory shows no signs of slowing down, with experts predicting further price gains.

Bitcoin Price And ETFs In Perfect Harmony

According to data from Deribit, an options and futures crypto exchange and analytics firm GenesisVol, BTC is anticipated to experience a potential increase of up to 20.8% within the next 30 days. 

These projections suggest that, under ideal circumstances, Bitcoin’s price could break through the $80,000 barrier. Even conservative traders are optimistic, expecting BTC to easily surpass $70,000 and reach around $75,000.

In addition, the recent approval of spot Bitcoin exchange-traded funds (ETFs) has played a pivotal role in Bitcoin’s success, suggesting that the upward trend in BTC prices, coupled with bullish sentiment among options traders and institutional and retail investors, is far from over.

Bloomberg ETF expert Eric Balchunas emphasized the significance of this development, stating that it represents a crucial moment for both Bitcoin and ETFs. Balchunas believes the surge from $25,000 to $69,000 was largely driven by hopes of ETF approval and subsequent flows. 

Bitcoin

The expert claimed that the synergy between ETFs and Bitcoin has proven mutually beneficial, as ETFs have enhanced liquidity, affordability, convenience, and standardization for investors. 

Notably, the ten-spot Bitcoin ETFs have amassed over $50 billion in assets, with a staggering $8 billion generated from flows and the rest attributed to the rising value of Bitcoin.

However, as Bitcoin reached its new peak, increased market volatility led to a liquidation surge. Journalist Colin Wu reported a sharp 5% drop in Bitcoin’s price within an hour, with Binance recording below $65,000. During this hour, liquidations amounted to a staggering $142 million. 

BTC Sell Signal

Although bullish investors are currently on cloud nine, renowned crypto analyst Ali Martinez has sounded the alarm as the TD Sequential indicator recently flashed a sell signal on the daily chart of Bitcoin.

The TD Sequential indicator, developed by market expert Tom DeMark, utilizes price patterns and sequences to identify potential trend reversals in various financial markets, including cryptocurrencies. 

Martinez emphasized the indicator’s notable track record in predicting Bitcoin’s price movements since the beginning of the year. The TD Sequential indicator issued a buy signal in early January, just before Bitcoin’s price surged 34%. 

Conversely, a sell signal was given in mid-February, followed by a 4.44% drop in the value of BTC. So, considering the previous sell signals, a potential drop towards the $62,000 price level could be in the making for the largest cryptocurrency on the market, still holding the $60,000 support, which will be key for BTC’s prospects.

Bitcoin

Featured image from Shutterstock, chart from TradingView.com

Bitcoin Proves European Central Bank Wrong: Hits All-Time High Against Euro

Bitcoin (BTC), the leading cryptocurrency, continues its remarkable bullish run, surpassing the $65,000 mark on Monday and inching closer to its all-time high of $69,000. Simultaneously, BTC has achieved a significant milestone against the Euro as economic concerns escalate across Europe. 

BTC Achieves Record Highs Against 14 G20 Currencies

Despite previous skepticism from European authorities, Bitcoin has soared to an all-time high of $60,200 against the official currency of the European Union (EU). This achievement is noteworthy, considering the Euro’s recent depreciation against Bitcoin, as depicted in the chart below.

Bitcoin

On February 22, the European Central Bank (ECB) expressed doubts about Bitcoin’s potential as a global decentralized digital currency, citing its “limited use” for legitimate transactions.

The ECB argued that Bitcoin had failed to live up to its initial promise of becoming a widely accepted payment or a reliable investment. It also highlighted the alleged “inconvenience, slowness, and high costs” of Bitcoin transactions.

The ECB further raised concerns about the “history of price manipulation” and fraudulent activities associated with Bitcoin. It attributed these issues to the absence of a “fair value” for the cryptocurrency. However, despite the ECB’s reservations, Bitcoin has experienced a surge in institutional and retail investments. 

The recent approval and success of Bitcoin spot exchange-traded funds (ETFs) have played a pivotal role, attracting inflows of over $7.3 billion to the BTC market within just two months, prompting renewed bullish sentiment in the industry.

Bitcoin’s success extends beyond its achievement against the Euro. The cryptocurrency has reportedly reached all-time highs against the currencies of fourteen G20 countries, including the Japanese Yen, British Pound, Australian Dollar, Canadian Dollar, Chinese Yuan, New Zealand Dollar, Swedish Krona, and South Korean Won. 

Bitcoin Set For Potential Surge To $200k 

Reports of an impending surge in Bitcoin’s value have sparked excitement among investors, as market expert Gert Van Lagen predicts another substantial price increase. 

With BlackRock’s renewed interest in purchasing Bitcoin and a reported scarcity of the cryptocurrency on over-the-counter (OTC) desks, conditions seem favorable for a straight pump to $100,000. Van Lagen emphasizes that with limited resistance to upward movement, the potential for exponential growth appears limitless.

The analyst suggests that continued buying by spot ETFs at a rate of $900 million per day, coupled with a shallow market depth of approximately $20-40 million, can drive significant price surges. 

Van Lagen’s analysis also suggests that based on historical cycles, once the 1.618 Fibonacci extension of the 2018 bear market is breached, Bitcoin peaks within 2-3 months at the 2.272 extension. Currently, the 2.272 extension projects a potential peak of $207,000.

Looking back at previous cycles, notable patterns emerge. 2013 Bitcoin topped within six weeks at the 2.272 extension of the 2011 bear market after breaking the 1.618 extension. 

Similarly 2017, Bitcoin peaked within three months at the 2.272 extension of the 2015 bear market, following a breakthrough of the 1.618 extension. 

Bitcoin has surpassed the 1.618 extension of the 2018 bear market in the current market. Van Lagen anticipates that Bitcoin will likely peak at the 2.272 extension of the 2018 bear market, estimated at around $200,000. 

Bitcoin

Currently, the largest cryptocurrency on the market is trading at $65,300, up over 5% in the last 24 hours and over 27% in the last seven days.

Featured image from Shutterstock, chart from TradingView.com

Bitcoin ETF Breaks Records: BlackRock’s IBIT Joins Elite ‘$10 Billion Club’ Amidst Soaring Demand

The demand for spot Bitcoin exchange-traded funds (ETFs) has surged since their recent approval on January 10, with BlackRock’s IBIT Bitcoin ETF leading the way. This ETF has reached impressive milestones in less than two months, attracting significant investor interest and opening doors for various market participants to invest in the largest cryptocurrency directly. 

As institutional and retail investors flock to these new investment vehicles, market experts predict a bullish trend and anticipate a potential price surge.

Bitcoin ETF Frenzy

According to Bloomberg ETF expert Eric Balchunas, BlackRock’s IBIT Bitcoin ETF has quickly joined the esteemed “$10 billion club,” reaching the milestone faster than any other ETF, including Grayscale’s Bitcoin Trust (GBTC), noting that only 152 ETFs out of 3,400 have crossed the threshold.

Balchunas notes that IBIT’s ascent to this club was primarily driven by significant inflows, which accounted for 78% of its assets under management (AUM). This reflects the growing appetite for Bitcoin exposure among investors seeking diversified and regulated investment options.

In particular, the current trajectory of the ETF market paints a picture of resilience and bullish sentiment in the market. Equity ETF flows, and leveraged trading levels are positive indicators, although they have not yet reached the euphoria seen in 2021, Balchunas notes. 

However, Bloomberg’s new BI ETF Greed/Fear Indicator, which incorporates various inputs, highlights the optimistic outlook shared by ETF investors, as seen in the chart below.

Bitcoin ETF

On this matter, crypto analyst “On-Chain College” went to social media X (formerly Twitter) to emphasize the significant demand for Bitcoin as evidenced by its rapid departure from exchanges. 

In its analysis, On-Chain College highlights that Bitcoin ETFs buy approximately ten times the daily amount of BTC mined. At the same time, the upcoming halving event will further reduce the mining supply. The analyst predicts when demand will exceed available supply, leading to potential upward price pressure.

Highest Monthly Close Since 2021

Bitcoin’s recent market performance has caught the attention of wealth manager Caleb Franzen, who highlights the significance of the highest monthly close since October 2021. 

Franzen further emphasizes the bullish momentum by pointing out that the 36-month Williams%R Oscillator has closed above the overbought level for only the fourth time in history. Historical data reveals impressive returns following such signals, indicating the potential for substantial gains in the coming months. 

Bitcoin ETF

Additionally, Franzen notes the changing dynamics of the market, with increased institutional participation and the ease of retail onboarding through ETFs.

Franzen presents a compelling case for the bullish nature of overbought signals, urging market participants to view them as momentum indicators rather than signals to fade. Previous instances of overbought signals have resulted in significant Bitcoin price appreciation:

  • February 2013: +3,900% in 9 months
  • December 2016: +1,900% in 12 months
  • November 2020: +260% in 12 months

While acknowledging diminishing returns in each cycle, Franzen highlights the unprecedented level of institutional participation and the ease of retail access through ETFs. 

Even if Bitcoin were to match the +260% gain from the November 2020 signal, it would reach a price of $180,000, surpassing Franzen’s minimum cycle target of $175,000. 

Ultimately, Franzen notes that bull markets are typically characterized by a rising ETHBTC ratio and a falling BTC.D (Bitcoin dominance). While these characteristics have yet to manifest fully, Franzen suggests that a multi-quarter rally in the broader cryptocurrency market may be on the horizon.

Bitcoin ETF

Featured image from Shutterstock, chart from TradingView.com 

Bitcoin Maximalist Forecasts ‘God Candle’ Formation Propelling BTC To $100,000

Bitcoin (BTC) has witnessed a remarkable ascent, surpassing the $57,000 mark and recording a year-to-date surge of over 142%. The cryptocurrency’s market capitalization has also surged towards $1.14 billion, reaching levels not seen since December 2021. With the previous all-time high (ATH) of $69,000 within sight, the bullish sentiment surrounding Bitcoin is becoming increasingly evident.

Setting Eyes On $100,000 And $200,000.

Prominent Bitcoin maximalist Max Keiser, known for his optimism even during the harshest bear markets, has suggested the possibility of a “God Candle” scenario given the current market conditions.

To provide further context, this term describes a vast and powerful candlestick pattern on a price chart that indicates a significant and sudden price movement. According to Keiser, if such a pattern were to emerge, it could propel Bitcoin toward the $100,000 price level, shattering its previous record. 

Traders and analysts interpret a “God Candle” as a highly bullish signal, reflecting robust buying pressure and the potential for a trend reversal or continuation. It often signifies a notable shift in market sentiment and catalyzes further price appreciation.

Adding to the optimistic outlook for Bitcoin, crypto analyst Gert van Lagen has projected a target of $200,000 for BTC. Analyzing the 1-week chart, van Lagen notes that Bitcoin’s price has been following a “parabolic trajectory” since November 2022 and is on track to reach $200,000 soon. 

According to the analyst, this parabolic pattern aligns with the previous fifth sub-waves that have historically similarly intersected the blue trendline, as seen in the chart below. 

Bitcoin

Notably, van Lagen points out that a breach of the 78.6% Fibonacci retracement level, which Bitcoin has already crossed, tends to trigger an immediate parabolic spike.

Finally, the analyst highlights the rising risk-on sentiment in the stock market and the strong correlation between Bitcoin and the S&P 500 since late 2021 as additional support for this bullish forecast.

Bull Market Cycle For Bitcoin Until 2025?

Renowned market expert Peter Brandt revised his Bitcoin price target in a recent post on social media X (formerly Twitter), raising it from $120,000 to $200,000. 

Brandt attributes this adjustment to Bitcoin’s recent breakthrough above the upper boundary of a 15-month channel, indicating a potential bull market cycle until August or September 2025. However, the analyst says a close below last week’s low of $50,600 would invalidate this interpretation. 

As Brandt points out, the $50,600 price level represents a 1-week resistance level for the largest cryptocurrency on the market, which, in the event of a price correction, as has historically happened whenever a sudden price spike occurs in BTC’s price action, Bitcoin would likely retest the $49,900 support level on its weekly chart. A drop towards $47,000 could be imminent in a more extreme scenario.

Bitcoin

However, with Bitcoin currently trading at $56,800, up 4.2% in the last 24 hours, its bullish uptrend seems far from over, potentially leading to a parabolic continuation of its price, as van Lagen and other analysts suggested.

Featured image from Shutterstock, chart from TradingView.com

Bitcoin All-Time High Ahead: Historical Pattern Signals 50% Chance Of Reaching $100K By August

Bitcoin (BTC), the world’s largest cryptocurrency, has surged to a 26-month high, reaching $52,000 and reigniting predictions of surpassing its previous all-time high (ATH) of $69,000. 

The market has experienced a resurgence of bullish sentiments, fueled further by the recent adoption of Bitcoin spot exchange-traded funds (ETFs). These have spurred notable growth within just one month of approval by the US Securities and Exchange Commission (SEC).

Bitcoin Poised For A Major Breakout? 

Investment manager and market expert Timothy Peterson, who recently made a bold claim on social media platform X (formerly Twitter), reinforces Bitcoin’s renewed optimism. 

Peterson stated that Bitcoin had achieved an almost exact 100% gain in 180 days, a feat that has occurred 41 times since 2015. In 78% of these instances, Bitcoin reached even higher price levels. 

Furthermore, Peterson’s analysis of historical data suggests that the average return for the next 180 days after such a gain was also approximately 100%.Based on this historical pattern, Peterson asserts that there is a 50% chance Bitcoin will reach the significant milestone of $100,000 by August. 

However, despite this possibility, as the halving event approaches, there could be another correction that, while not putting the bull run in jeopardy, could trigger significant liquidation rates as the hype surrounding the current uptrend mounts.

Pre-Halving Correction Looms

The upcoming halving event scheduled for April, combined with historical patterns, suggests that Bitcoin may experience one final correction before the bull run resumes, presenting a crucial moment for investors.

Crypto analyst Rekt Capital emphasizes the significance of a pre-halving retrace, noting that historically, it tends to occur only a few weeks before the actual halving event. 

Looking back at previous halvings, such retracements have ranged from -38% in 2016 to -20% in 2020. Based on these patterns, a retracement of around 27% is possible in the current market scenario.

Bitcoin

If a retracement of this magnitude were to occur, it would place the Bitcoin price at approximately $37,900, as indicated in Rekt Capital’s pre-halving retrace chart. This level represents an important threshold for investors to accumulate the cryptocurrency before the next phase of the halving event and the anticipated bull run rally.

Key Resistance For BTC’s Trajectory

Bitcoin’s continued rise has brought its price to a critical juncture, with the current trading level of $52,100 catching the attention of the founders of blockchain data and intelligence platform Glassnode.

According to their analysis, historical data reveals that the $52,000 level has acted as a formidable resistance point on the weekly chart, making it a crucial threshold for Bitcoin’s trajectory. 

The platform’s founders suggest that a successful breach of this level could trigger a surge of buying pressure, potentially leading to a Fear of Missing Out (FOMO) scenario among investors.

Bitcoin

Overall, the future direction of BTC price remains uncertain, leaving investors to ponder whether the current uptrend will be sustained or if a potential pre-halving retrace will occur before resuming its upward trajectory to surpass its previous all-time high and reach the coveted $100,000 level.

Featured image from Shutterstock, chart from TradingView.com 

Bitcoin Price Alert: X Account’s Analysis Suggests Sub-$10K Drop – Here’s The Reasoning

Amid a significant Bitcoin price rally, reaching a new two-year high of $52,000, a renowned social media account known as WhaleWire has made a startling prediction.

The account, widely followed for its bold statements and news postings, has forecasted a staggering 99.99% chance of Bitcoin falling below $10,000, directly challenging the prevailing bullish sentiment.

 Clash Over Potential Bitcoin Price Crash

In a recent post on X (formerly Twitter), WhaleWire has voiced concerns about sustainability and alleged manipulation through fraud and price manipulation. The account accuses mainstream media and self-proclaimed Bitcoin enthusiasts, often referred to as “moon boy scammers,” of perpetuating an upward price narrative to allegedly serve their interests.

However, not everyone is convinced by WhaleWire’s claims. In response to the account’s recent prediction, a user on social media accused WhaleWire of being a liar, citing a previous forecast from August 2022 when the account asserted that Bitcoin would undoubtedly drop below $20,000. 

Ironically, Bitcoin did experience a decline below that threshold a few weeks later, lending some credibility to WhaleWire’s track record.

WhaleWire continues to express skepticism and calls out the so-called “Bitcoin maximalists” who exhibit excessive greed and euphoria. The account suggests that recent price movements, including Bitcoin briefly touching $50,000 amid concerns over Tether’s money printing, are deliberate maneuvers to trap bullish investors. 

WhaleWire claims that retail investors are now heavily invested in Bitcoin, anticipating further gains, only to be blindsided by a subsequent price rug-pull.

Doubling down on its conviction, WhaleWire has announced that it has increased its short positions, surpassing its $69,000 short. He believes that the ongoing rally will mark the top of what he refers to as the “echo bubble run”, which he originally predicted when Bitcoin was valued at $16,000.

Bullish Optimism Builds 

As the Bitcoin price continues its uptrend, a crypto analyst operating under the pseudonym “Mags” has taken to social media to share an optimistic outlook for Bitcoin. 

As per Mags’ analysis, Bitcoin is currently trading above the critical 0.618 Fibonacci retracement level on a weekly chart, a feat never achieved in previous cycles before the halving event.

Traditionally, the 0.618 level has proven to be a formidable resistance zone, acting as a significant hurdle on Bitcoin’s path to reaching its all-time high (ATH). Mags believes that if Bitcoin successfully closes above the 0.618 level, which is currently valued at $48,500, it could signify an unprecedented bullish breakthrough.

Adding further weight to the bullish sentiment is the analysis provided by Ali Martinez. Martinez highlights a noteworthy trend: the amount of Bitcoin held in known cryptocurrency exchange wallets has plummeted to its lowest level in six years, with a total of only 2.34 million BTC remaining.

Bitcoin price

This substantial decrease in Bitcoin holdings on exchanges suggests a growing inclination among investors to move their BTC into secure, long-term storage solutions. 

According to Martinez, this shift away from exchanges implies a potential shift towards a more “hodling-centric” approach, where investors aim to hold their Bitcoin for extended periods rather than actively trading it.

Amidst the divergence of opinions and conflicting perspectives from both bullish and bearish investors, the ultimate outcome remains uncertain. The Bitcoin price action, as the largest cryptocurrency in the market, continues its notable uptrend, challenging the bearish predictions put forth by WhaleWire and others.

As the debate rages on, time will reveal whether WhaleWire’s forecast proves accurate or if the current bullish momentum will persist, further solidifying Bitcoin’s position as a dominant force in the cryptocurrency market.

Bitcoin price

Currently, BTC is trading at $51,600, up 5.4% in the last 24 hours and over 18% in the last seven days.

Featured image from Shutterstock, chart from TradingView.com

Inflationary Concerns Rise As US CPI Exceeds Predictions, Bitcoin Price Reacts

The latest US inflation data significantly impacted the Bitcoin price and most of the cryptocurrency market, with some exceptions. According to a report from the Labor Department, inflation rose more than expected in January, driven by higher shelter prices.

Furthermore, the consumer price index (CPI), which measures the prices consumers face for goods and services across the economy, saw a 0.3% increase for the month. On a 12-month basis, the CPI stood at 3.1%, slightly lower than December’s 3.4%.

Bitcoin Price Retreats Amid Higher-Than-Expected CPI Figures

According to recent reports, the higher-than-expected CPI figures could pose challenges for the Federal Reserve (Fed), as officials anticipate inflation to recede and reach their 2% annual target. The central bank aims to adjust monetary policy, which has been tight over two decades. 

However, the January increase in inflation may delay the Fed’s plans to ease rates, as it will require more data before initiating a rate-cutting cycle. This outcome disappointed those who expected inflation to decrease and prompted a reassessment of the timing for potential rate adjustments.

On this matter, market intelligence platform Santiment reported that the 3.1% CPI result caused market cap losses in cryptocurrency and equities markets. The Bitcoin price, which had breached the $50,000 mark for the first time in over two years, has fallen below $49,000 in response. 

According to the crypto platform’s analysis, this mild retrace will likely polarize crowd sentiment, potentially leading to significant panic sales. In such a scenario, the justification for dip buying becomes more viable, but sentiment may turn negative. 

Bitcoin’s Market Cycle Patterns

Market expert Crypto Con has identified a striking pattern in Bitcoin’s market cycles, specifically concerning the 20 Week Exponential Moving Average (EMA). Despite mounting concerns regarding inflation data, the analysis suggests that the Bitcoin price behavior tends to follow a consistent six-step pattern, with significant implications for support and potential correction levels.

According to Crypto Con’s analysis, Bitcoin’s price movement in each market cycle has adhered to a similar pattern involving the 20-week EMA. The pattern unfolds as follows: 

First, as seen in the chart below, the Bitcoin price breaks above the moving average, marking the beginning of a new cycle and a notable uptrend. However, after the completion of the initial run, the price retraces and falls below the moving average, signaling a temporary shift in sentiment.

Despite the temporary setback, Bitcoin’s price then breaks above the moving average once more, indicating the start of a true rally and resumption of the upward trend. At this stage, price action creates a false retest of support, narrowly missing the moving average as a crucial support level. This false retest is a common occurrence in Bitcoin’s market cycles.

Bitcoin price

Following the false retest, Bitcoin embarks on a second run, representing a further advancement in the market cycle. Bitcoin’s price is currently positioned during this phase. 

According to the analysis made by Crypto Con, the full correction in Bitcoin’s price may not need to be as deep, as the moving average currently sits at approximately $40,000. 

Ultimately, the analysis’s suggestion that the Bitcoin price may not dip below the $40,000 level during the ongoing bull run, even in the face of anticipated corrections, is particularly encouraging for bullish investors. 

Bitcoin price

Bitcoin is trading at 48,600, down 3% in the last 24 hours.

Featured image from Shutterstock, chart from TradingView.com

Bitcoin Price Soars, Smashing Through $45,000 On The Back Of Two Key Factors

In the past 14 days, the Bitcoin price has displayed a significant uptrend of 14.5%, signaling a resurgence in bullish sentiment. This rally comes as Bitcoin spot exchange-traded funds (ETFs) have been trading for nearly a month, with the market already factoring in this development. As a result, Bitcoin is back on its natural course, gaining momentum ahead of the scheduled halving in April.

Currently, Bitcoin has not only regained its bullish momentum after a brief dip to the $38,500 level but has also surpassed the $45,300 mark. It now edges closer to its 25-month high of $49,000, with the $50,000 milestone within reach. 

Achieving this level would significantly narrow the gap between the current price and Bitcoin’s all-time high (ATH) of $69,000. However, what are the main catalysts behind this uptrend, and how far can the Bitcoin price climb?

Reduction Of GBTC Flows And Net Positive BTC Spot ETF Inflows

According to the latest analysis by QCP Capital, two key factors are driving Bitcoin’s upward trajectory: 

Daily outflows from the Grayscale Bitcoin Trust (GBTC) have decreased from $500-600 million to $100-200 million. Simultaneously, total inflows across all Bitcoin ETFs are now positive. This shift in the GBTC flows, and the emergence of net positive BTC spot ETF inflows contribute to the current bullish trend, according to the crypto trading firm’s analysis

Additionally, notable price movements have been observed around “spot ETF fixings.” Between 3-4 pm EST, QCP has recorded that the Bitcoin price tends to tick higher, possibly due to the one-hour observation window used by the BlackRock ETF (IBIT) to calculate its Net Asset Value (NAV). 

Conversely, downward pressure is typically observed after 4 pm EST as GBTC employs a point fix, leading market makers to sell around and after the fix.

Strong Performance In US Equities

Despite the Federal Reserve’s hawkish stance and higher US yields driven by robust February Non-Farm Payroll data (353k actual vs. 180k expected), US equities continue outperforming. 

Companies like NVDA and META have rallied due to strong earnings and positive headlines. Underallocated investors will likely continue buying any equities dips as they chase returns. 

According to the analysis, this bullish sentiment is expected to “spill” over into BTC and Ethereum (ETH), further fueled by the upcoming BTC halving and the ETH spot ETF narratives.

Ultimately, the trading firm assesses significant interest in accumulators, which enable investors to purchase Bitcoin or ETH at a “substantial discount” to the current spot price. This strategy is believed to present an attractive opportunity for bullish investors looking to build long positions throughout the year.

Bitcoin Price Faces Strong Barriers On Its Way To $50,000

Despite the uptrend, notable resistance levels could impede further upward movement and potentially lead to a consolidation phase for Bitcoin. 

To assess the nearest-term resistances accurately, the 1-hour chart indicates potential price paths for Bitcoin in the coming days if these bearish thresholds are breached.

In the immediate time frame, the $45,500 level emerges as Bitcoin’s next resistance level. This level previously marked a correction in the Bitcoin price shortly after the introduction of ETF trading.

Bitcoin price

Subsequently, the next target would be the $46,600 level if the immediate resistance at $45,500 is surpassed. However, while these two thresholds may present challenges, no significant resistance levels are evident on Bitcoin’s hourly chart until the $48,500 level. 

This particular level represents the final hurdle for Bitcoin before reclaiming its previous high reached on January 11, immediately following the approval of ETFs by the US Securities and Exchange Commission (SEC).

Considering the combined factors of Grayscale’s reduced sell-off and the overall performance of the equity market, alongside renewed investor sentiment, Bitcoin could potentially surge to previous highs and even surpass them, marking new highs since the end of the crypto winter. 

The key factor to be seen is how Bitcoin’s price will respond when encountering these highlighted resistance walls and whether the buying pressure will be sufficient to propel Bitcoin back on track toward the bullish momentum observed at the beginning of 2024.

Featured image from Shutterstock, chart from TradingView.com

What’s Ahead For Bitcoin? Expert Forecasts Pre-Halving Rally As Early As Next Week

Bitcoin (BTC), the largest cryptocurrency in the market, has seen its price hover between $42,000 and $43,000, halting its recovery from the dip below $38,500. 

With the upcoming halving event scheduled for April, market experts and crypto analysts such as Rekt Capital are observing historical patterns that suggest an interesting price action scenario, potentially igniting another significant price surge for Bitcoin.

Pre-Halving Rally For Bitcoin Imminent? 

Rekt Capital, known for its expertise in analyzing market trends, highlights the significance of historical patterns about previous halving events. These patterns reveal a consistent trend of substantial rallies leading up to the halving, followed by a short period of correction and consolidation before a major bull run and peak.

According to Rekt Capital, Bitcoin should commence its Pre-Halving Rally as early as next week if history indicates. 

This rally, driven by investors “buying the hype” in anticipation of the halving, aims to capitalize on the price surge and realize profits by “selling the news.” Short-term traders and speculators often exploit this hype-driven rally and sell their positions.

Bitcoin

The subsequent selling pressure contributes to a phenomenon known as the pre-halving retrace. This retrace typically occurs a couple of weeks before the actual halving event. 

In previous halving cycles, the pre-halving retrace reached depths of -38% in 2016 and -20% in 2020. It is worth noting that this phase can last for several weeks, introducing uncertainty among investors regarding whether the halving will act as a bullish catalyst for Bitcoin’s price.

Overall, the historical patterns observed by Rekt Capital point to the possibility of a pre-halving rally in the coming weeks, followed by a correction period known as the pre-halving retrace. 

While past performance is no guarantee of future results, these historical trends provide valuable guidance on how the price of Bitcoin may perform in the coming weeks and days before the halving.

Long-Term Holder Support And ETF Buying Pressure

Despite expected short-term gains for BTC, Crypto Con has recently drawn attention to a historical trend in the Bitcoin market. According to Crypto Con, no Bitcoin cycle has ever escaped a retest of the 150% long-term holder support line

According to the analyst, this line has acted as a crucial level of support during various market cycles. Even during the unprecedented black swan event and subsequent recovery in 2020, the price retested this line as support.

By analyzing this metric, Crypto Con suggests that based on historical patterns, Bitcoin’s price may need approximately $31,300 to retest the long-term holder support line. 

Bitcoin

The anticipated impact of ETF buying pressure on Bitcoin’s price is counterbalancing the argument for further corrections. Introducing ETFs (Exchange-Traded Funds) into the cryptocurrency market is a relatively new development. As such, the effects of ETF inflows on Bitcoin’s price remain to be seen and are a subject of ongoing observation.

While the potential retest of the long-term holder support line may create temporary price fluctuations, proponents of Bitcoin as an investment opportunity view such a scenario as a buying opportunity

Ultimately, Crypto Con believes that those who believe in the long-term prospects of Bitcoin may choose to take advantage of any price dips resulting from a retest of support.

Bitcoin

BTC trades at $42,800, up a slight 0.4% in the past 24 hours as of this writing. 

Featured image from Shutterstock, chart from TradingView.com 

Expert Analysis: Bitcoin ‘Bottom Is Not In’, Potential $30K Retest On The Horizon

Bitcoin (BTC), the largest cryptocurrency by market capitalization, closed January above the $40,000 threshold, signaling positive price action. However, market expert Justin Bennett suggests that Bitcoin’s bottom has yet to be reached. 

Bennett’s analysis highlights the possibility of further price declines, with Tether’s stablecoin USDT dominance (USDT.D) chart indicating potential downward movements. 

Tether Dominance Signals Concerns For BTC’s Price

Bitcoin’s recent price recovery and ability to surpass the $40,000 level have provided optimism among investors. Nevertheless, Bennett believes further price declines could follow a retest of the mid $44,000 range. 

Bennett highlights the inverse relationship between Tether dominance and Bitcoin. According to his analysis, the levels on the Tether dominance chart since October have been reliable indicators for Bitcoin’s price movements. 

Bitcoin

According to Bennett’s analysis, as depicted in the chart above, Tether’s dominance may experience a potential increase from its current level of 6%. This increase could bring it closer to the 8% mark. 

In such a scenario, Bitcoin’s performance would likely move in the opposite direction, indicating potential price declines soon.

On January 25, Bennett suggested that Bitcoin could drop another 20% from its current levels, which would place it around $30,000. If this scenario plays out, it would be crucial for Bitcoin bulls to defend the $30,000 level to maintain the current bullish structure.

A drop below $29,000 would give bears a stronger position, with only three major support lines remaining at $28,400, $25,900, and $24,000 before a potential retest of the $20,000 mark. 

The performance of these support levels and Bitcoin’s ability to withstand increased selling pressure will be key factors to monitor. The future market sentiment will also play a significant role in determining Bitcoin’s price trajectory.

Bitcoin Witnesses Stellar Accumulation Trend

Despite the possibility of further price drops, renowned crypto analyst Ali Martinez has shed light on a notable trend in BTC’s recent accumulation streak by investors.

According to Ali Martinez’s analysis, Bitcoin is experiencing a significant accumulation streak, rivaling some of the most notable periods observed over the past few years. 

The Accumulation Trend Score, a metric that gauges the buying activity of larger entities, has remained consistently high, hovering near 1 for the past four months.

Bitcoin

This suggests that influential market participants are actively accumulating Bitcoin, signaling their confidence in the long-term potential of the cryptocurrency. 

Martinez’s observations further indicate that Bitcoin’s price range around $42,560 has emerged as a highly significant interest zone. 

Within this range, an impressive total of 912,626 BTC has been transacted. This is expected to be a significant support level, potentially preventing further downside movements and fostering increased buying interest.

These trends collectively contribute to a positive market outlook, suggesting that despite potential price drops, Bitcoin remains an attractive asset for long-term investment.

Bitcoin

Featured image from Shutterstock, chart from TradingView.com 

Bitcoin ETFs Experience Day 12 Reversal, GBTC Selling Slows, Fidelity And Blackrock Garner $400 Million

Bitcoin has witnessed a positive turn of events as it reclaimed the $43,000 mark on Tuesday, thanks to a significant reduction in selling pressure from asset manager Grayscale. The reversal in Bitcoin ETFs during day 12 of trading has seen more inflows than outflows. Fidelity and Blackrock recorded a combined $400 million across their Bitcoin ETFs under the ticker names FBTC and IBIT, respectively. 

Bitcoin ETFs Record Third-Largest Money Day

According to market expert James Mullarney, Grayscale Bitcoin Trust (GBTC) has experienced a noticeable reduction in selling pressure, as reflected by the slowing down of GBTC selling. 

Day 12 of trading showed a substantial inflow compared to outflow, marking the third-largest money day ever in net money flow, bringing in $256 million. 

Bitcoin ETFs

Mullarney further states that adding new Bitcoin ETFs has contributed to a net positive of $1 billion in ETFs, with an estimated 25,000 Bitcoin added to the market. The new Bitcoin ETFs now hold a total of 150,000 BTC in aggregate.

Miners Sell Most Coins Since May 2023

Despite these positive developments with Bitcoin ETFs, there is an ongoing increase in selling pressure from miners. A recent CryptoQuant report reveals that miners have sold the most coins since May 2023. 

The flow of coins from miner wallets to spot exchanges reached its highest value since May 16, 2023, with over 4,000 Bitcoin amounting to approximately $173 million in selling pressure.

Bitcoin ETFs

Although miners have increased their selling activity, CryptoQuant asserts that the market has absorbed this pressure “calmly”. It is important to note that the reserves in mining portfolios have remained at the same level since the beginning of January. 

CryptoQuant highlights that it is crucial to consider that these actions do not necessarily indicate a “dump” by miners. The firm concluded:

It is true that there were several interactions with exchanges during this period, some quite significant, but this does not correspond to a “dump” on the part of these entities. Furthermore, it is necessary to be careful when reading messages like “miners are dumping coins”, this analyzes may not take into account the return of these coins to miners’ wallets. 

New All-Time High For Bitcoin After November?

Renowned crypto analyst, CryptoCon, cautions against the belief that “this time is different” for Bitcoin, highlighting the recurring nature of its market cycles. With three completed cycles and a fourth underway, CryptoCon emphasizes that historical patterns, including the launch of Bitcoin ETFs, have consistently influenced Bitcoin’s price trajectory.

CryptoCon emphasizes that Bitcoin’s price movements have followed distinct cycles, and he warns against the notion that each cycle will deviate significantly from the preceding ones. 

Despite the anticipation surrounding the launch of ETFs, historical evidence suggests that they have coincided with local price highs rather than instant new all-time highs. 

CryptoCon argues that the repeated occurrence of such patterns should serve as a reminder that “this time is different” often proves to be an illusory belief.

According to CryptoCon’s analysis, a period of sideways movement is expected to commence soon after the completion of the ongoing correction, which saw BTC retrace to the $38,500 level on Tuesday, January 23. 

This phase is predicted to last approximately four months, culminating in a second early price peak in June 2024, according to Crypto Con. 

Following this, the analyst foresees the possibility of new all-time highs occurring after November 28th, 2024. However, it is crucial to note that the cycle’s peak will occur within approximately 21 days from this date, around November 28th, 2025.

Bitcoin ETFs

Featured image from Shutterstock, chart from TradingView.com

Bitcoin Crash Ahead: Expert Predicts Testing $20K Before Rebound

Bitcoin, the largest cryptocurrency in the market, experienced a price recovery on Friday; however, industry experts anticipate a further test of sub-$30,000 levels in the near term. 

The prolonged downtrend observed over the past fourteen days, coupled with mounting selling pressure, has raised concerns about the sustainability of the recent rebound.

BTC’s Local Bottom Predicted

Chris Burniske, co-founder of a New York-based venture crypto firm, highlights several factors contributing to the anticipated downward movement of Bitcoin. 

Burniske suggests that the consolidation phase may extend longer than expected due to many variables, including crypto-market dynamics, macroeconomic conditions, adoption trends, and new product developments. 

Burniske offers his outlook on Bitcoin, stating that a local bottom could be reached in the $30,000 to $36,000 range. However, he wouldn’t be surprised if the cryptocurrency tests the mid-to-high $20,000 before recovery occurs, leading to a renewed push toward previous all-time highs. 

Burniske cautions that the path to such a recovery will likely be volatile, marked by potential fakeouts, and may span several months.

The market expert advises investors to exercise patience during this period of uncertainty. Burniske suggests that other cryptocurrencies may experience more significant percentage declines if his predictions hold Bitcoin. Burniske further stated:

Before you get mad with, “We’re just getting this cycle started, Chris!!!” Mostly agree, ~called the cycle bottom in Nov 2022 and continue to believe the long-term trend remains robust. Have also seen a lot of crypto volatility over the last decade+…. recently, I’ve specifically been discussing a local top and local low, not a cycle-wide top and low. 

Buy Signal For Bitcoin

Crypto analyst Ali Martinez has provided insights into potential price movements for Bitcoin in its latest analysis conducted on the social media platform X (formerly Twitter). 

Martinez’s assessment indicates that the TD Sequential indicator recently flashed a buy signal on the daily chart, coinciding with Bitcoin’s current position above the 100-day Simple Moving Average (SMA) at approximately the $40,000 level. 

Bitcoin

According to Martinez, if Bitcoin surpasses the $40,550 resistance level, it may trigger an upswing with a target price of $43,000. This bullish scenario implies a potential price rally for Bitcoin soon. 

However, the analyst also highlights the importance of closely monitoring the 100SMA support level, as a breach of this level could have significant implications for the cryptocurrency’s price trajectory.

Martinez cautions that if the 100SMA support level is breached, it might result in Bitcoin experiencing a downward move toward the $33,300 level. This potential downside scenario indicates a critical support level that, if broken, could lead to increased selling pressure and a bearish sentiment in the market.

Bitcoin

At the time of writing, BTC’s price has recovered 3.8% over the past 24 hours, resulting in a current trading price of $41,400.

Featured image from Shutterstock, chart from TradingView.com