Ethereum Finishes 2022 With ATH Correlation To Bitcoin, Despite The Merge

Data shows Ethereum’s year of high correlation with Bitcoin is coming to an end with the metric hitting ATH values.

Ethereum Ends 2022 With All-Time High Correlation To Bitcoin

According to the year-end report from Arcane Research, the global markets have all fallen strongly correlated this year. The “30-day correlations” is an indicator that measures how in-tune Bitcoin has been with another asset in terms of price movement over a 30-day period.

When the value of this metric is greater than zero, it means there has been a positive correlation between BTC and the other asset in the past month. On the other hand, negative values imply that the price of the crypto has been reacting to changes in the value of the other asset by moving in the opposite direction.

Also, the higher the metric value (in either direction), the more the degree of the correlation. Naturally, the metric has a value equal to zero suggesting the two prices aren’t tied to each other at the moment.

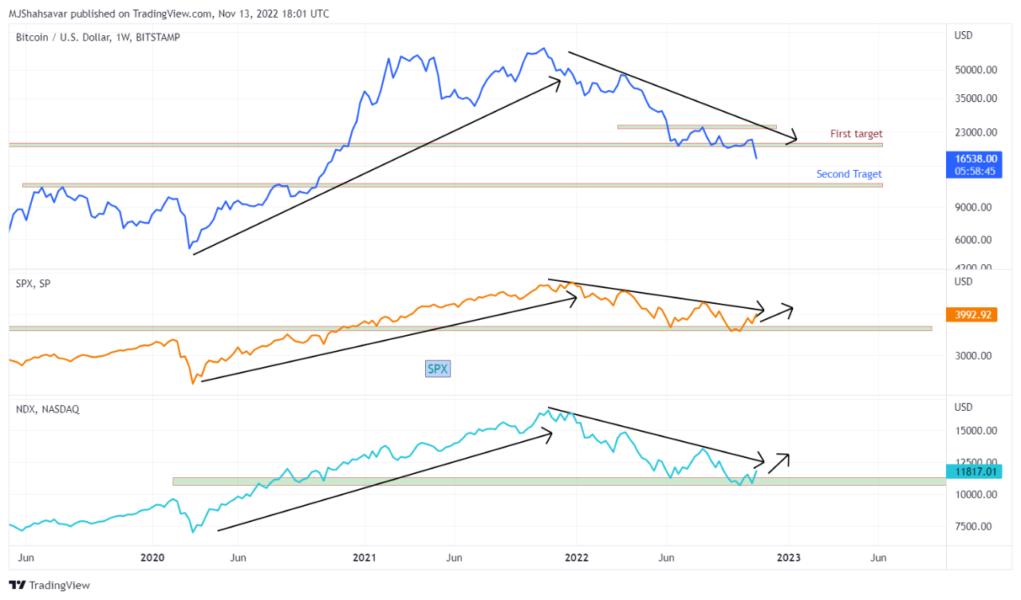
Now, here is a chart that shows the trend in Bitcoin’s 30-day correlations with Ethereum, S&P 500, and Nasdaq over the past year:

Bitcoin And Ethereum Correlation

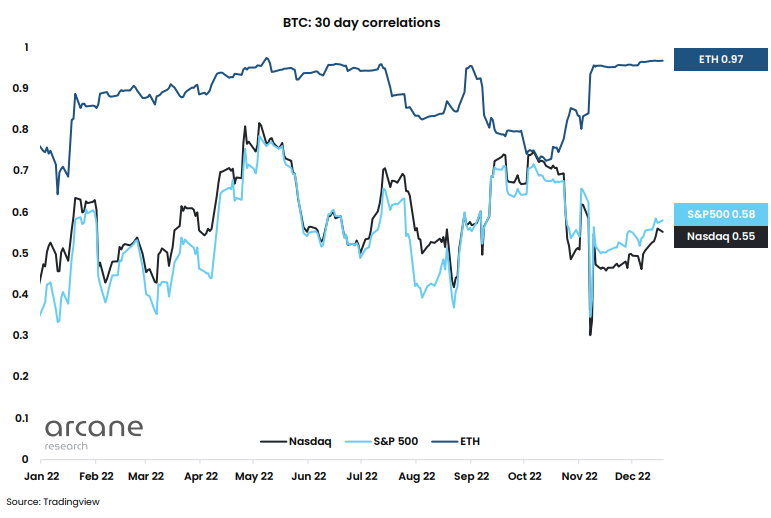
As the above graph displays, Bitcoin positively correlated with these three assets during 2022. BTC’s correlation has been around or above 0.5 for most of the year for the US equities, suggesting it has been decently tied with them.

The correlation with Ethereum, however, has been at values of around 0.9 or more, implying Bitcoin has been extremely correlated with it. Even now, as the year’s end, the correlation between these cryptos stands at 0.97, around ATH levels.

Back in September of this year, ETH successfully finished its much-anticipated transition to a Proof-of-Stake consensus system, an event known as the Merge. Since the Merge brought some developments unique to Ethereum, the correlation with BTC dropped, as is apparent in the chart.

However, it wasn’t long before the two started moving on the same wavelength again, so even the Merge wasn’t enough to cause sufficient impact to separate the coins.

Also, since Bitcoin is highly correlated with stocks, so is Ethereum. Though, Arcane Research expects that this correlation between the cryptos and the US equities will soften in the next year due to trading volumes in the crypto market declining substantially.

ETH Price

At the time of writing, Ethereum’s price floats around $1,200, down 2% in the last week.

Ethereum Price Chart

Quant Explains How This Nasdaq Support Retest Could Also Help Reverse Bitcoin

A quant has explained why the recent retest of a critical support level by Nasdaq may help Bitcoin reverse its own trend.

Nasdaq-100 Has Recently Retested A Critical Support Trendline

As pointed out by an analyst in a CryptoQuant post, Nasdaq-100 is currently above a support line that has historically been important.

Nasdaq-100 (NDX) is a stock market index that includes 102 equity securities issued by 101 of the largest non-financial companies (based on their market caps) listed on the Nasdaq stock exchange.

Here is a chart that shows how this trendline has acted as a bounce in the index’s price over the past decade:

NASDAQ Support Line Bitcoin

As you can see in the above graph, the price of NDX has been supported five times by this trendline since the year 2010. In each of these instances, the line has put a check on the decline in the index, and has consequently reversed it back up.

Recently, the Nasdaq-100 index has once again made a touch of this trendline, and has so far managed to stay above it.

The quant notes that this retest could have been the end of the latest downwards trend, and might have also been the point of return of a bullish trend.

However, if the trendline is lost instead, it would show the extreme strength of the downtrend, and would suggest that there is more drawdown ahead for the market.

At the same time, Bitcoin has also been testing a support line, as the analyst has highlighted in the chart:

Bitcoin Support

In the past year or so, Bitcoin has shown to be highly correlated with the stock market. The reason behind this correlation has been the rise of institutional investors in the crypto who treat it like a risk asset.

The quant believes that if the current support retest in the stock market proves to be successful, then BTC could also be expected to see a reversal of its own due to its correlation with the stocks.

Bitcoin Price

At the time of writing, Bitcoin’s price floats around $17.2k, up 1% in the last week. Over the past month, the crypto has lost 7% in value.

Below is a chart that shows the trend in the price of the coin over the last five days.

Bitcoin Price Chart

Bitcoin Moves Differently From US Stock Market, Correlation Weakening?

Data shows while Bitcoin has been correlated with the US stock market for some time now, the two haven’t moved in tandem recently.

Bitcoin Correlation With US Stocks May Be Weakening As BTC Has Been Moving Differently

As pointed out by an analyst in a CryptoQuant post, BTC has gone down in the past week while stocks have made some gains.

A “correlation” between two assets (or markets) exists when both their prices follow the same general trend over a period of time.

For Bitcoin, there has been a strong correlation with the US stock market during the last couple of years or so. The reason behind the markets becoming so tied is the rise of institutional investors in the crypto.

Such investors view BTC as a risk asset and pull out of the coin as soon as there is macro uncertainty looming over the market (hence driving the crypto’s price down along with the stocks).

Here is a chart that shows the prices of Bitcoin, S&P 500, and NASDAQ over the last few years:

Bitcoin Stock Market Correlation

Looks like the assets have followed similar trends in recent times | Source: CryptoQuant

As you can see in the above graph, Bitcoin wasn’t correlated with the stock market in 2019 and early 2020, but it all changed when COVID struck.

After the black swan crash that occurred in March 2020, the price of BTC started following S&P 500 and NASDAQ.

Though, while BTC showed a same general long-term trend, the crypto continued to be much more highly volatile than the stocks.

The correlation has continued through the bear market, but the last week or so has turned out different.

While the US stock market has seen some uplift in the past 7 days, Bitcoin has instead taken a sharp plummet.

These markets showing different behavior recently could suggest the correlation between them may be reducing.

With the latest plunge, BTC has also lost the support line of the previous all-time high, something that has never happened in the previous cycles.

The quant in the post notes that this recent trend is a sign of weakness in the crypto market, which could lead to further downtrend in the near future.

BTC Price

At the time of writing, Bitcoin’s price floats around $16.5k, down 20% in the last week. Over the past month, the crypto has lost 15% in value.

The below chart shows the trend in the price of the coin over the last five days.

Bitcoin Price Chart

The value of the crypto seems to have remained below $17k in recent days | Source: BTCUSD on TradingView
Featured image from André François McKenzie on Unsplash.com, charts from TradingView.com, CryptoQuant.com

False Safe Haven: Bitcoin Correlation With S&P 500 Hits ATH

Data shows the Bitcoin correlation with S&P 500, and hence the stock market, has now set a new all-time high (ATH).

Bitcoin Correlation With S&P 500 Reaches New High

As pointed out by an analyst in a CryptoQuant post, the BTC correlation with the stock market is currently at an all-time high, further damaging the “safe haven” narrative.

The “Bitcoin correlation with S&P 500” is an indicator that measures how strongly the price of BTC reacts to volatility in S&P 500, as well as the direction of the response.

When the indicator has values greater than zero, it means there is a positive correlation between the stock market and the price of the crypto at the moment. “Positive” here means that BTC moves in the same direction as S&P 500.

On the other hand, correlation values less than zero imply that BTC reacts to S&P 500’s price changes by moving in the opposite direction.

Related Reading | Bitcoin Plunges Below $40 As Russia Has Reportedly Given Its Forces Order To Attack Ukraine

Values of the indicator exactly equal to zero naturally mean that there is no correlation between the two assets. Now, here is a chart that shows the trend in the S&P 500 and Bitcoin correlation since the year 2013:

The indicator’s value over the history of the crypto | Source: CryptoQuant

As you can see in the above graph, the correlation between Bitcoin and S&P 500 swung between positive and negative while remaining low for the most part of BTC’s history.

Related Reading | Why Bitcoin Won’t Crack Over Fresh Bear Assault, Next Potential Target For BTC

However, since late 2019-early 2020, the two assets have become strongly, positively correlated. During 2020, the metric had a crash due to the COVID sell off, but the indicator sharply rose during the 2nd half of 2021 and 2022 so far.

The correlation between the Bitcoin and the stock market has now set a new all-time high (ATH) of +0.5468 this month.

Such high correlation between the assets has further put a dent on the narrative of “digital gold” as the crypto is no longer the safe haven it once was.

BTC Price

At the time of writing, Bitcoin’s price floats around $39k, down 12% in the last seven days. Over the past month, the crypto has gained 10% in value.

The below chart shows the trend in the price of BTC over the last five days.

BTC’s price seems to made some recovery over the last couple of days | Source: BTCUSD on TradingView

A few days back, the price of Bitcoin plunged down, touching as low as $36.4k. Since then, the value of the coin has shown some recovery, breaking above the $39k level again today. At the moment, it’s unclear whether this fresh uptrend will last.

Featured image from Unsplash.com, charts from TradingView.com, CryptoQuant.com