On-chain data shows Bitcoin currently has a thick supply wall between the $60,300 and $62,155 levels that may prevent the asset from falling lower.
A Large Amount Of Bitcoin Was Bought Near Current Prices
As explained by analyst Ali in a new post on X, BTC has a major support wall just below it right now. In on-chain analysis, the strength of support and resistance levels is gauged through the amount of Bitcoin that the investors bought at them.
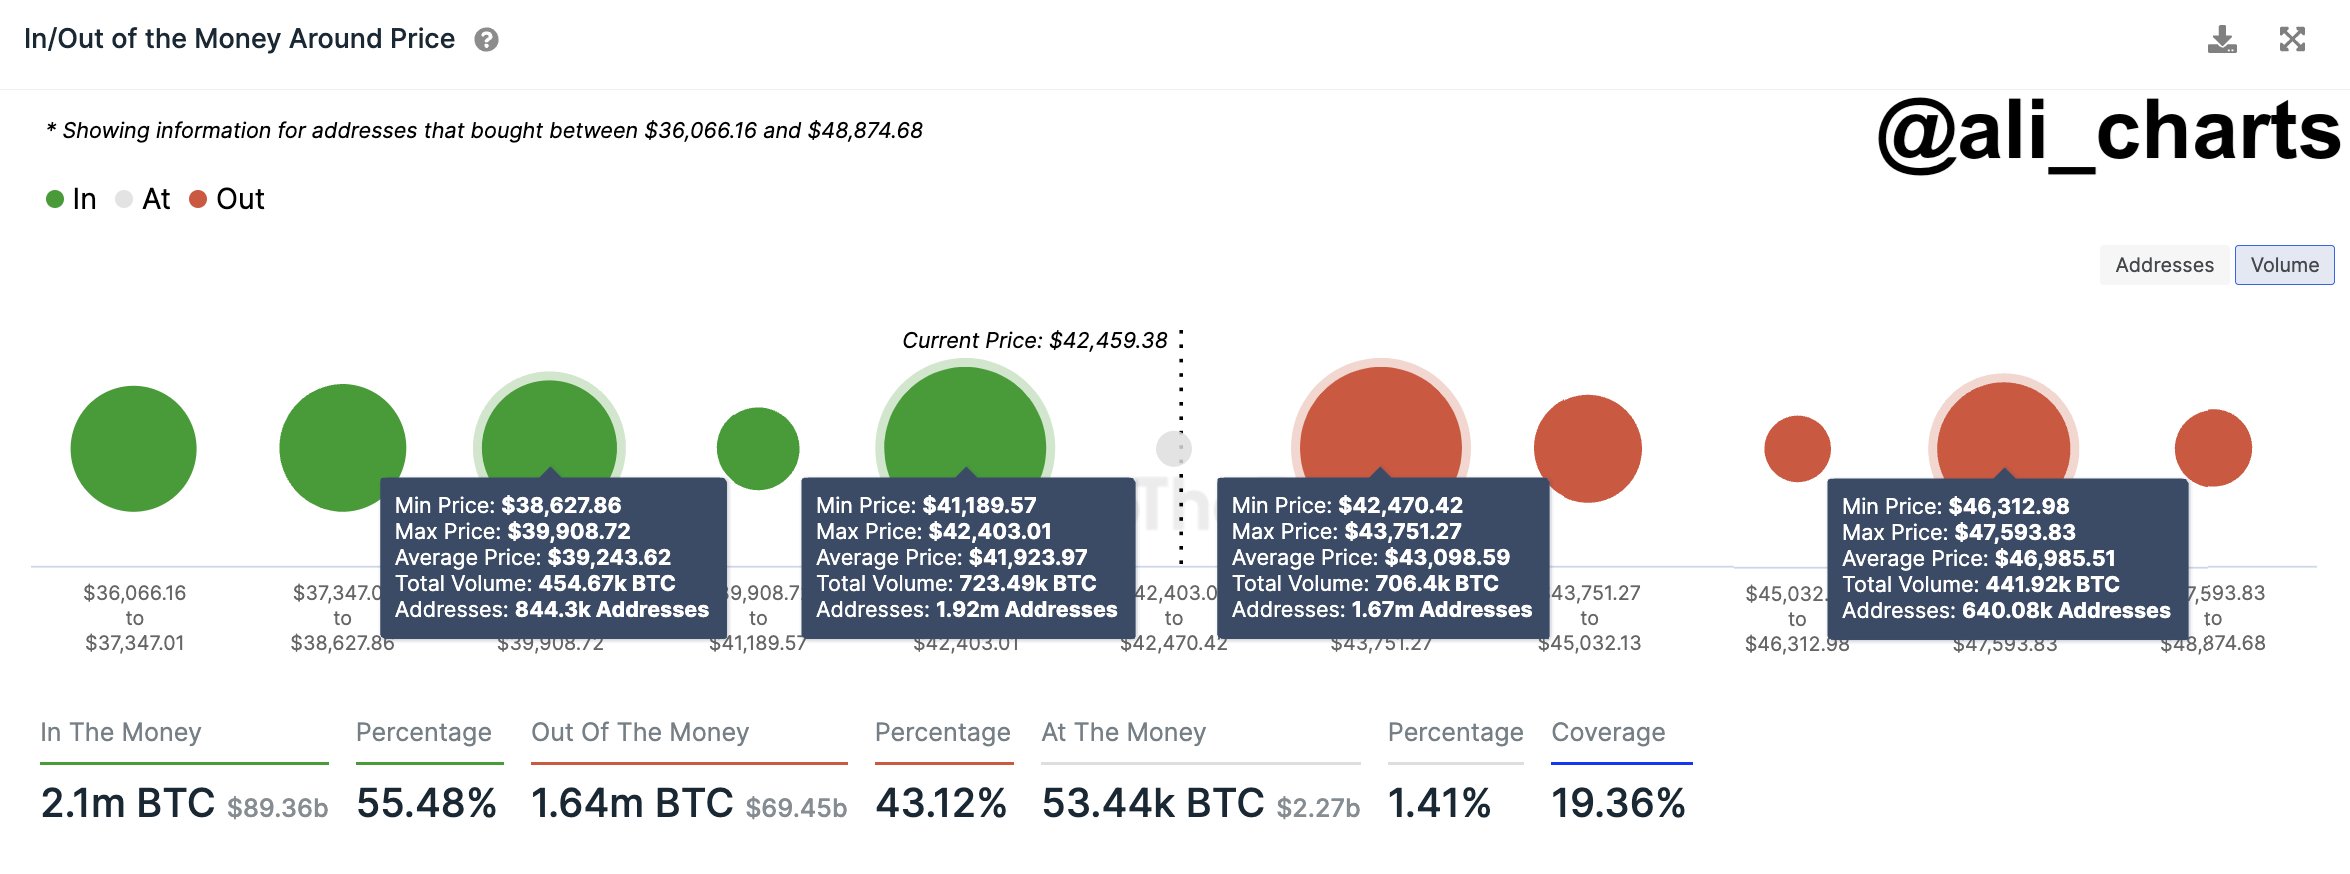
The chart below shows how the distribution of the investor cost basis has looked like for BTC across the price ranges near the current spot value:
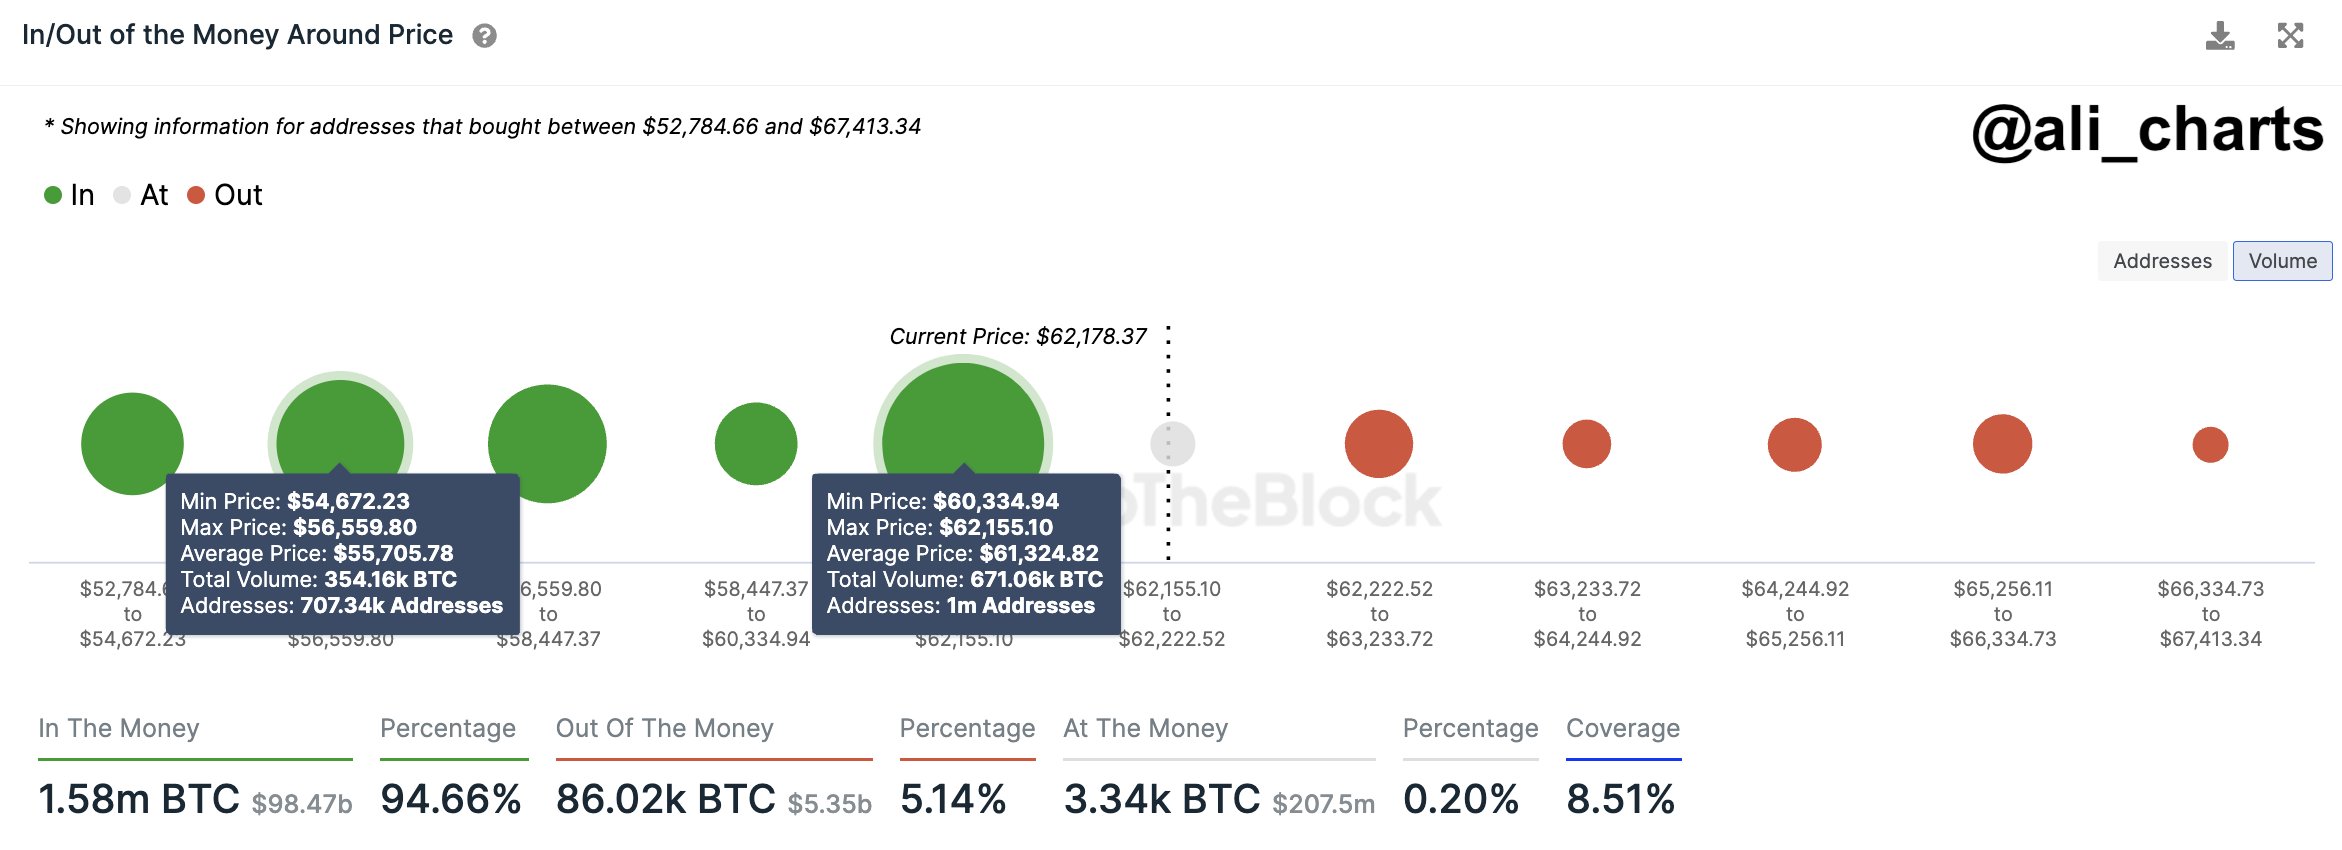
Here, the size of the dot represents the number of tokens that the addresses bought between the corresponding price levels. From the graph, it’s apparent that the $60,300 to $62,100 range has a particularly high density of coins right now.
Most of the price levels in this range lie just below the current spot price of the cryptocurrency, meaning that the investors who bought here would be making some profit, albeit only a slight one.
Generally, when the price retests the cost basis of such investors who were in profit prior to the retest (meaning that the price has approached their cost basis from above), a buying reaction may be produced by these addresses.
This is because holders like these may have reason to believe that if they were able to get into profits before, they might be able to do so again in the near future, so they may just accumulate on this “dip.”
Such a reaction can naturally provide support to the cryptocurrency. The scale of this support, however, is naturally not anything significant if only a few investors bought at the level to begin with. Narrow ranges that are thick with addresses, on the other hand, might just prove to be a source of noticeable support.
In the aforementioned price range near the current spot price, one million addresses acquired a total of about 671,000 BTC. “This accumulation zone highlights strong investor confidence and could serve as a crucial level of support for BTC, potentially cushioning against further drops,” notes the analyst.
While the price ranges under the current price are heavy with coins, it’s visible in the chart that this isn’t the case for the ranges above. Just like how supply wallets below can be a source of support, they can instead act as resistance when above.
The fact that the supply walls above are quite thin suggests that there wouldn’t be too many investors waiting to quickly exit at their break-even, and thus, selling pressure due to them should be low.
That said, it doesn’t mean there isn’t any impedance at all. Bitcoin is approaching all-time highs at this point, meaning that the vast majority of the supply is in profit. At these levels, mass selling for harvesting these gains can be the main challenge preventing the run from continuing.
BTC Price
At present, Bitcoin is trading around the $62,000 level, meaning that it’s right on the edge of the major support wall.