Bitcoin Has Next Major Demand Zone At $56,000: Brace For Impact?

On-chain data shows the next major Bitcoin demand zone is around $56,000, a level BTC might end up revisiting if the decline continues.

Bitcoin Has Next Major On-Chain Support Around $56,000

According to data from the market intelligence platform IntoTheBlock, BTC’s recent drawdown has meant that it may end up having to rely on the price range around $56,000 for support.

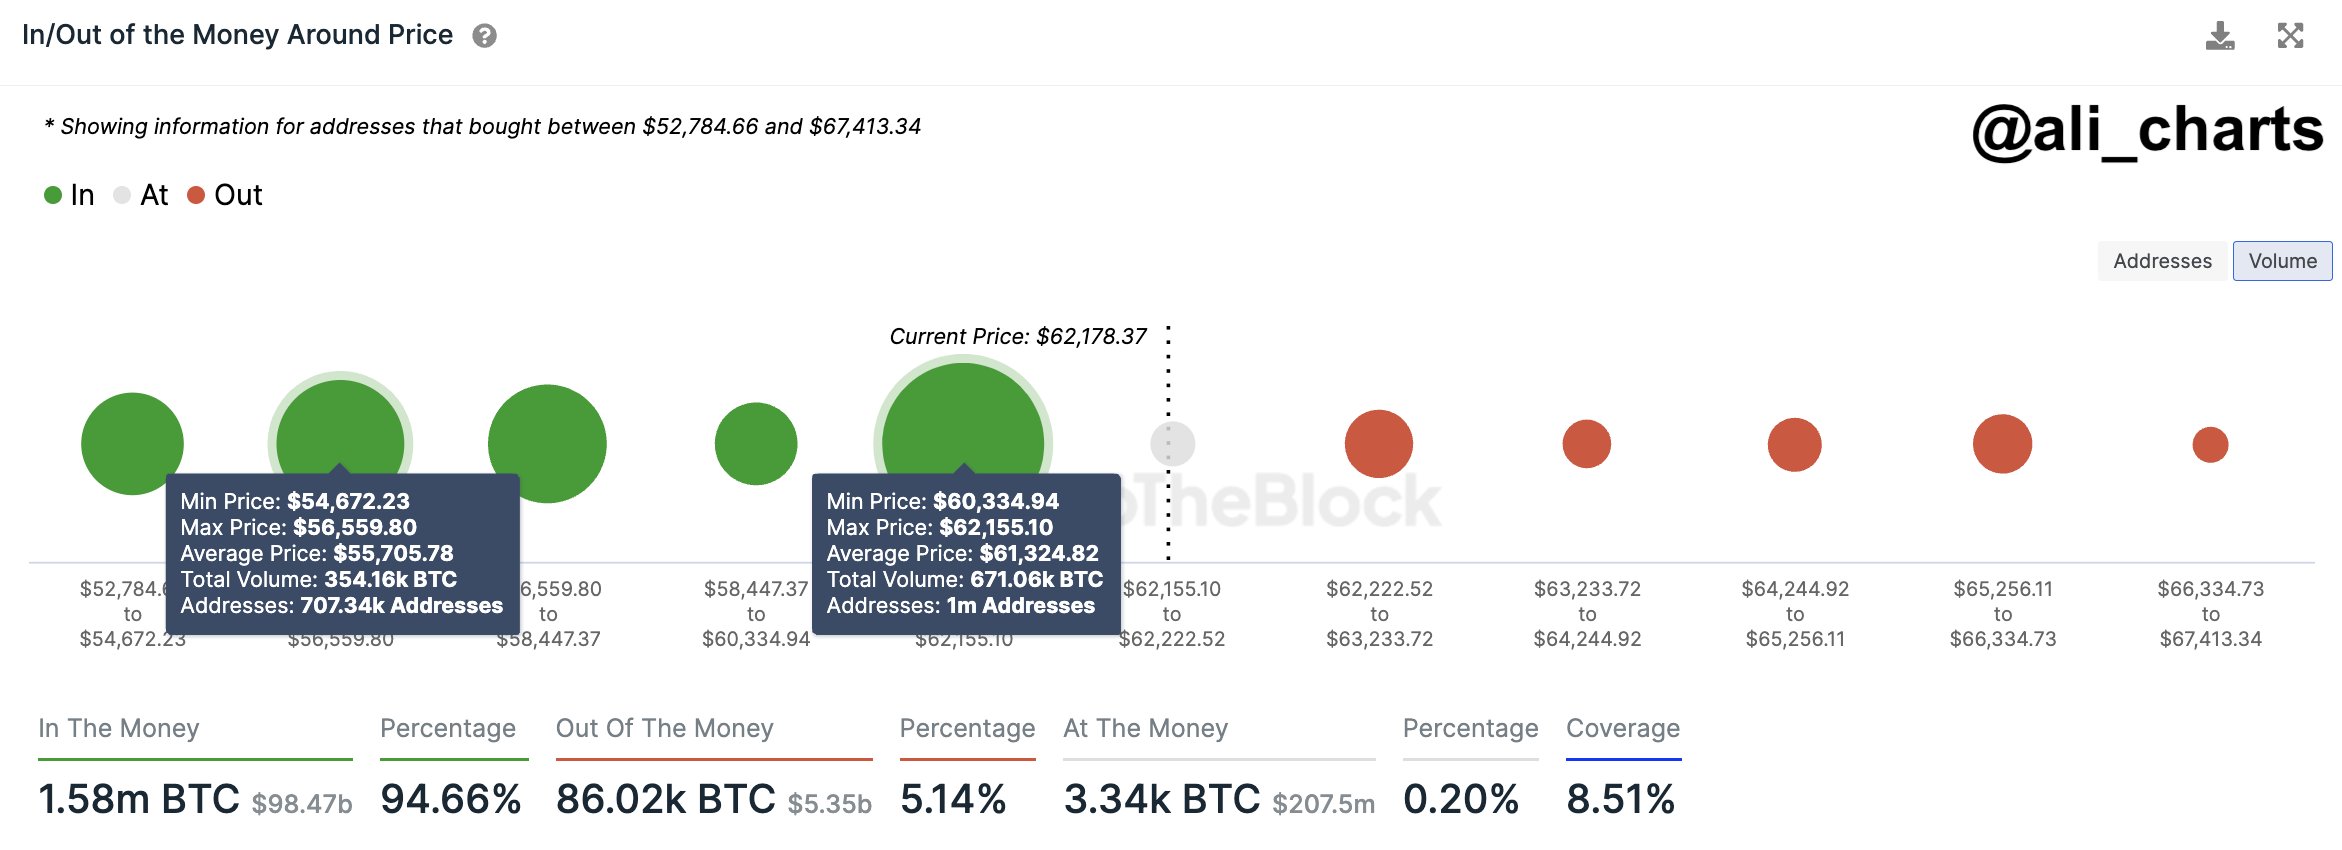
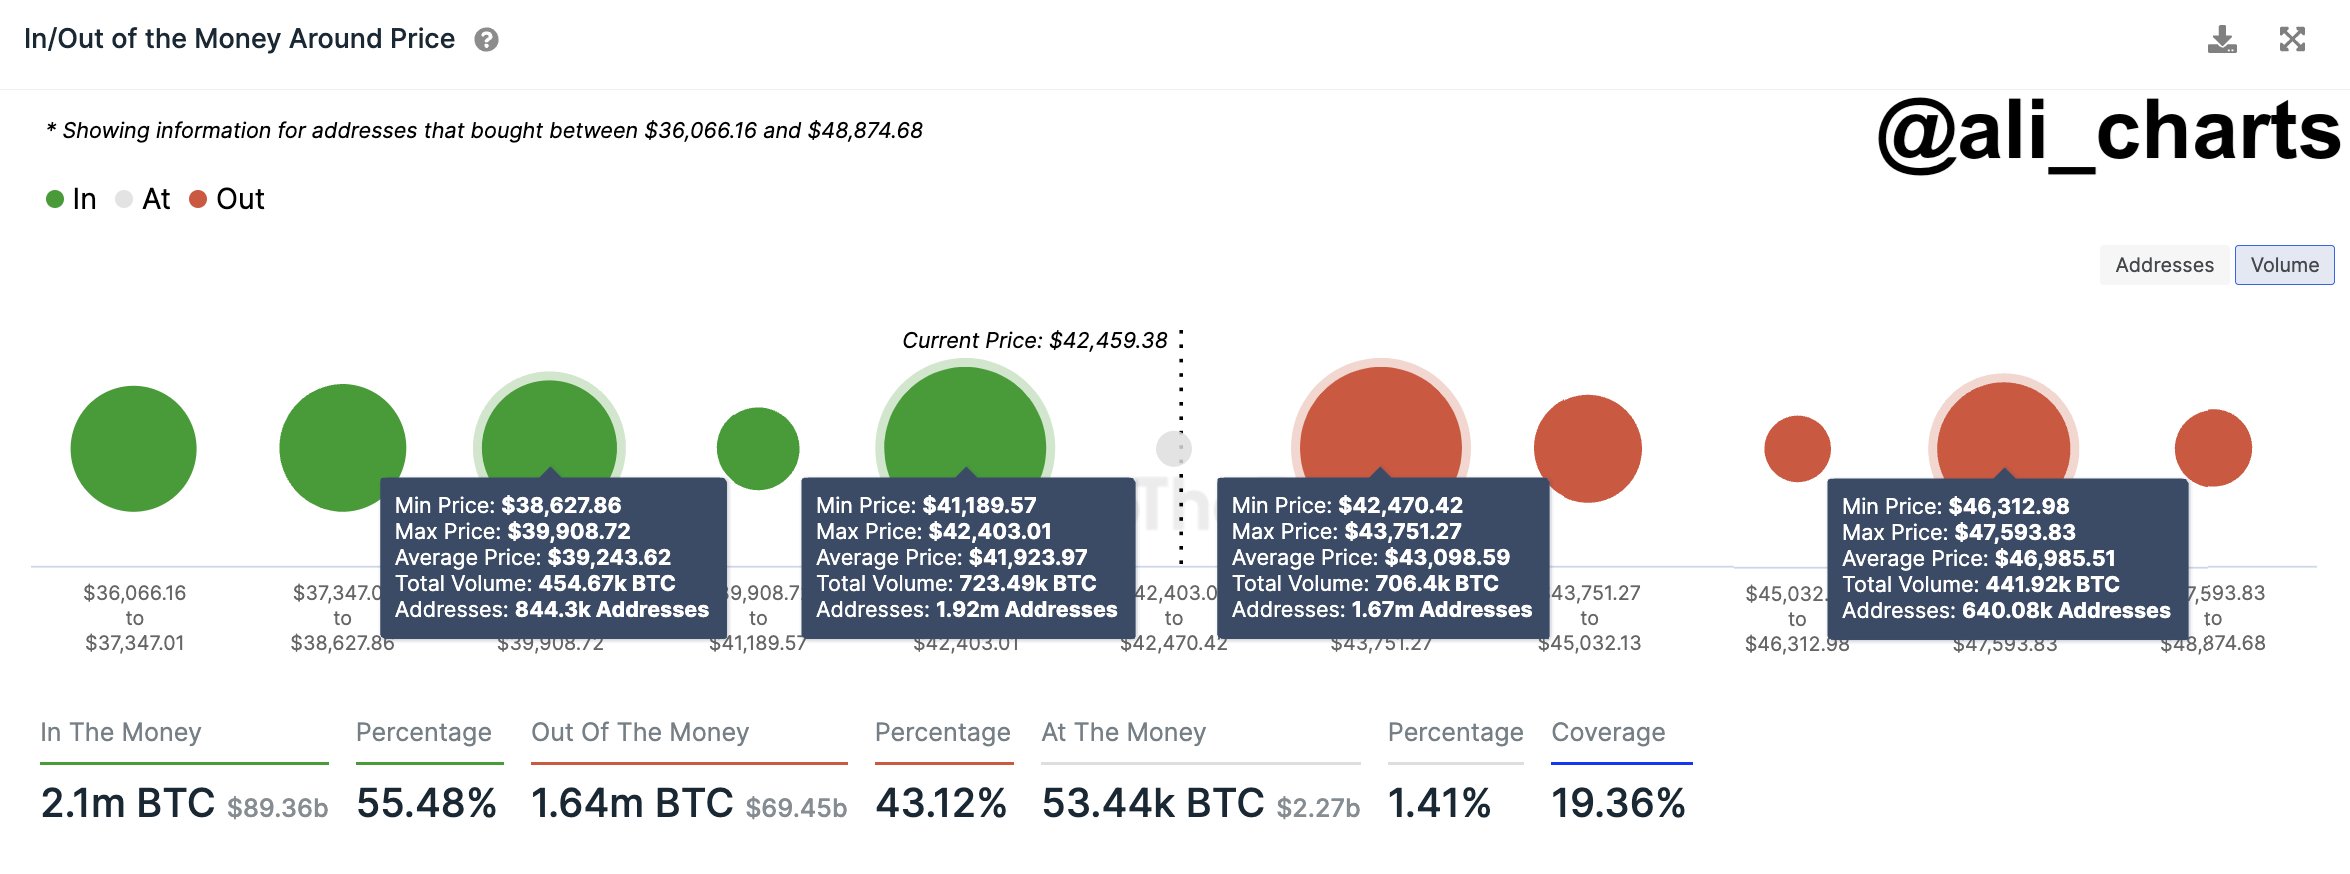
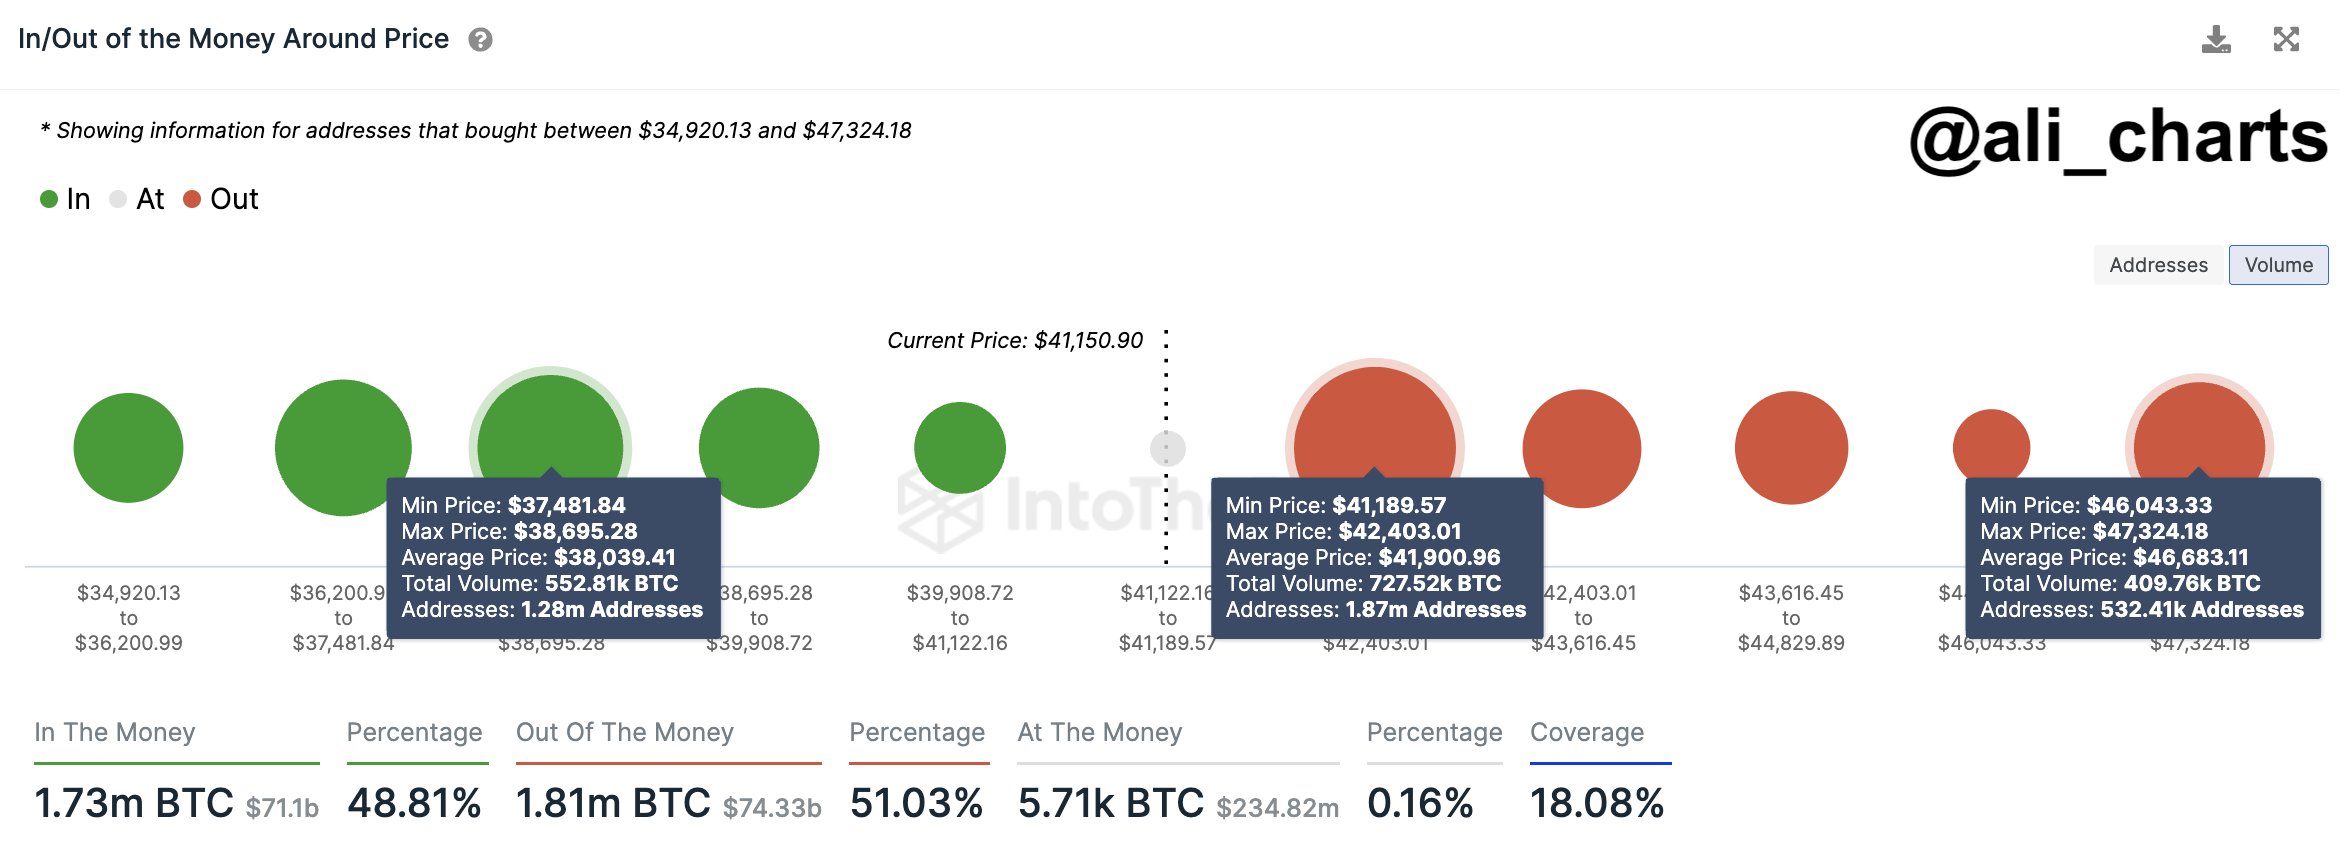
In on-chain analysis, a level’s potential as support or resistance is based on the total number of coins that the investors last acquired there. Below is a chart that shows what the various price ranges around the current spot price of the cryptocurrency look like in terms of this cost-basis distribution.

Bitcoin On-Chain Cost Basis

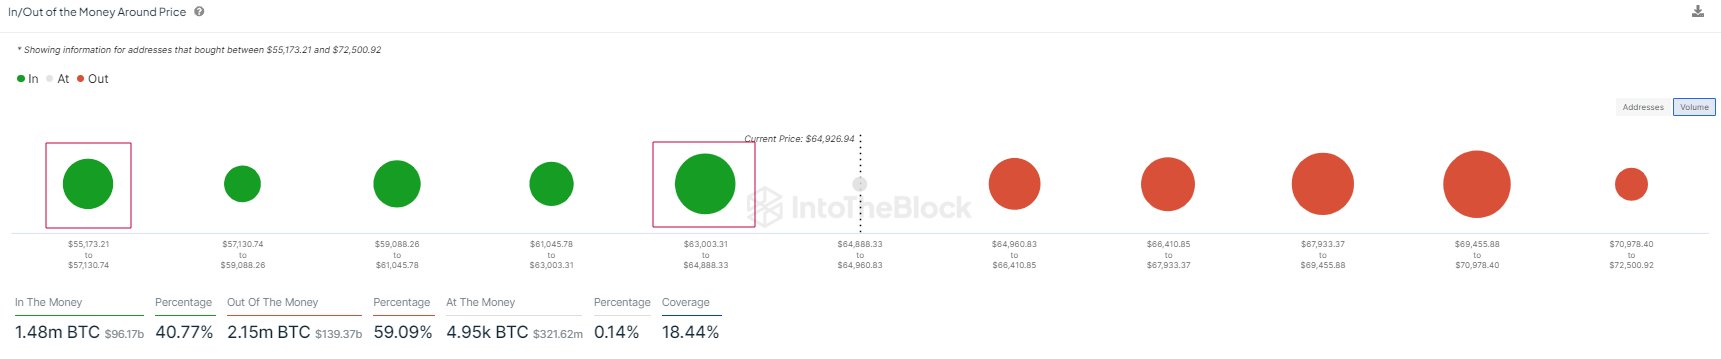
In the graph, the size of the dot represents the amount of Bitcoin that was purchased inside the corresponding price range. It would appear that the $63,000 to $64,890 level is currently thick with investors. To be more particular, 1 million investors acquired 530,000 BTC inside this range.

Generally, whenever the asset retests the cost basis of any investor, they may become more likely to make some kind of move, due to the importance the level holds for them.

Investors who were in profits just prior to the retest may be willing to make further bets, believing that if this level was profitable in the past it might be so again in the future.

Naturally, this buying effect would only be relevant for the market if a large amount of investors acquired coins inside a tight price range. The $63,000 to $64,890 range qualifies for this.

The range should have acted as a support point for the coin, but BTC has recently slipped under it, possibly suggesting that this support level may have broken down.

As IntoTheBlock has highlighted in the chart, the next major range of potential support is the $55,200 to $57,100 range. Thus, should the current drawdown continue, this may be the next relevant range.

“While this doesn’t mean that Bitcoin has to go this low, it is good to keep this range in mind while price is exploring recent lows,” notes the analytics firm. A decline to the average price of this range ($56,000) would mean a drawdown of almost 10% from the current spot value of the coin.

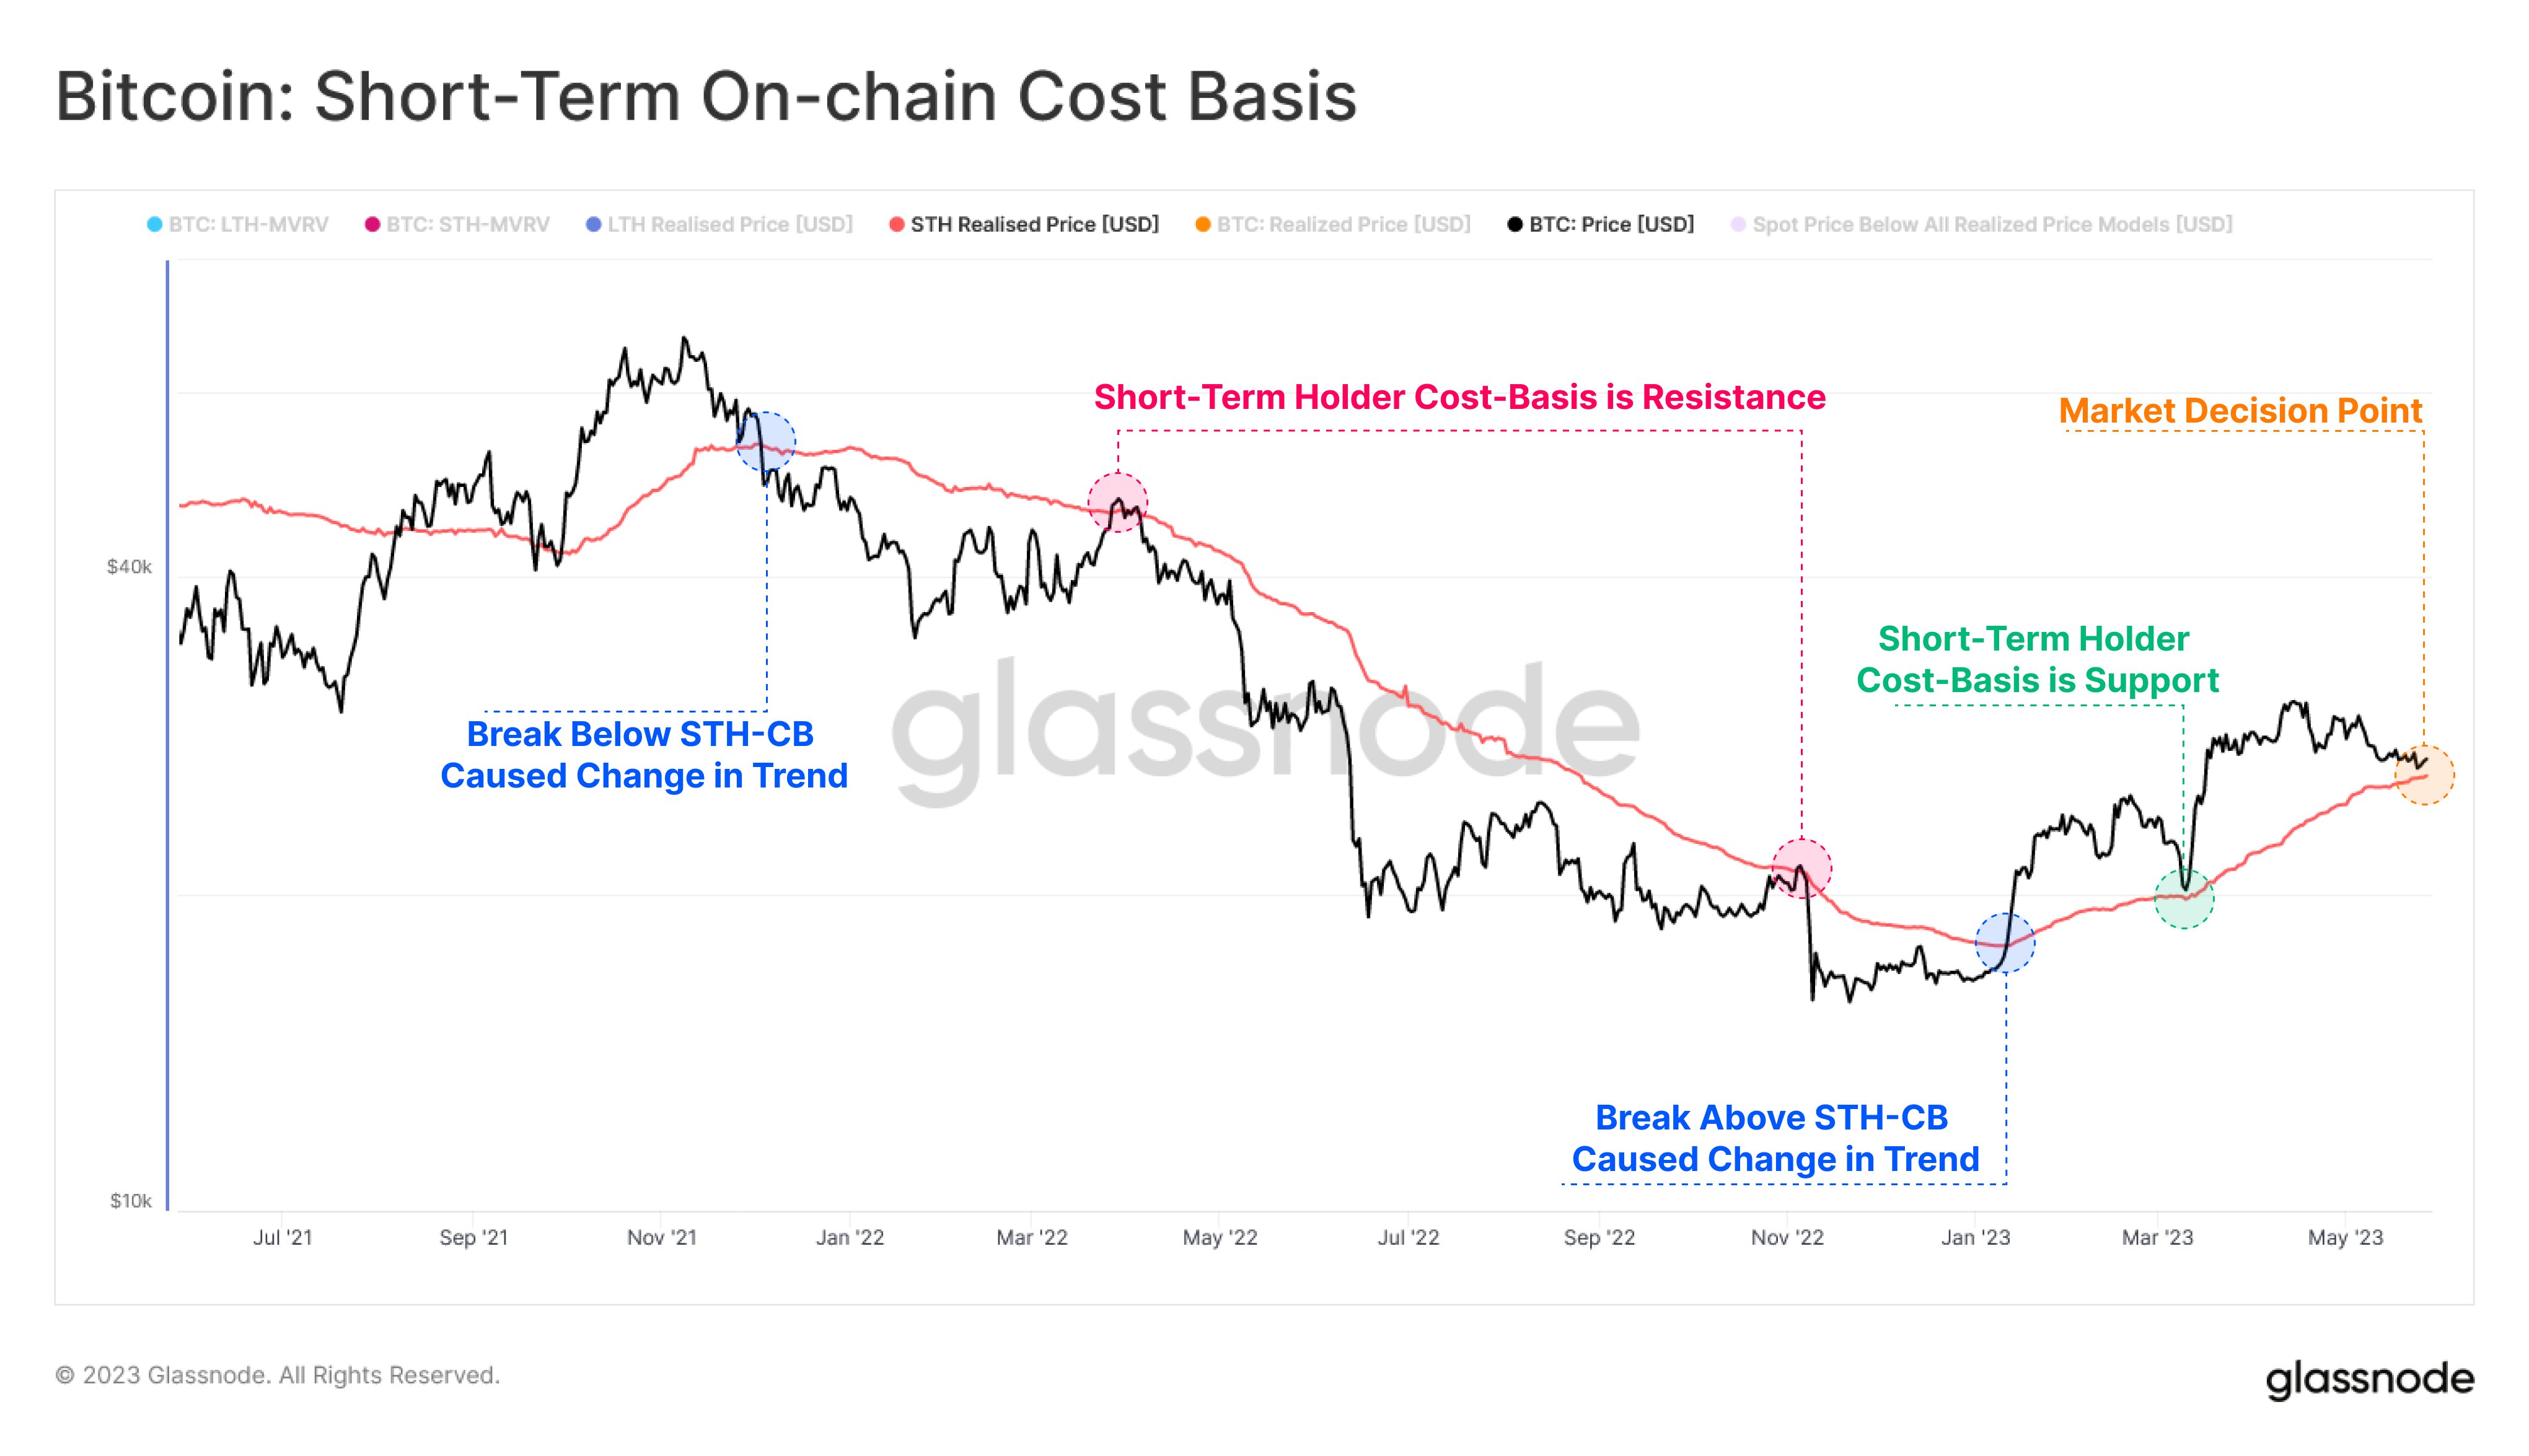
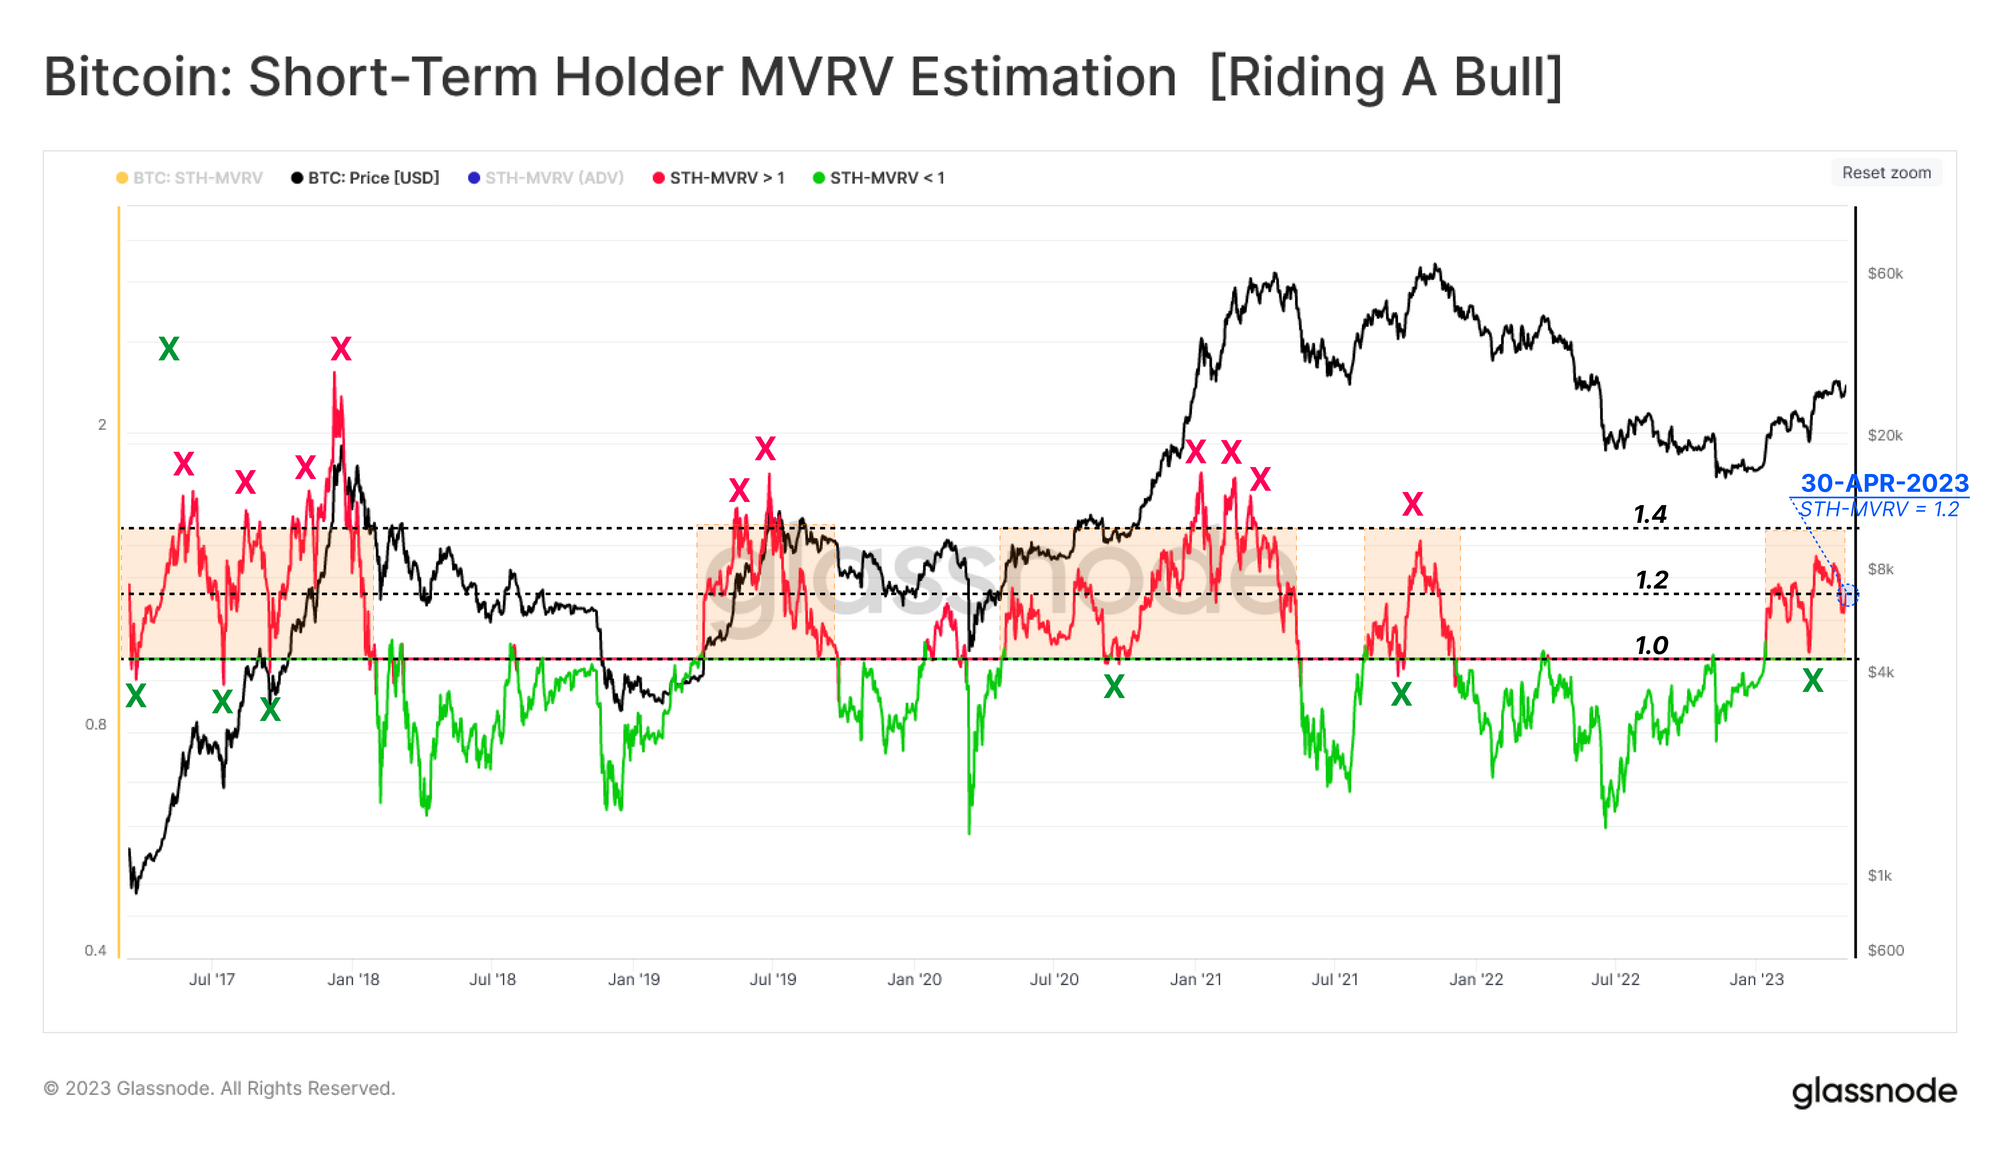
Before this level, though, there is another interesting on-chain level that BTC could end up revisiting. As analyst James Van Straten has pointed out in an X post, the Realized Price (the average cost basis) of the short-term holders is around $58,800 right now.

Bitcoin Short-Term Holder Realized Price

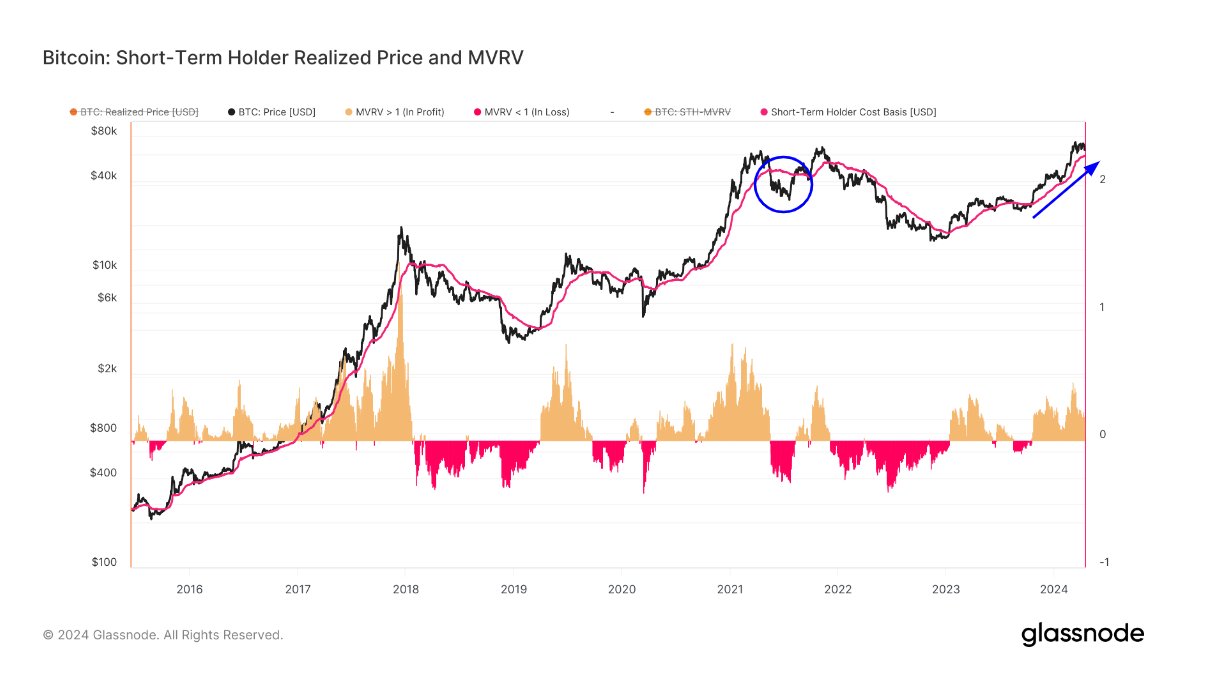
The short-term holders (STHs) here refer to the investors who bought within the past 155 days. This group’s Realized Price has been at an important level historically during bull runs, as the asset has often found support at it.

Breaks under it have, in fact, usually led to bearish transitions in the past. “If we drop below this, I will concede to a bear market similar to May 2021,” says Straten.

BTC Price

Bitcoin has registered a decline of almost 7% over the past 24 hours and in the process, has lost any recovery it had made earlier. Now, BTC is trading around $62,100.

Bitcoin Price Chart

Bitcoin Plunges Under $63,000, Here’s Where Next On-Chain Support Is

Bitcoin has deepened its decline in the past day with its price now slipping below $63,000. Here’s where the next potential support is, according to on-chain data.

Bitcoin Could Find Support At These Price Levels

In a new post on X, analyst Ali has discussed how the Bitcoin support and resistance levels are looking like right now based on on-chain data from Glassnode.

The indicator of relevance here is the “UTXO Realized Price Distribution” (URPD), which, in short, tells us about the amount of coins (or more precisely, UTXOs) that were last purchased at any given price level that the asset has visited in its history so far.

Below is the chart shared by the analyst that shows the data for this distribution for the price levels around the recent spot value of the cryptocurrency:

Bitcoin URPD

From the graph, it’s visible that there are a few price levels not far from the current one that particularly stands out in terms of the amount of buying that took place at them.

In on-chain analysis, the potential for any level to act as support or resistance is based on the total number of coins that have their cost basis at the level in question.

Levels thick with coins that are situated under the current price would be probable to act as points of support, while those above the spot value could prove to be resistance walls.

As is apparent from the graph, the $61,100, $56,685, and $51,530 levels are the ones below the current price that hold the cost basis of a notable amount of the supply right now. Naturally, this means that should the decline continue further, these would be the levels to watch for a possible rebound.

Two levels above, however, are even larger than all three of these support levels: the cost basis centers around $66,990 and $72,880. Interestingly, the latter of these is the single largest acquisition level out of all the price levels listed in the chart, implying that a large amount of FOMO buying has occurred at the asset’s all-time high levels.

In the scenario that Bitcoin regains its upward momentum, these levels of high cost basis population would be where the asset could be most probable to find some trouble.

Now, as for why acquisition centers are considered relevant for support and resistance in on-chain analysis is the fact that investors are likely to show some kind of reaction when a retest of their cost basis takes place.

When such a retest is from above, the holders may decide to accumulate more, believing that the price will go up again in the future. On the other hand, they may sell instead if the retest is from below, as they may think exiting at break-even is better than risking another drop.

A large number of coins having their cost basis at the same level means a potentially large degree of one of these reactions happening and, hence, a strong support or resistance effect on the price.

BTC Price

Bitcoin is inching closer to the first major on-chain support level as it has now dropped to $62,700.

Bitcoin Price Chart

Bitcoin Safe From Drops Under $60,300? On-Chain Data Says So

On-chain data shows Bitcoin currently has a thick supply wall between the $60,300 and $62,155 levels that may prevent the asset from falling lower.

A Large Amount Of Bitcoin Was Bought Near Current Prices

As explained by analyst Ali in a new post on X, BTC has a major support wall just below it right now. In on-chain analysis, the strength of support and resistance levels is gauged through the amount of Bitcoin that the investors bought at them.

The chart below shows how the distribution of the investor cost basis has looked like for BTC across the price ranges near the current spot value:

Bitcoin Support

Here, the size of the dot represents the number of tokens that the addresses bought between the corresponding price levels. From the graph, it’s apparent that the $60,300 to $62,100 range has a particularly high density of coins right now.

Most of the price levels in this range lie just below the current spot price of the cryptocurrency, meaning that the investors who bought here would be making some profit, albeit only a slight one.

Generally, when the price retests the cost basis of such investors who were in profit prior to the retest (meaning that the price has approached their cost basis from above), a buying reaction may be produced by these addresses.

This is because holders like these may have reason to believe that if they were able to get into profits before, they might be able to do so again in the near future, so they may just accumulate on this “dip.”

Such a reaction can naturally provide support to the cryptocurrency. The scale of this support, however, is naturally not anything significant if only a few investors bought at the level to begin with. Narrow ranges that are thick with addresses, on the other hand, might just prove to be a source of noticeable support.

In the aforementioned price range near the current spot price, one million addresses acquired a total of about 671,000 BTC. “This accumulation zone highlights strong investor confidence and could serve as a crucial level of support for BTC, potentially cushioning against further drops,” notes the analyst.

While the price ranges under the current price are heavy with coins, it’s visible in the chart that this isn’t the case for the ranges above. Just like how supply wallets below can be a source of support, they can instead act as resistance when above.

The fact that the supply walls above are quite thin suggests that there wouldn’t be too many investors waiting to quickly exit at their break-even, and thus, selling pressure due to them should be low.

That said, it doesn’t mean there isn’t any impedance at all. Bitcoin is approaching all-time highs at this point, meaning that the vast majority of the supply is in profit. At these levels, mass selling for harvesting these gains can be the main challenge preventing the run from continuing.

BTC Price

At present, Bitcoin is trading around the $62,000 level, meaning that it’s right on the edge of the major support wall.

Bitcoin Price Chart

Analyst Says Expect A Decline To $30,220 If Bitcoin Loses This Support

An analyst has explained how a decline to $30,220 or below could happen for Bitcoin if the strong support range below the current price gets lost.

Bitcoin Has Strong Support Between $42,560 And $43,245 Right Now

In a new post on X, analyst Ali has discussed how Bitcoin is floating above a strong on-chain support wall currently. In on-chain analysis, the potential of any price level to act as support or resistance lies in the amount of Bitcoin that was last purchased at said level.

This is because the investors naturally treat their cost basis or acquisition price in a special way and are thus more prone to make moves when the spot price retests it.

Such a reaction from the investors isn’t relevant when only a few of them share their cost basis at a particular level, but if the level observed a large amount of buying, its retest could indeed end up imparting some effects on the price. This is why the strength of any support or resistance level lies in the density of coins that were acquired at the level.

Now, to see the various price ranges in terms of the Bitcoin acquired at them, Ali has cited the “UTXO Realized Price Distribution” (URPD) from the on-chain analytics firm Glassnode.

This metric prices coins (or more precisely, UTXOs) based on the value at which they were last transferred on the BTC blockchain. Now, here is a chart that shows how this distribution is looking for the asset at the moment:

Bitcoin URPD

As displayed in the above graph, the price levels between $42,560 and $43,245 hold the cost basis of a large amount of UTXOs. To be more specific, this range saw the investors acquire a total of 1.11 million BTC.

At present, Bitcoin is a decent distance above this range. This means that the holders who have their cost basis inside it would be in profit right now.

Usually, such holders are more likely to accumulate further when the price retests their cost basis, as they would feel confident that the same level could prove profitable again in the future.

Due to this reason, the retest of a major supply block from above can end up with the cryptocurrency feeling some support. Since the $42,650 to $43,245 range is quite heavy with investors currently, BTC should have a strong support base to fall back on, should things go wrong.

“If Bitcoin can hold above this level, there is not much significant resistance ahead that will prevent it from advancing further,” explains the analyst. This is because there aren’t any large supply blocks at the upcoming ranges.

Investors in losses (which those with cost basis at the prices ahead would be) can be desperate to exit at their break-even, so a retest of their cost basis can provide resistance. As such, BTC has no major resistance ahead.

“But if $42,560-$43,245 fails to hold, expect a downswing to the next critical area of interest between $26,770 and $30,220,” warns Ali. From the current spot price, a drop to the upper end of this range, $30,220, would mean a drawdown of more than 32% for Bitcoin.

BTC Price

Bitcoin has observed a strong surge during the past day and is now challenging the $45,000 level once more.

Bitcoin Price Chart

Bitcoin Plunges Below Support As Price Crashes To $42,500

Bitcoin appeared to have been securely floating above support just earlier, but today, the picture has changed as the price has suddenly crashed to $42,500.

Bitcoin Has Crashed More Than 6% During Past 24 Hours

Bitcoin had kicked off 2024 with some sharp bullish momentum as the market had been looking toward the potential ETF approvals with hopeful eyes. The asset had only been at the $45,000 level not seen since April 2022 for just a couple of days before the price suddenly crashed.

The chart below shows how cryptocurrency has performed during the past few days.

Bitcoin Price Chart

During this plunge, Bitcoin had briefly hit a low under $41,500, but the cryptocurrency has since seen a bit of a rebound as its price is now trading around the $42,500 level.

As is usually the case, the rest of the sector has also plunged alongside the original digital asset, with most coins registering drawdowns of even greater degrees.

Just before this crash, Bitcoin had been floating above a critical support line and appeared set to continue its recent bullish momentum.

Bitcoin Had Broken Above An Ascending Triangle Pattern With Recent Rally

In a post on X before the crash, analyst Ali had discussed where the Bitcoin price might be heading after its break above the $45,000 level based on technical analysis data. Below is the chart that the analyst shared in the post.

Bitcoin Pattern

In the graph, Ali highlighted an Ascending Triangle pattern that Bitcoin appeared to have successfully broken out of with the price surge. An “Ascending Triangle” refers to a continuation pattern of two trendlines forming a triangular shape.

One of the trendlines is a horizontal level made by connecting highs in the asset, while the other is a diagonal line that joins together higher lows. The pattern is “ascending” in its name as the overall consolidation between these two trendlines narrows towards the upside.

Generally, when the price retests the horizontal level, it could likely feel some resistance and form a local top. If the resistance is broken through, it could be a sign that the asset would now display some continued upward momentum.

Similarly, the diagonal line is usually a point of support for the asset, and sustained breaks below could be to watch out for, as they can signal that a bearish trend is taking over.

From the chart, it’s visible that Bitcoin had gained some distance over the triangle above earlier and had appeared to be finding support at the 0.786 Fibonacci ratio, which is situated at around $44,900 for the asset.

Ali had noted that if sustained buying would continue at this support, Bitcoin might be able to push towards the $49,000 level. But as it has turned out, the market had other plans for the cryptocurrency, as its price has plunged far below this support level.

$47,600 Or $38,600? What Could Be Next For Bitcoin

An analyst has pointed out two demand zones that could be important for Bitcoin. Here’s what could be next for BTC based on these supply walls.

Bitcoin On-Chain Support And Resistance Levels Could Provide Hints For What’s Next

As explained by analyst Ali in a new post on X, Bitcoin has recently been floating between two major supply walls of the asset. “Supply wall” refers to the amount of Bitcoin that addresses acquired in any given price range.

The chart below shows what the different supply walls look like for BTC for the ranges around the current spot price of the cryptocurrency.

Bitcoin On-Chain Support & Resistance

In the above graph, the size of the dot represents the number of coins the investors bought inside the corresponding range. It would appear that the $41,200 to $42,400 and $42,400 to $43,700 ranges are notably heavy with supply.

To be more particular, the former range saw 1.92 million addresses buy a total of 723,490 BTC, while the latter witnessed an accumulation of 706,400 BTC from 1.67 million holders.

For any investor, their acquisition price or cost basis is an important level, as when the asset’s price retests, their profit-loss situation can potentially change. As such, the holders are more likely to show some reaction when such a retest takes place.

Naturally, just a few investors displaying a reaction won’t affect the market, but if many addresses share their cost basis inside a narrow range, the reaction from a retest could end up being sizeable.

Because of this reason, major supply walls (like the two mentioned just earlier) can end up being important retests for Bitcoin. Generally, the asset is more likely to feel support when this retest happens from above, while the coin could feel some resistance when it’s from below.

These effects seem to follow because of how investor psychology tends to work; an investor who was in profit before the retest might want to take a further gamble, believing the same price range to be profitable again. Such buying is the source of the support.

Similarly, loss holders would be tempted to sell when the price reaches their break-even point, as they may not want to risk holding further as the coin could go back down, pulling them underwater again.

Bitcoin has been trading between two major supply walls during its recent consolidation. “A sustained close beyond these bounds will help gauge BTC’s trend,” notes Ali.

The chart shows that the next large resistance ahead is between $46,300 to $47,600, while $38,600 to $39,900 carries the next major support below. “A breakout above resistance may propel BTC towards $47,600, while a dip below support might lead to a correction down to $38,600,” explains the analyst.

BTC Price

Bitcoin is trading around the $42,700 mark as it continues its recent sideways movement.

Bitcoin Price Chart

Bitcoin Crash To $38,000: Here’s What Could Trigger It

Data shows Bitcoin is losing a major region of on-chain support with its latest plunge. Here’s the range where the next zone lies for the asset.

Bitcoin Has Slipped Under $41,200 To $42,400 Support Region

As explained by analyst Ali in a post on X, BTC has slipped under a key on-chain support zone today. An “on-chain support” range refers to a price below the current spot price of the cryptocurrency that hosts the cost basis of many investors.

For any holder, the cost basis, the price at which they bought their coins, is a fundamental level, as a retest of it by the cryptocurrency can change their profit-loss balance.

Investor psychology works such that if this retest of the cost basis happens from above (meaning that the holder had been carrying profits before this), the holder might react by buying more of the asset because they may believe this same price range could turn out to be profitable again in the future.

On the other hand, any investor who had been in a loss earlier could become likely to sell when the price reaches its break-even mark, as they wouldn’t want to miss out on the opportunity to escape without any losses if the asset happens to drop again shortly.

The individual investors’ reactions aren’t generally relevant to the market as a whole. Still, if many holders show this reaction at once, the combined force can cause fluctuations in the price.

Now, here is a chart that shows what the different price ranges look like for Bitcoin in terms of the number of addresses who bought at them:

Bitcoin Support And Resistance

As displayed in the above graph, the Bitcoin range between $41,200 and $42,400 is quite thick with investors. In total, 1.87 million addresses have bought 727,520 BTC at these levels.

Bitcoin has been moving in and out of this crucial support region the past day, suggesting that the zone may weaken. If the range gets lost, BTC might see an extended drop below towards the next major support zone.

The chart shows that the $37,400 to $38,700 range is where substantial on-chain support could next be available, as 1.28 million addresses have their cost basis.

Thus, Bitcoin may be at risk of declining to as low as $38,000 (the average price of the range) shortly. In the potential scenario of such a drawdown, the current $41,200 to $42,400 range could also become resistance, as these addresses would become loss holders desperate to leave.

BTC Price

Bitcoin slipped toward the $40,500 level during the past day but has since recovered to the $41,600 mark. It would appear that the support may not be entirely lost yet.

Bitcoin Price Chart

Bitcoin MVRV At Critical Support Line, Will Retest Be Successful?

On-chain data shows the Bitcoin Market Value to Realized Value (MVRV) ratio is nearing a retest that could be crucial for the asset.

Bitcoin MVRV Ratio Is Nearing In On The 1.2 Level

As an analyst in a CryptoQuant Quicktake post explained, the 1.2 level of the MVRV ratio has historically been a support line for the cryptocurrency. The “MVRV ratio” is an indicator that measures the ratio between the Bitcoin market cap and the realized cap.

The “realized cap” here refers to a capitalization model for BTC that assumes the real value of each coin in circulation isn’t the current spot price but rather the price at which the coin was last bought/transacted on the blockchain.

As the realized cap considers the cost basis or acquisition price of each investor in the market, the model essentially represents the total capital that the holders have put into the asset.

Thus, comparing the market cap against the realized cap in the MVRV ratio can provide hints about whether the investors are holding more or less value than they put in.

When the ratio’s value is greater than 1, it means that the market as a whole is sitting on some profits right now. Generally, the higher the MVRV goes above this mark, the more probable corrections become for the asset as investors look to harvest their gains.

On the contrary, the indicator below this mark can signal that BTC may be underpriced right now, as the average holder in the sector carries coins at a loss.

Now, here is a chart that shows the trend in the Bitcoin MVRV ratio over the last few years:

Bitcoin MVRV Ratio

As is visible in the above graph, the Bitcoin MVRV ratio has been above the 1 mark during the past few months. The metric broke above this line in January when the rally started. Besides a retest in March, the indicator has remained above this level since then, implying that the holders have enjoyed profits.

The 1 level has been important historically for the asset. Still, the quant notes that another value is notable: 1.2. This line has supported the asset a few times in the past, as the analyst has highlighted in the chart (the yellow boxes).

Most recently, Bitcoin found support at this level in June, where the cryptocurrency could propel itself back up with a sharp rally. The metric is heading down and again approaching a retest of this line, as its current value is 1.27.

Naturally, a successful retest could be positive news for Bitcoin, but a failure might lead to an extended drawdown for the asset’s price.

BTC Price

As the chart below shows, Bitcoin has continued to consolidate recently, with the asset’s price still trading around the $25,700 level.

Bitcoin Price Chart

Bitcoin Plunges To $28,500, Will This Historical Support Hold Again?

Bitcoin has plunged toward the $28,500 mark during the past day, which happens to be quite near a historically significant support line.

Bitcoin Is Now Near The Short-Term Holder Realized Price

As pointed out by an analyst in a CryptoQuant post, BTC’s latest drawdown has brought it near the realized price of the short-term holders. The “realized price” here refers to a metric that’s derived from the “realized cap” model of Bitcoin.

The realized cap calculates the total valuation of the asset by assuming that the actual value of any coin in circulation is not the current spot price, but the price at which the coin was last transacted on the chain.

Since the last transfer price of any coin is likely to represent its buying price, this model accounts for the prices that each investor in the market bought their coins, and hence, the realized cap may be looked at as a measure of the total capital that holders have put into the cryptocurrency.

When this model is divided by the total number of coins in circulation, the average cost basis or acquisition price in the market is obtained. This is precisely what the realized price is.

If the Bitcoin spot price goes below this indicator, it means that the average investor has gone underwater. Similarly, breaks above the metric signify a return to profits for the majority of the market.

The realized price can also be defined for specific segments of the market. In the context of the current discussion, one part of the market is of relevance: the “short-term holders” (STHs).

Here is a chart that shows the trend in the Bitcoin realized price for this cohort:

Bitcoin Short-Term Holders Realized Price

The STHs include all investors who bought their coins within the last 155 days. The holders that pass beyond this threshold are termed “long-term holders” (LTHs).

From the chart, it’s visible that with the latest decline, the Bitcoin spot price has come very close to the STH realized price. This would suggest that these investors as a whole are about breaking even on their investment currently.

In the chart, the quant has highlighted how previous retests of this line have gone in this year so far. Interestingly, both back in March and June, the cryptocurrency found support at this metric and observed a sharp rebound.

This is a trend that has historically been seen during bullish periods. The reason behind this curious pattern may perhaps be the fact that the STHs look at their cost basis as a profitable point for accumulating more of the asset in such periods, as they believe that the price would only go up in the near future.

The extraordinary buying pressure at the line may be why the asset finds support at this level as well. This is because the opposite happens during bearish periods, as holders look to escape the market at their break-even point.

It now remains to be seen how Bitcoin’s interaction with the STH realized price will go this time around. Naturally, a successful retest would be a positive sign for the rally, as it would show that these investors haven’t yet lost their bullish conviction in the coin.

BTC Price

At the time of writing, Bitcoin is trading around $28,500, down 3% in the last week.

Bitcoin Price Chart

Bitcoin-Friendly Javier Milei Wins Presidential Primaries In Argentina

Argentine libertarian Presidential candidate and Bitcoin enthusiast Javier Milei has shocked the world by emerging victorious in Argentina’s recent primary elections. The pro-Bitcoin advocate scored the majority of the votes, making a stinging win during the Primaries on August 13.

Javier Milei Demolishes Electoral Competition

Javier Milei, an outspoken Argentine economist, is known for his sharp criticism of traditional politics and his fervent support of cryptocurrencies, including Bitcoin. Due to this, previous poll predictions had stated that Milei would score no higher than third place in the recent elections. 

However, Milei decimated the August elections with a stunning display of voter support, accumulating over 30% of the 90% of votes counted. Milei leads the libertarian party, “La Libertad Avanza” and the party is dominating with 32% of votes. 

In comparison, Argentine presidential candidates like Patricia Bullrich in “Juntos por el Cambio” (Together for Change) party received 28.14% votes, and Sergio Massa in “Unidos por la Patria” (Union for the Homeland) party received 26.84% votes. 

From the onset, Milei has attracted the attention of the Argentine population through his outspoken support of cryptocurrency, lack of political interventions, and the abolishment of the country’s central bank. 

Milei has stated that the country’s central banks should be destroyed to eliminate corrupt political authorities that influence the country’s economy and inflation rates. He has also said that Argentina’s adoption of bitcoin cryptocurrency would help create a more stable and accountable government, reducing government bureaucracy and improving the country’s declining economy. 

“The central bank is a scam, a mechanism by which politicians cheat the good people with inflationary tax,” Milei stated. 

Bitcoin (BTC) price chart from Tradingview.com (Javier Milei Argentina)

Argentina Grapples with Spiraling Economic Crisis

The daily reality of the Argentine country is filled with significant growth fluctuations, high inflation, and a deteriorating GDP. Argentina’s inflation is the third highest in the world, following Venezuela and Lebanon. Reports also state that the country faces one of the worst economic crises since the depression from 1998 to 2002. 

Recently, Argentina has hit new record lows against the dollar weekly. Since the beginning of 2023, the Argentine peso has lost 24% in value against the dollar, resulting in black market rates selling one dollar for 500 pesos. Argentina is also in debt, owing the International Monetary Fund (IMF) an astonishing $44 billion.

Milei’s approach toward adopting cryptocurrency triggers several governmental agencies, including the IMF, which strongly opposes Bitcoin cryptocurrency. Milei’s manifesto includes plans to dollarize the country’s economy, which aims to stabilize the country’s native currency. 

Argentina’s current economic crisis has also struck a nerve in Argentines, with many young citizens strongly supporting Milei’s views and commitment to free-market policies. 

Although Milei’s victory in the primaries is a positive step forward toward the general elections coming up on October 22, his success is not without controversy, as critics publicly oppose his policies and views. 

Milei’s win in the August primary election also does not guarantee a win in the general election. However, his victory has undoubtedly upended the country’s political system and sparked conversations about Argentina’s future.

Bitcoin Drops Under $29,000, Here’s Where BTC Could Find Support Next

Bitcoin has plunged below the $29,000 level during the past day. According to on-chain data, here’s the next level that could act as major support.

Bitcoin Short-Term Holder Realized Price May Be The Next Support Level

As pointed out by an analyst in a CryptoQuant post, the realized price of the short-term holders at $28,000 could be an essential level for the asset. The “realized price” here refers to the cost basis (that is, the buying price) of the average investor in the Bitcoin market.

Whenever the price of the asset dips below this level, it means that more than 50% of the investors are now underwater. Similarly, a break above the point implies that the overall market has entered into a state of profits.

In the context of the current discussion, the realized price of the entire market isn’t of relevance, but rather of a specific segment of it: the “short-term holders” (STHs).

This investor group typically only includes holders who bought their BTC within the last six months. Here is a chart that shows the trend in the average cost basis for this Bitcoin cohort over the history of the cryptocurrency:

Bitcoin Realized Price

Historically, the Bitcoin STH realized price has had some interesting interactions with the spot price of the asset. First is the interactions during bullish periods, which the quant has highlighted in the above graph.

It would appear that during these rallies, the price has usually remained above the level. But not just that, the STH realized price has actually actively provided support to it in such periods.

In the rally during the past year, too, a similar trend has been seen, as both during the March and June price drawdowns, the cryptocurrency rebounded when it made a retest of this line.

Psychologically, investors view their cost basis as a profitable buying opportunity during bullish periods, as they believe that the price will only go up from here. So, whenever the asset returns to its cost basis in such periods, they are likely to accumulate again.

This extraordinary buying pressure at the level of the STHs could perhaps explain why Bitcoin finds support here. In a similar way, the level acts as resistance during bearish periods, as investors start looking at their acquisition price as the ideal exit opportunity.

From the chart, it’s visible that the Bitcoin spot price is approaching the STH realized price once again right now. This level, which is valued at $28,000 currently, could possibly be where Bitcoin can turn around its recent trend of decline.

The analyst warns, however, “if the realized price of short-term holders fails to hold, the bull market may be over.”

BTC Price

At the time of writing, Bitcoin is trading around $28,900, down 1% in the last week.

Bitcoin Shows Recovery: Did This Historical Line Act As Support Again?

Bitcoin on-chain data suggests a historical support line may have helped the coin once again as the asset has recovered toward $28,000 today.

Bitcoin Short-Term Holder Cost Basis May Still Be Active As Support

According to data from the on-chain analytics firm Glassnode, the BTC price approached the cost basis of the short-term holders recently. The relevant indicator here is the “realized price,” which is a metric derived from the “realized cap.”

The realized cap refers to a capitalization model for Bitcoin that says that the value of each coin in the circulating supply is not the current spot price, but the price at which it was last transacted on the blockchain.

In this way, the model accounts for the price at which each investor acquired their coins. That is, their “cost basis.” When the realized cap is divided by the number of coins in circulation (to find a sort of average value), the aforementioned realized price emerges.

Related Reading: Bitcoin Exchange Inflows Mostly Coming From Loss Holders, Weak Hands Exiting?

This realized price signifies the average value at which each holder in the market bought their coins. The metric can also be defined for only partial segments of the market, like the “short-term holders” (STHs), in which case, the indicator will tell us about the average cost basis among this group only.

The STHs are all those investors who bought their coins less than 155 days ago. The BTC holders outside this group are termed the “long-term holders” (LTHs).

Now, here is a chart that shows the trend in the Bitcoin realized price for the STHs over the past couple of years:

Bitcoin Short-Term Holder Realized Price

In the above graph, Glassnode has marked the various instances where the Bitcoin STH realized price has apparently interacted with the spot price of the asset. Back when the 2021 bull run topped out in November, the cryptocurrency’s value dropped below this indicator, signaling a change of trend.

From this point on, as the bear market took over, the STH cost basis started providing resistance to the asset. Back in January of this year, though, the price finally managed to break through this resistance as the rally began to take place.

Related Reading: Bitcoin Bulls Push BTC Back Up To $28K Amid Surging Address Activity

This break lead to another change in the wider trend, as the line seemingly turned into support for the asset. However, this isn’t an unusual pattern, as bullish periods have historically observed the metric helping the price.

Recently, Bitcoin found some struggle, as the price plunged towards the $26,000 level. The consolidation near this level meant that the price was fast approaching the STH realized price, which was slowly going up.

When Glassnode posted the chart yesterday, it described this current state as a “decision point” for the market. According to the analytics firm, a successful retest here would be a sign of strength in the bullish trend, while failure would imply weakness.

Over the past day, Bitcoin has enjoyed a rebound, with the price briefly breaking above the $28,000 level. But it may perhaps not be a coincidence that the uplift has come right as the price was nearing a retest of this historical level.

Naturally, a sustained move away from the STH realized price now would confirm that the level is still active as support, a sign that would be positive for the rally’s sustainability.

BTC Price

At the time of writing, Bitcoin is trading around $27,900, up 4% in the last week.

Bitcoin Price Chart

Bitcoin Hangs At $26,200: Why This Is A Crucial Support Level

Bitcoin has plunged during the last 24 hours and now finds itself at the $26,200 level. Here’s why this level is important for the asset.

Bitcoin 200 WMA & 111 DMA Are Both At $26,200 Right Now

In a new tweet, the analytics firm Glassnode has talked about how the different technical pricing models for Bitcoin may be interacting with the asset’s price currently.

There are four relevant technical pricing models here, and each of them is based on different moving averages (MAs) for the cryptocurrency.

An MA is a tool that finds the average of any given quantity over a specified region, and as its name implies, it moves with time and changes its value according to changes in said quantity.

MAs, when taken over long ranges, can smooth out the curve of the quantity and remove short-term fluctuations from the data. This has made them useful analytical tools since they can make studying long-term trends easier.

In the context of the current topic, the relevant MAs for Bitcoin are 111-day MA, 200-week MA, 365-day MA, and 200-day MA. The first of these, the 111-day MA, is called the Pi Cycle indicator, and it generally finds useful in identifying short to mid-term momentum in the asset’s value.

The 200-week MA is used for finding the baseline momentum of a BTC cycle as 200 weeks are equal to almost 4 years, which is about what the length of BTC cycles in the popular sense is.

Here is a chart that shows the trend in these different Bitcoin technical pricing models over the past year:

Bitcoin Technical Pricing Models

As shown in the above graph, these different Bitcoin pricing models have taken turns in providing support and resistance to the price during different periods of the cycle.

For example, the 111-day MA turned into support recently, as the price rebounded off this level back during the plunge in March of this year, as can be seen in the chart.

The 111-day and 200-week MAs have recently come into phase, as both their values stand at $26,200 right now. This is the level that Bitcoin has been finding support at in recent days, so it would appear that the base formed by these lines may be helping the price currently.

Glassnode notes that if a break below this region of support takes place, the next levels of interest can be the 365-day and 200-day MAs. The former of these simply represent the yearly average price, while the latter metric is called the Mayer Multiple (MM).

The MM has historically been associated with the transition point between bullish and bearish trends for the cryptocurrency. When the 111-day MA provided support to the price back in March, the metric had been in phase with the MM.

From the graph, it’s visible that the 365-day and 200-day MAs have also interestingly found confluence recently, as their current values are $22,300 and $22,600, respectively. This would imply that between $22,300 and $22,600 may be the next major support area for the asset.

BTC Price

At the time of writing, Bitcoin is trading around $26,200, down 4% in the last week.

Bitcoin Price Chart

$24,400 May Be Next Major Level Of Support For Bitcoin, Here’s Why

Historical data of an on-chain indicator may suggest that the $24,400 level could be a major level of support for Bitcoin right now.

Bitcoin STH MVRV Would Hit 1.0 If Price Declines To $24,400

According to this week’s edition of the Glassnode report, the 1.0 level of the Bitcoin STH MVRV has been a point of support for the market during uptrends in the past. The “STH” here refers to the  “short-term holder group,” which is a Bitcoin cohort that includes all investors who have been holding onto their coins since less than 155 days ago.

The “market value to realized value” (MVRV) is an indicator that measures the ratio between the Bitcoin market cap and its realized cap. The “realized cap” here is a BTC capitalization model that aims to find the “real” value of the asset by assuming that the value of each coin in circulation is not the current price, but the price at which it was last moved on the blockchain.

Since the realized cap accounts for the price at which the investors bought (which is the price at which their coins last moved), its comparison with the market cap (that is, the current price) can tell us about the degree of profitability or loss among the overall market.

When the MVRV is greater than 1, it means the average investor is holding an unrealized profit with their BTC right now. On the other hand, values below this threshold imply the market as a whole is holding some amount of unrealized loss currently.

Now, the “STH MVRV,” the actual indicator of interest in the current discussion, naturally measures the value of the ratio specifically for the coins owned by the Bitcoin short-term holders.

The below chart shows the trend in the 7-day average value of this metric over the last few years:

Bitcoin Short-Term Holder MVRV

In the graph, Glassnode has marked the lines of the 7-day average Bitcoin STH MVRV that have been relevant to the price of the cryptocurrency during the last few years.

It looks like short-term corrections for the asset have generally become more probable when this indicator has crossed a value of 1.2. At this level, the STHs hold unrealized profits of 20%.

The recent drawdown in the cryptocurrency’s price from the $30,000 mark also took place when the metric was above this level. To be more specific, the indicator had a value of 1.33 when the asset was rejected, implying that the STHs had 33% profits.

The reason that high MVRV values of this cohort have usually made a decline more probable for the price is that the higher the amount of profits that the STHs hold, the more likely they become to sell and harvest their gains.

From the chart, it’s visible that the on-chain analytics firm has also marked the relevance of the 1.0 level (that is, the threshold line between profit and loss) to the cryptocurrency. Interestingly, this level has generally provided support to the price during periods of uptrend.

The likely explanation behind this trend is that the 1.0 level serves as the cost basis of the majority of the STHs in the market, so when the price hits this mark, these investors look at this point as a profitable zone to accumulate more of the asset. Obviously, this behavior is only seen during rallies, as holders would only find it worthful to buy more if they think the price has the potential to grow.

As the market is right now, the price would need to decline to $24,400 in order to hit this 1.0 level. This implies that if Bitcoin observes a deep decline in the near future, $24,400 could be the level that can provide support to it, considering the pattern that has held during the last few years.

BTC Price

At the time of writing, Bitcoin is trading around $28,500, down 1% in the last week.

Bitcoin Price Chart

This Historic Bitcoin On-Chain Support Level Is Still Not Lost

On-chain data shows the historical 20-Day MA Bitcoin aSOPR support level has continued to hold so far.

Bitcoin 20-Day MA aSOPR Rebounds Off Historical Support Line

As pointed out by an analyst in a CryptoQuant post, the BTC aSOPR recently retested its 8-year old support.

The “Spent Output Profit Ratio” (or SOPR in short) is an indicator that tells us whether the average Bitcoin investor is selling at a profit or at a loss right now.

When the value of this metric is greater than 1, it means the overall market is moving coins at some profit currently.

On the other hand, values of the indicator less than the threshold suggest holders as a whole are realizing some loss with their selling at the moment.

Naturally, SOPR values exactly equal to 1 imply the investors are just breaking even on their investment right now.

“Adjusted SOPR” (aSOPR) is a modified version of this metric that excludes from the data any selling of coins that was done within 1 hour of first acquiring said coins.

Here is a chart that shows the trend in the 20-day moving average Bitcoin aSOPR over the last several years:

Bitcoin aSOPR

Looks like the 20-day MA value of the metric has sharply declined in recent days | Source: CryptoQuant

As you can see in the above graph, the 20-day MA aSOPR rapidly went down following the FTX crash, and touched a low of 0.93 just a week or so ago.

This level was the same as the one seen during the lows of the previous bear markets, and each of the touches in those bears launched the metric back up.

The support line has now been active since 2014, and in the 8 years so far the indicator has never seen any actual dip below it.

Since the retest of this support level a week ago, the metric has already bounced back up, suggesting that this important support line is still holding right now.

However, it’s uncertain whether this successful retest means the bottom is now in. Back In the 2018/19 bear, it was indeed the case, but in 2014/15 it took two touches of the line before the real bottom formed.

BTC Price

At the time of writing, Bitcoin’s price floats around $16.8k, up 3% in the last week. Over the past month, the crypto has lost 18% in value.

The below chart shows the trend in the BTC price over the last five days.

Bitcoin Price Chart

The value of the crypto seems to have been moving sideways since the surge | Source: BTCUSD on TradingView
Featured image from André François McKenzie on Unsplash.com, charts from TradingView.com, CryptoQuant.com