Bitcoin Bulls Roar: Analysts Predict Surge To $82,000 Amid Bullish Pennant Formation

Renowned crypto analyst Jelle has caught the attention of the Bitcoin (BTC) community with his bold prediction of a target price of $82,000.

Notably, despite recent challenges in breaking above the $66,000 mark, Bitcoin currently hovers around $67,780, showing resilience in the face of a short-term pullback.

BTC To $82,000 Soon?

In an X post uploaded earlier today, crypto analyst Jelle shared his latest view on Bitcoin. According to the analyst, the Bitcoin target “remains the same: $82,000”.

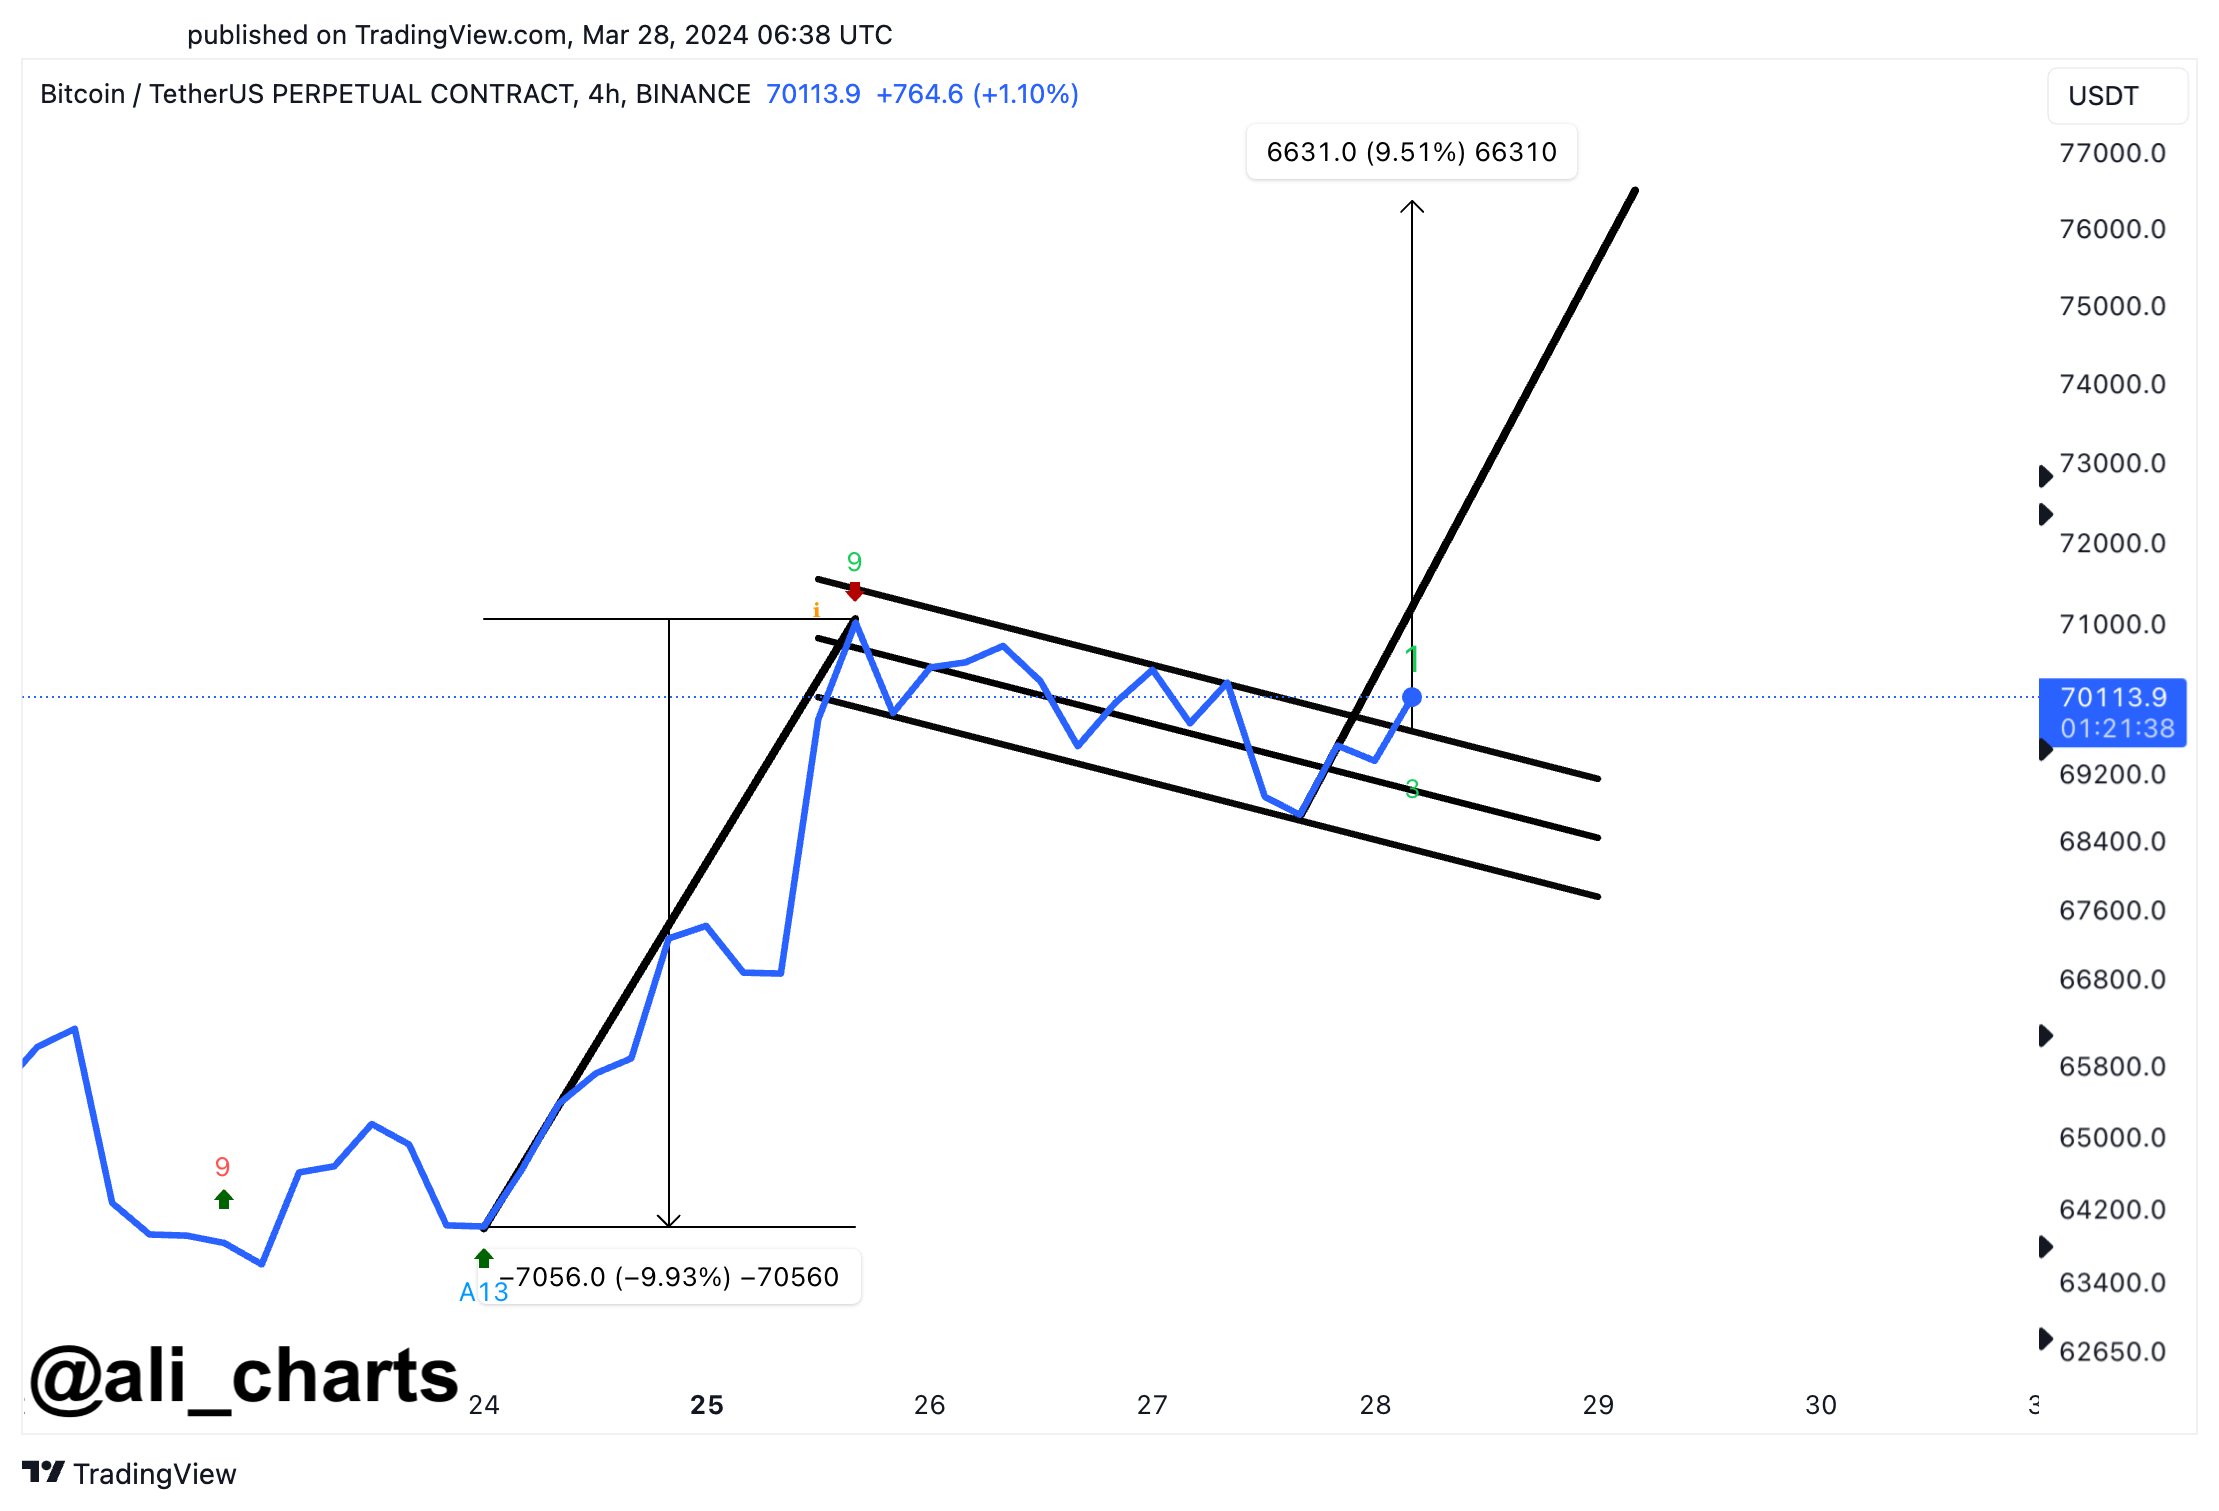
It is worth noting that Jelle’s forecast is based on his observation of a “bullish pennant” formation, a technical pattern that suggests a potential surge in the price of BTC. According to the analyst, the asset might experience some volatility this month.

Jelle emphasized that a bullish pattern is forming, coinciding with the upcoming BTC halving in a few weeks. This adds credibility to the emerged bullish pennant formation and the possibility of Bitcoin reaching $82,000 shortly.

Notably, the Halving is a pre-programmed event built into the Bitcoin protocol that occurs approximately every four years or after every 210,000 blocks are mined to reduce the reward for mining new Bitcoin blocks, ultimately decreasing the supply of new coins.

Historically, the event has triggered bullish price movements, as reduced supply often leads to increased demand and speculative buying. The Bitcoin halving is currently less than 20 days away.

Bitcoin Latest Price Action

While BTC has faced challenges in its upward trajectory over the past week, recent movements suggest a shift in momentum. Within the last 24 hours alone, the asset has shown a promising 2.7% increase, rising from a low of $65,135 to its current trading price of $67,628.

Bitcoin (BTC) price chart on TradingView

Despite this positive movement, BTC still reflects a decline of approximately 6.4% over the past 7 days. However, amid this fluctuation, analysts such as Captain Faibik foresee the potential for a significant rebound in Bitcoin’s value before April concludes.

Captain Faibik’s analysis, mirroring the sentiments of fellow analyst Jelle, focuses on Bitcoin’s bullish pennant formation observed on the 12-hour timeframe chart. This formation suggests an imminent breakout towards the upside.

If this breakout materializes successfully, BTC could soar to unprecedented levels, with projected price targets ranging from $88,000 to $90,000 by month’s end, according to Captain Faibik.

Featured image from Unsplash, Chart from TradingView

Bitcoin Bull Flag Could Predict 10% Surge To $77,000, Analyst Explains

An analyst has explained that a breakout from a bull flag pattern could lead Bitcoin to surging towards a new all-time high of $77,000.

Bitcoin Has Been Forming A Bull Flag Pattern Recently

In a new post on X, analyst Ali has discussed about a bull flag recently forming in the 4-hour price of the cryptocurrency. The “bull flag” here refers to a pattern in technical analysis that, as its name implies, looks like a flag on a pole.

In this pattern, a sharp uptrend is succeeded by a period of consolidation towards the downside. The uptrend makes up for the pole, while the consolidation period acts as the flag.

When the price is trapped inside the flag, it tends to find resistance at its upper line, so tops may be probable to form there. Similarly, the lower line may act as support, thus facilitating for bottoms to take shape.

The bull flag is usually considered to be a continuation pattern, meaning that the prevailing trend (that is, the trend of the flag) would continue once the consolidation period is over.

This happens when a break above the resistance line takes place. The uptrend emerging out of such a break may be of the same height as the pole. If the asset falls under the support line, though, the pattern could be considered invalidated.

Like the bull flag, there is also the bear flag pattern, which works similarly except for the fact that the pole in this case corresponds to a downtrend while the flag is generally a consolidation channel angled upwards. Just like the bull flag, a continuation of the prevailing bearish trend may follow this formation.

Now, here is the chart shared by Ali that shows the bull flag that BTC’s 4-hour price has recently been consolidating inside:

Bitcoin Bull Flag

From the graph, it’s visible that the 4-hour Bitcoin price has appeared to have been consolidating inside this bull flag over the last few days. It’s also apparent that, in the past day, BTC has been climbing above the resistance line of the pattern.

This could mean that the cryptocurrency is preparing a break out of this formation. Naturally, the asset would have to show more momentum before the breakout can be confirmed.

“If BTC holds above $70,000, we could see a surge of nearly 10% to a new all-time high of $77,000!” says Ali. The analyst has chosen this target as such a swing would be of the same length as the pole that had preceded this flag.

BTC Price

Bitcoin has so far been heading in a direction that would add more credence to the breakout, as its price has now broken past the $71,300 level. With this surge, BTC investors would be enjoying profits of more than 7% over the past week.

Bitcoin Price Chart

Bitcoin Flies Above $47,300, But Watch Out For Extreme Greed

Bitcoin is finally showing a sustained bullish push as it has now broken above $47,300, but overly positive sentiment can be an obstacle to this rally.

Bitcoin Fear & Greed Index Suggests Market Is Nearing Extreme Greed

The “Fear & Greed Index” is an indicator that tells us about the general sentiment among the investors in the Bitcoin and wider cryptocurrency sector. According to Alternative, its creator, the index takes into account five factors to calculate this sentiment.

These are volatility, market volume, social media sentiment, market cap dominance, and Google Trends. The index outputs the sentiment as a number lying between zero to hundred.

All values of 46 and under imply the investors are fearful, while those of 54 or over suggest the presence of greed in the market. The region between 47 and 53 corresponds to the region of neutral sentiment.

Now, here is what the Fear & Greed Index looks like for Bitcoin right now to see which of these regions the market stands in at present:

Bitcoin Fear & Greed Index

As is visible above, the Bitcoin Fear & Greed Index has a value of 72 at the moment, implying that the majority of the investors in the space share a greedy mentality.

Besides the three core sentiments mentioned earlier, there are also two extreme ones: the extreme fear and extreme greed. The former of these occurs at values of 25 and under, while the latter takes place at 75 and above.

Historically, these two sentiments, in particular, have held great significance for the cryptocurrency’s trajectory. Generally, at any point, the asset is more likely to move against the expectations of the majority, and in these extreme regions, this expectation becomes the strongest.

As such, these sentiments have been where major reversals in the asset have been the most likely to occur. Followers of a trading philosophy called “contrarian investing” exploit this fact to time their buying and selling moves. Warren Buffet‘s famous quote sums up the idea, “Be fearful when others are greedy, and greedy when others are fearful.”

At a value of 72, the Bitcoin market is quite close to entering into the extreme greed region right now. Just yesterday, the metric had a value of 66, which means there has been some jump in just the past 24 hours.

Bitcoin Extreme Greed

This increase in the index has naturally come because of the bullish momentum that the asset has enjoyed in the past day. Any further improvements in sentiment, however, may be alarming, as the metric would then enter into the extreme greed territory.

The last time that the Bitcoin Fear & Greed Index surged into extreme greed values was around the time of the approval of the spot exchange-traded funds (ETFs). As it happened, the coin hit its top, coinciding with this overly bullish mentality.

Thus, if this precedence is anything to go by, any visit into the territory in the coming days may serve as a warning that a top is near for the cryptocurrency.

BTC Price

Bitcoin has enjoyed an uplift of over 6% during the past 24 hours as its price has cleared the $47,300 level.

Bitcoin Price Chart

Bitcoin Rally Still Has Some Legs Left, Santiment Explains Why

The analytics firm Santiment has explained that the current Bitcoin rally could still have some legs left, based on this on-chain trend.

Bitcoin & Ethereum Leave Exchanges, While Tether Sees Deposits

In a new post on X, Santiment has discussed the recent trends in the Supply on Exchanges for the three largest assets in the cryptocurrency sector: Bitcoin (BTC), Ethereum (ETH), and Tether (USDT).

The “Supply on Exchanges” here refers to a metric that keeps track of the percentage of the total circulating supply of any given coin that’s currently sitting in the custody of the centralized exchanges.

When the value of this metric goes up, it means that the investors are depositing their coins to these platforms currently. On the other hand, a decline implies net withdrawals are occurring on the exchanges right now.

What these trends suggest for the given asset and the sector as a whole depends on the type of cryptocurrency it is in question. In the case of volatile coins like Bitcoin and Ethereum, net deposits can be a sign that investors are looking to sell these assets, which can naturally have a negative impact on their prices.

Since the altcoins generally only see a rotation of capital through these largest cryptocurrencies, a bearish trend for them can have a domino effect on their prices as well.

Withdrawals for these volatile coins, on the contrary, can be bullish for the market, as they imply the investors are perhaps looking to hold onto their tokens for extended periods.

Now, here is a chart that shows the trend in the Supply on Exchanges for Bitcoin and Ethereum over the past year:

Bitcoin, Ethereum, & Tether

As displayed in the above graph, the Bitcoin and Ethereum Supply on Exchanges have continued their downtrend following the spot ETF approvals for BTC a few weeks back.

In the same chart, Santiment has also attached the data of the indicator for Tether. It would appear that while BTC and ETH have seen supply move off exchanges, USDT has observed net deposits.

The largest stablecoin in the sector has witnessed around 4% of its entire supply shifting to these platforms over the last five weeks, which has taken the indicator’s value to the highest point in almost ten months.

Investors use stablecoins whenever they want to escape the volatility associated with assets like BTC and ETH. Such holders who seek safe haven in these fiat-tied tokens instead of fiat itself, though, usually plan to return back to the volatile side of the cryptocurrency sector eventually.

Deposits of stablecoins can, therefore, be a sign that these investors want to buy back into Bitcoin and others. As such, the sector could see a bullish effect from this dry powder being deployed by the stablecoin holders.

“The increase in buying power implies that the mid-term 3+ month #bullcycle (starting back in October) could still have some legs, particularly with just 79 days until the #Bitcoin halving, estimated to occur on April 18th,” notes the analytics firm.

BTC Price

Bitcoin has made some notable recovery over the last few days as its price has now broken back above the $43,300 mark.

Bitcoin Price Chart

Whale Watch: Bitcoin’s $100,000 Transactions Soar, More Surge Ahead?

The Bitcoin (BTC) network has experienced a significant uptick in high-value transactions, a phenomenon not seen in nearly two years. Crypto analyst Ali has highlighted this trend, noting 16,900 transactions, each exceeding $100,000.

This surge is a critical indicator of increased activity by Bitcoin whales – entities holding large amounts of BTC – and provides valuable insight into their strategic maneuvers in the current market landscape.

Bitcoin Recovery Following Matrixport Reports Saga

This flurry of whale activity arrives amid a backdrop of intensified market volatility. Bitcoin, the bellwether of the digital currency world, recently underwent a price correction, dipping below the $41,000 mark.

This downturn has been attributed to various factors, particularly the controversial report from Matrixport, which gave reasons why the US Securities and Exchange Commission (SEC) may reject several spot Bitcoin exchange-traded funds (ETFs) applications this month.

Despite these factors, Bitcoin has shown resilience as it has begun to regain ground, hovering around the $43,000 mark. The asset has demonstrated a 2.5% increase over the last week.

Bitcoin (BTC) price chart on TradingView

BTC To $50,000?

Several analysts have weighed in with predominantly bullish forecasts in the wake of Bitcoin’s recovery from the week’s earlier downturn. Dan Gambardello posits that Bitcoin might be on the cusp of “breaking out from a symmetrical triangle pattern.”

This technical formation, often characterized by decreasing volatility and converging trendlines, hints at potential price escalation. Gambardello asserts that this breakout could catapult BTC to the $50,000 mark, especially with the anticipated approval of a spot Bitcoin ETF.

A symmetrical triangle, recognized by its oscillating price movements between converging upper and lower trendlines, signifies a standoff between buyers and sellers. Should BTC shatter the upper boundary of this pattern, as Gambardello suggests, it may indeed embark on an unprecedented trajectory, surpassing critical resistance levels within its Fibonacci sequence.

Another voice in the chorus of bullish predictions is Adrian Zduńczyk, a renowned crypto trader. Zduńczyk shares an optimistic outlook, forecasting that BTC could reach new all-time highs following its upcoming halving event.

Featured image from Unsplash, Chart from TradingView

Bitcoin Surge Above $27,000 May Not Last, Here’s Why

Bitcoin has broken back above the $27,000 level during the past day, but if on-chain data is to go by, this surge may not last for long.

Bitcoin Investors Are Taking Profits At Highest Rate In 3 Months

According to data from the on-chain analytics firm Santiment, there is a chance that a short-term correction could happen for the cryptocurrency. The relevant metric here is the “ratio of daily on-chain transaction volume in profit to loss,” which, as its name suggests, tells us about how the profit-taking volume compares against the loss-taking volume on the Bitcoin network right now.

This indicator works by going through the transaction history of each coin being sold/transferred on the blockchain to see what price it was moved at before. If this previous selling price for any coin was less than the current spot price, then that coin is being sold at a profit right now.

The sale of all such tokens would contribute toward the Bitcoin profit-taking volume, while coins of the opposite type would add towards the loss-taking volume.

Now, here is a chart that shows the trend in this BTC metric over the past few months:

Bitcoin Profit-Taking Volume

As displayed in the above graph, this Bitcoin indicator has observed a large spike as the cryptocurrency’s price itself has seen a surge beyond the $27,000 mark and has reached a value of 2.51.

When the metric has a value greater than zero, it means that the profit-taking volume is more than the loss-taking volume. On the other hand, values under this threshold suggest the dominance of loss-taking.

At the current value of 2.51, the profit-taking volume outweighs the loss-taking one by 3.51 to 1. This disparity between these two volumes is the highest it has been since around three months ago.

Historically, intense profit-taking has usually resulted in at least a short-term top for Bitcoin, so it’s possible that the current values of the metric would also result in a correction for the price.

In the chart, Santiment has also attached the data for the “Market Value to Realized Value (MVRV) ratio,” which keeps track of the difference between the Bitcoin market cap and realized cap.

The latter of these is basically a measure of the total amount of capital that the investors as a whole have put into the cryptocurrency, so this metric tells us how the value that the holders are carrying currently compares with their total investment.

From the graph, it’s visible that the 7-day Bitcoin MVRV ratio has turned notably positive with this rise, which implies that the investors are carrying profits at the moment.

The analytics firm notes that this metric going back below zero would be ideal for the next leg up, as the holders being in loss would lead to an exhaustion of the profit-sellers.

BTC Price

So far, despite the aggressive profit-taking happening in the market, Bitcoin has managed to hold above the $27,000 mark.

Bitcoin Price Chart