CryptoQuant Founder Puts $112,000 Target For Bitcoin This Year

The founder of on-chain analytics firm CryptoQuant has said Bitcoin could reach a target of $112,000 this year driven by the ETF inflows.

Bitcoin May Hit $112,000 Based On Inflows Into The ETFs

In a new post on X, CryptoQuant CEO and founder Ki Young Ju talked about the outlook of the cryptocurrency based on the inflows going towards the spot exchange-traded funds (ETFs).

The analyst has used the “Realized Cap” indicator to find price targets for the coin. The Realized Cap refers to a capitalization model for Bitcoin that calculates the total valuation of the asset by assuming that the real value of any coin in circulation is the price at which it was last transacted on the blockchain.

If the previous transaction of any token is assumed to have involved a change of hands for it (that is, buying and selling took place), then the last transfer price would correspond to the cost basis of the coin.

As the Realized Cap essentially adds up the cost basis of all the investors, one way to look at the metric is as a measure of the total amount of investment the holders have put into the coin.

Naturally, the Realized Cap pushes up as trades occur at a higher spot price. Something that could be particularly influential for the Realized Cap this cycle may be the spot ETF inflows.

The spot ETFs, which finally got approval from the US Securities and Exchange Commission (SEC) last month, have been buying up Bitcoin at relatively high prices to add to their holdings, thus elevating the Realized Cap.

The chart below shows the data for the holdings of the spot ETFs and the Bitcoin Realized Cap.

Bitcoin ETF Holdings

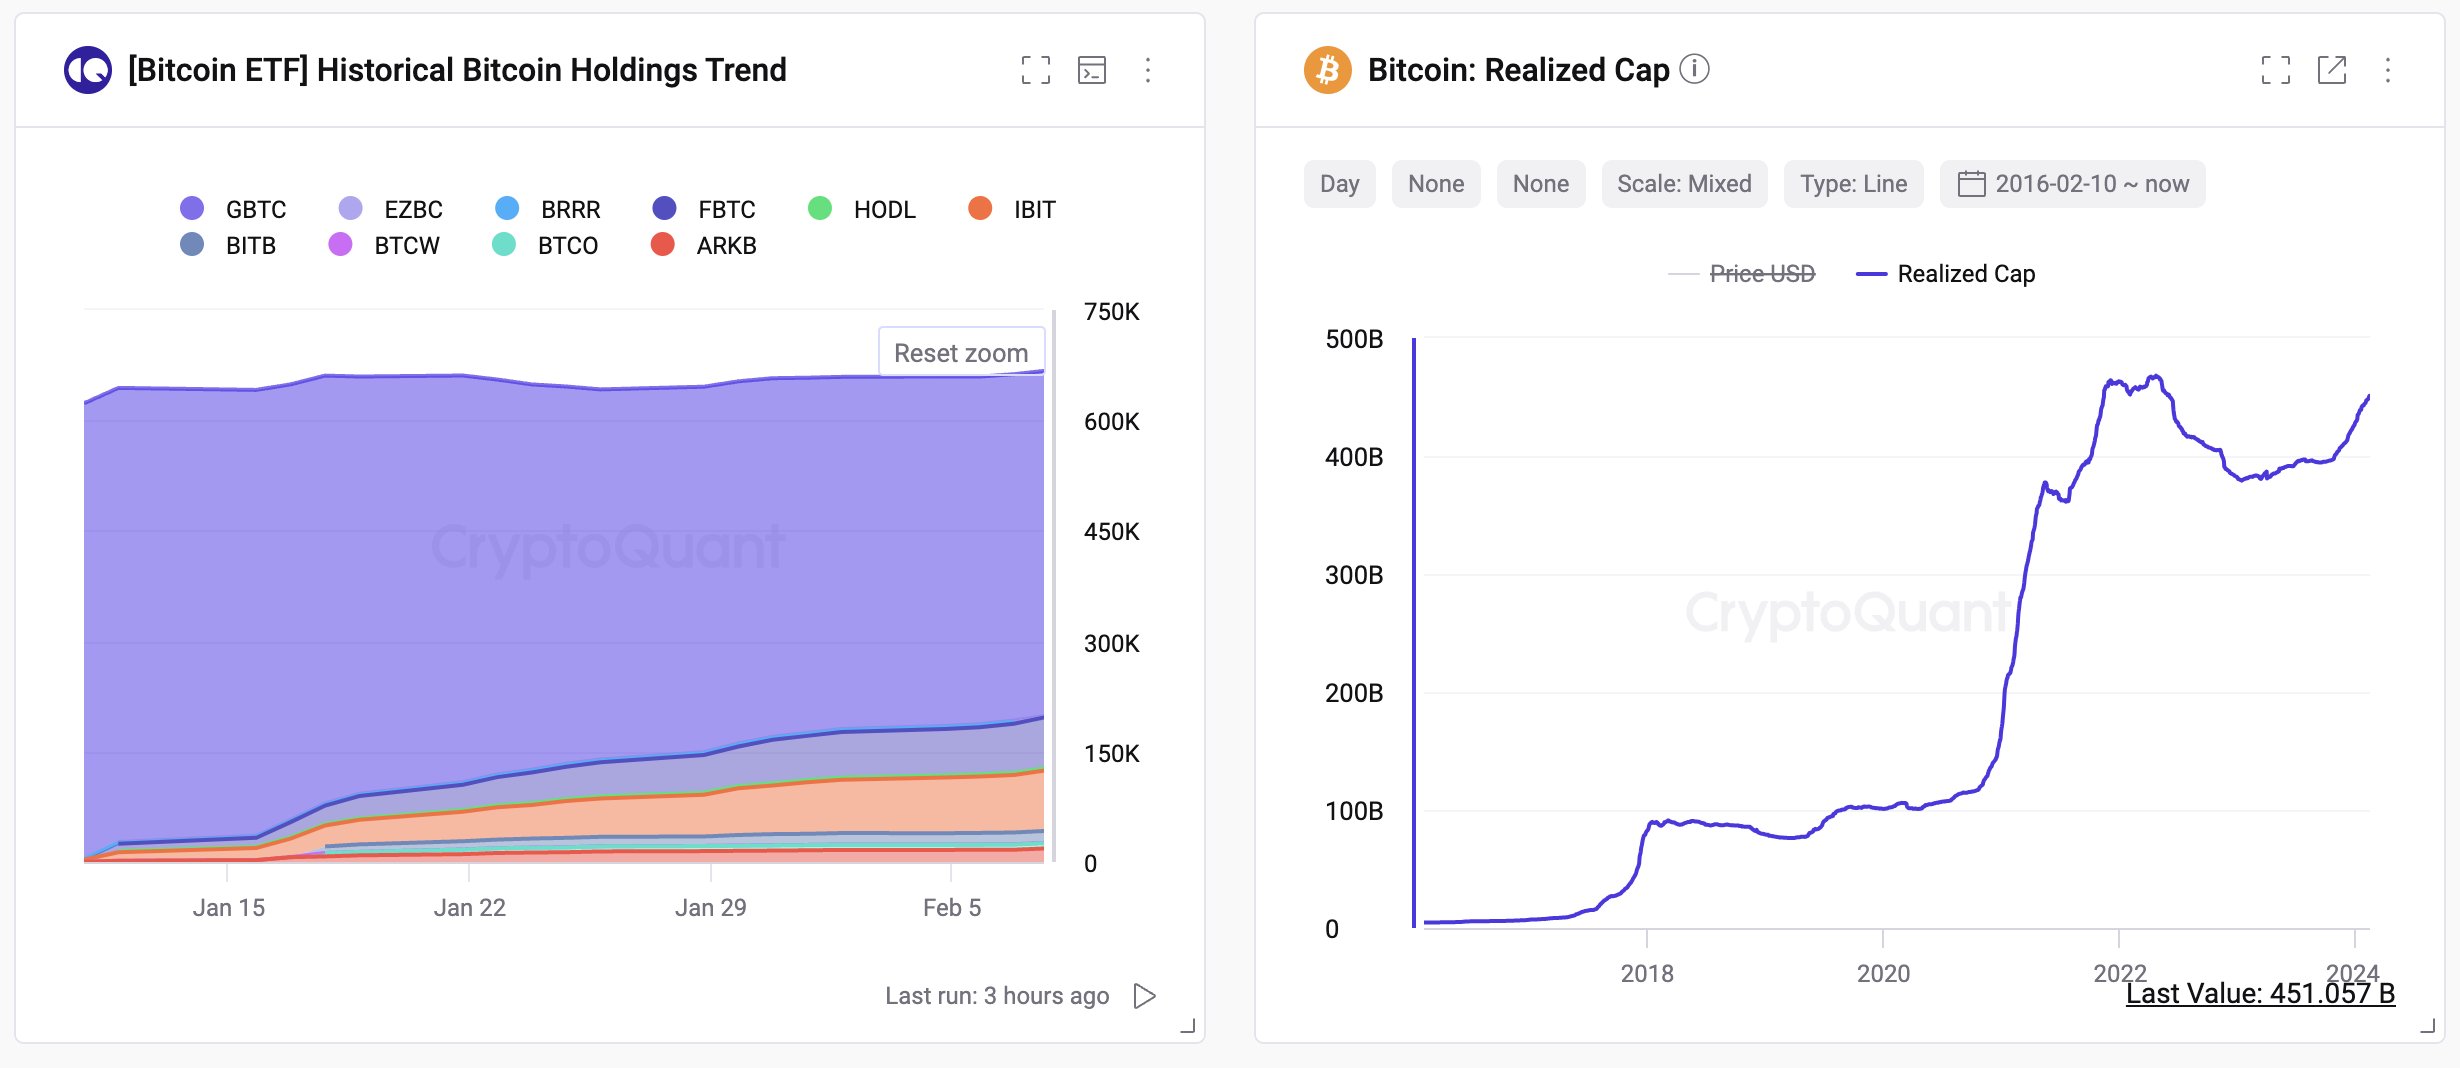
“Bitcoin market has seen $9.5B in spot ETF inflows per month, potentially boosting the realized cap by $114B yearly,” explains Ju. “Even with $GBTC outflows, a $76B rise could elevate the realized cap from $451B to $527-565B.”

The Market Value to Realized Value (MVRV) ratio may provide some hints regarding how the Realized Cap could be relevant for the spot price. This indicator tracks the BTC Market Cap and the Realized Cap ratio.

“Historically, BTC market bottoms occur at an MVRV of 0.75 and tops at 3.9,” notes the CryptoQuant founder. Based on this fact, the table below shows that ceiling and floor prices can be defined for the asset.

Bitcoin Target

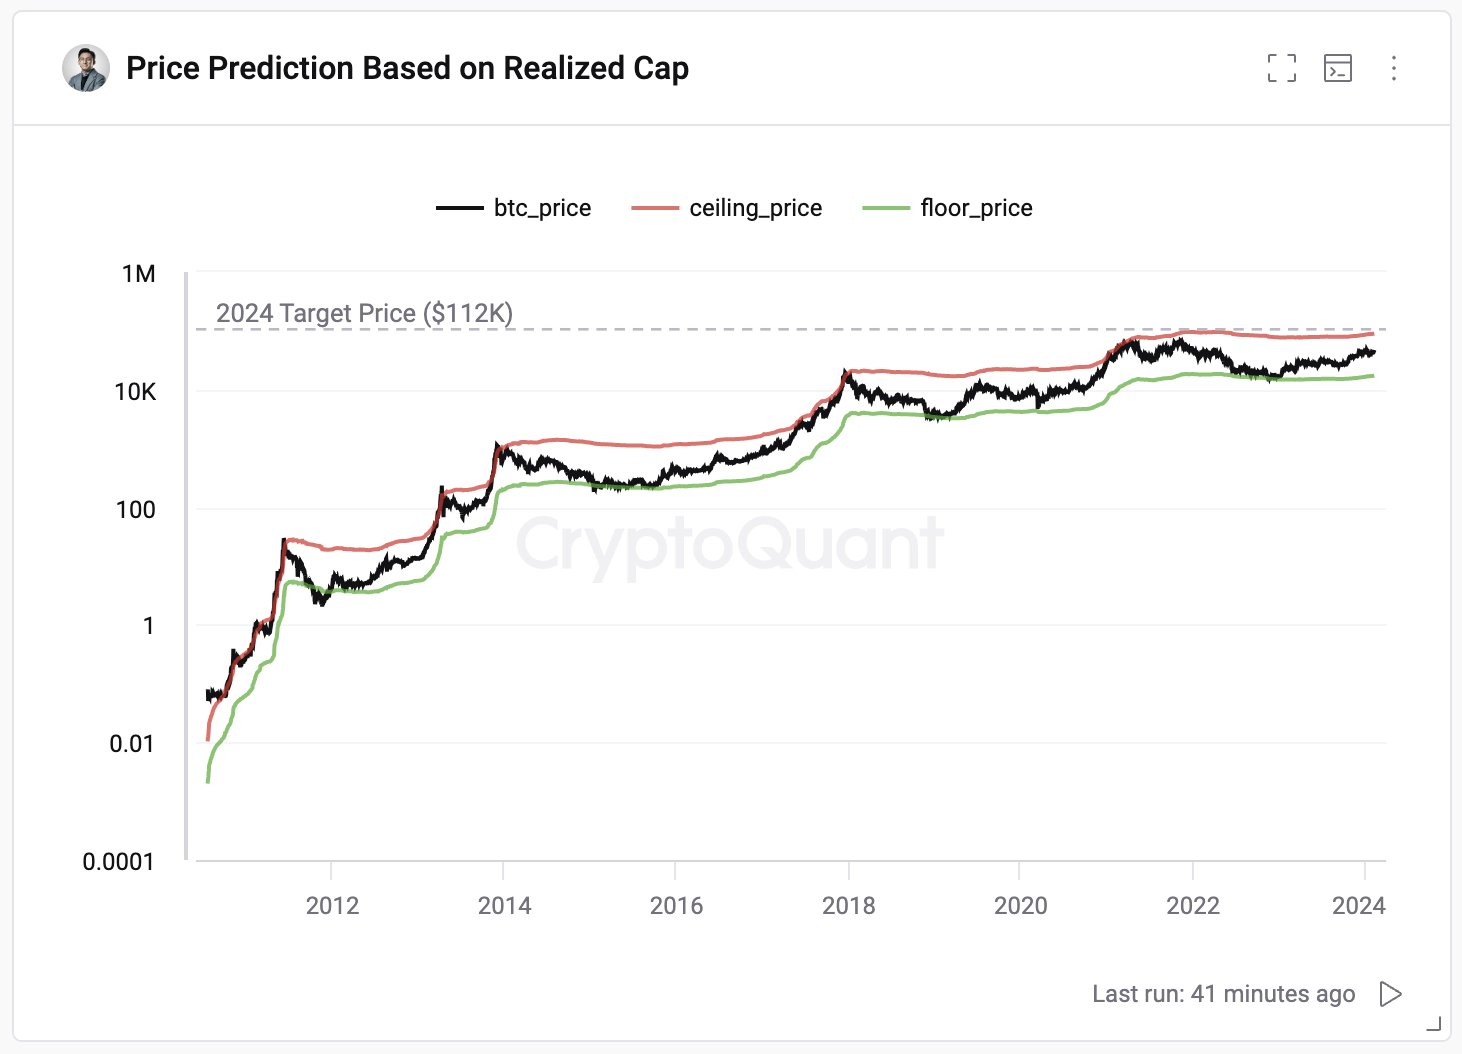
As the spot ETF inflows continue to come in, the Realized Cap will only push further up, and the potential ceiling of the cryptocurrency will also thus increase.

Bitcoin Realized Cap

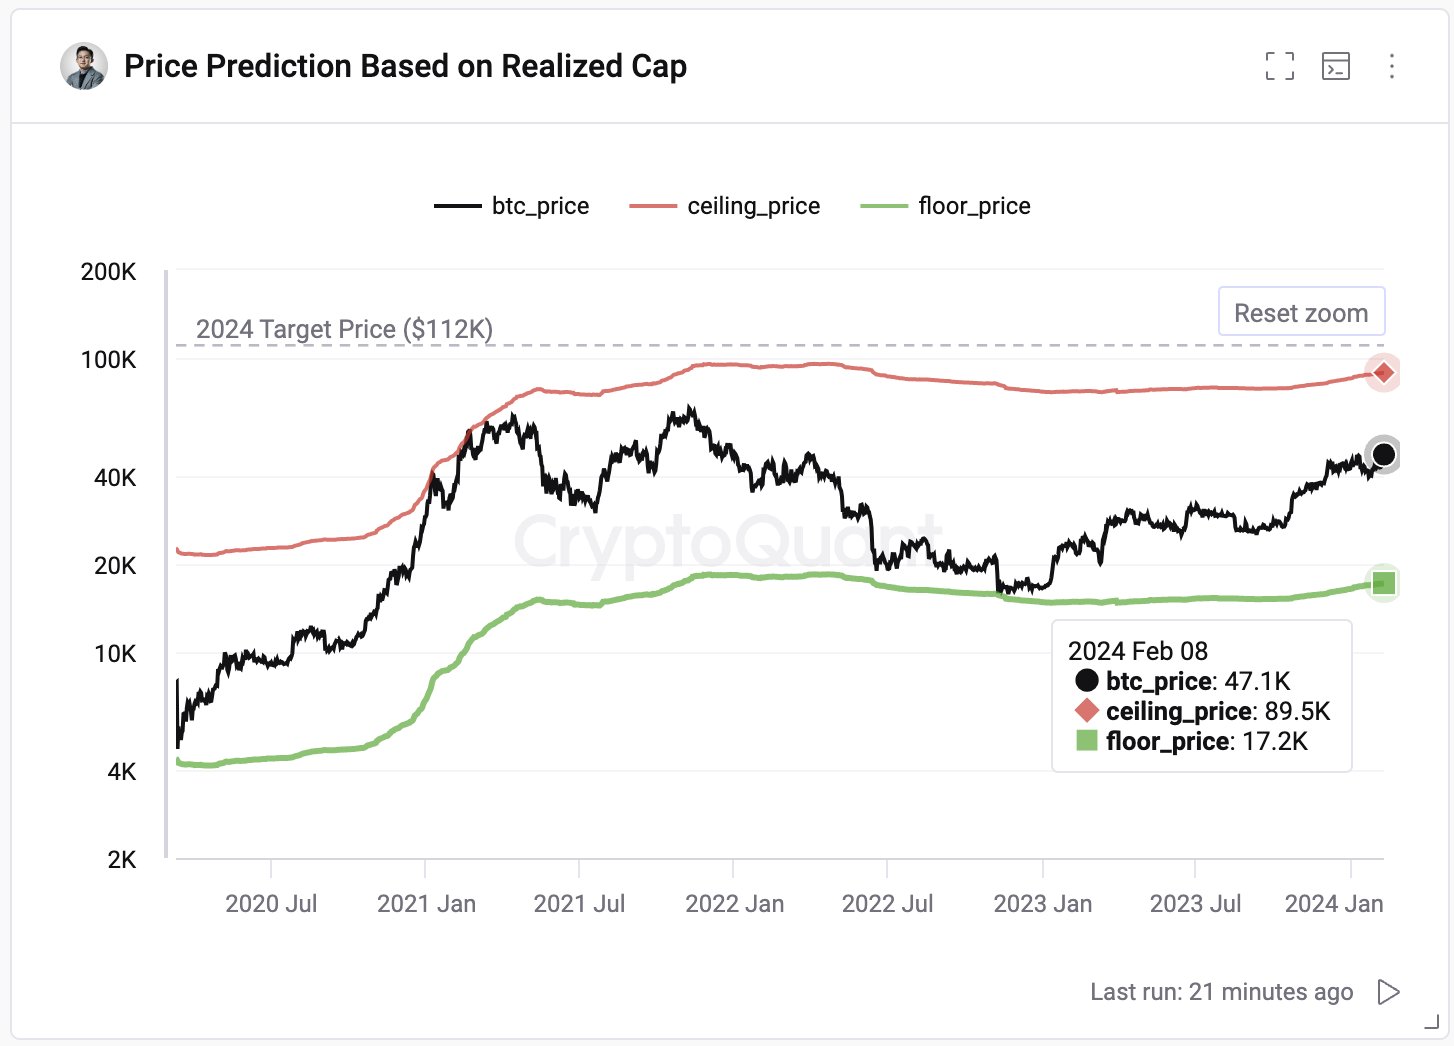
“With current spot ETF inflow trends, the top price could reach $104k-$112k,” says the CryptoQuant CEO. “Without hype, maintaining the current level of 2.07, the price would be $55-59k.”

In the best-case scenario, if Bitcoin had reached the $112,000 target, the cryptocurrency would have jumped more than 126% from the current spot price.

BTC Price

At the time of writing, Bitcoin is trading at around $49,400, up over 15% in the past week.

Bitcoin Price Chart

How Low Can Bitcoin Go? CryptoQuant Head Reveals Target

In the midst of Bitcoin’s recent price struggle, CryptoQuant head of research has revealed the level Bitcoin can potentially sink down to.

Bitcoin Might Go Down To As Low As Realized Price Of 1 To 3 Months Old Hands

In a new post on X, CryptoQuant Head of Research Julio Moreno has discussed how low the BTC price can go following the latest correction. “To evaluate this I like to look at the realized price of 1 to 3 month-old holders,” explains Moreno.

The “realized price” refers to an indicator that basically tells us about the average price at which investors in the Bitcoin market acquired their coins. This metric uses on-chain data to find the cost basis of holders, by assuming that the last transfer of any coin in circulation was when the coin changed hands.

When the spot price of the cryptocurrency is above the realized price, it means that the investors as a whole are carrying some unrealized gains currently. On the other hand, the price being lower than the metric suggests the overall market is underwater.

Naturally, when the realized price and spot price are exactly equal, the average investor in the sector could be assumed to be just breaking even on their investment.

In the context of the current topic, Moreno hasn’t applied the realized price to the entire user base but rather to just a segment of the investors: the 1-to 3-month-old holders.

The below chart shows the trend in the Bitcoin realized price for this particular holder group over the last year:

Bitcoin Short-Term Holder Realized Price

The 1 to 3 months old investors make up a part of the wider “short-term holder” (STH) cohort. The STHs are defined as investors who bought their coins within the last 155 days.

Thus, the holders who bought between 1 and 3 months ago would be on the younger side of this group. Generally, the STHs behave in a fickle manner, reacting to any significant changes in the market, like a rally or crash.

The more mature a holder’s coins become, the less likely the investor turns to show any such reaction. Since the 1 to 3-month-old hands, although not the youngest, are still young STHs, they are likely to react to price changes.

According to Moreno, the realized price of these STHs has “represented a support level historically and during 2023.” The reason behind the level being supported is likely the fact that these investors would closely watch their average cost basis and move to buy more when the price dips around there if the general mood around the market is bullish.

In times when the prevailing Bitcoin trend is bearish, the level can act as resistance instead, as these STHs would be willing to exit the market at their break-even point.

At present, the realized price of the 1 to 3-month-old STHs is $36,700. Given the historical pattern, it’s possible Bitcoin might dip to around there before finding support, if the current correction continues for long.

BTC Price

Since the asset’s price plunged under the $45,000 level a few days back, the Bitcoin price has been trading sideways around the $42,500 level.

Bitcoin Price Chart