Bitcoin Throne Shaken? XRP And Emerging Tokens Steal The Spotlight

According to a recent Bloomberg report, the crypto market is experiencing a significant rally, with speculative demand expanding beyond the revival of Bitcoin (BTC). 

In November, gauges tracking the performance of the bottom half and mid-tier tokens in MarketVector’s index of the largest 100 digital assets surged by 16% and 14%, respectively. This surpasses the broader market’s 4% gain and Bitcoin’s modest 1% rise.

As a result, BTC’s dominance in the $1.38 trillion crypto market has decreased to around 49%, down from its peak of 51.5% in October, as per CoinGecko data. This decline is often perceived as a sign of growing risk appetite among digital asset investors.

Optimism Spreads Beyond Bitcoin

Richard Galvin, co-founder at Digital Asset Capital Management, noted that this rally is “more extensive and sustained” than any price action seen since January. Galvin mentioned to Bloomberg that in an environment still “relatively thin” in terms of liquidity, substantial upward movements are being witnessed.

Bitcoin experienced a notable 28% surge last month, the largest since January, driven by expectations of the first US Bitcoin spot exchange-traded funds (ETFs) securing approval for direct investment in the token. 

Per the report, the general sense of optimism has extended beyond Bitcoin, fueled by speculations that the Federal Reserve (Fed) has concluded its interest-rate hikes. Furthermore, according to Bloomberg, the crypto rally is spreading to other areas, such as decentralized finance (DeFi), encompassing blockchain projects facilitating peer-to-peer transactions. 

Interest rates to borrow stablecoins on major DeFi lender Aave have exceeded 10%, indicating investors’ willingness to pay higher costs to fund trading positions.

XRP Strength Shines Amid Ripple’s Legal Battle

Among “smaller tokens,” XRP demonstrated strength in November by recording a 14% increase. This surge can be attributed to Ripple’s recent partial legal victory over the Securities and Exchange Commission (SEC). The lawsuit raised questions regarding whether XRP should be classified as a security falling under the regulatory purview of the SEC.

As a result, XRP is currently trading at $0.6699, experiencing a notable decline of over 5% in the past 24 hours after failing to consolidate above current levels. Nonetheless, the token has generated significant profits, evidenced by its 11.4% surge over the past seven days.

Moreover, speculation regarding a potential settlement of the SEC lawsuit has been fueled by an upcoming November 9 deadline for a briefing schedule on remedies for pending issues in the case.

While Bitcoin has experienced a significant rebound this year, with a 111% increase following the crypto rout in 2022, it is currently trading at 34,800, consolidating above this key level with sideways price action and a slight surge in the past seven days of 1%.

Bitcoin

Overall, the crypto market is experiencing a broader rally beyond Bitcoin, with its peers gaining momentum and decentralized finance gaining traction.

Positive developments for Ripple have contributed to the surge in XRP, while Bitcoin’s rebound and growing investor sentiment indicate a potential shift in the overall market dynamics.

Featured image from Shutterstock, chart from TradingView.com
Analyst Raises Red Flag On Bitcoin Rally, Predicts Imminent Retreat After 35% Spike

As Bitcoin (BTC) continues to consolidate above the $34,000 mark, aiming to surpass and reclaim its yearly high, theories suggest that a retracement may follow the current upward spike in the coming weeks. 

On this matter, the renowned crypto analyst known by the pseudonym “Crypto Soulz” recently shared insights on the potential short-term retracement for Bitcoin in a recent post on X (formerly Twitter).

BTC’s Local Top At $36,000 Signals Potential Reversal

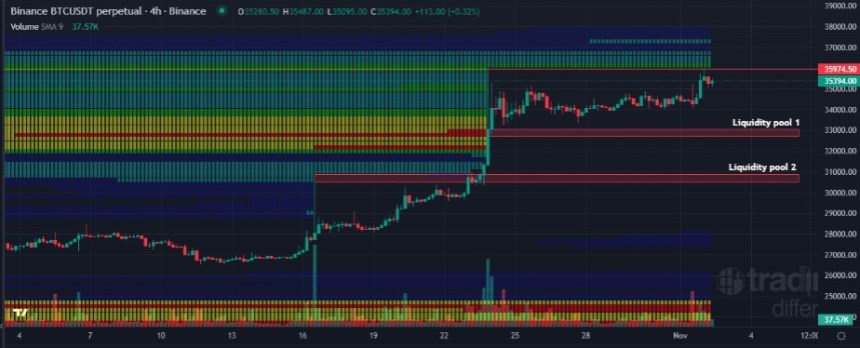
According to Crypto Soulz, a key resistance level for Bitcoin is identified at $37,370. The analyst suggests that this resistance level will not likely be retested from the current position. 

Additionally, Soulz highlights that liquidity has been absorbed around $36,000, which he considers a “trigger” for taking short positions.

The analyst points out that the local top for BTC was observed at $36,000, where a long wick was formed, followed by a retracement. This price action is seen as a potential indication of a reversal.

Moreover, Crypto Soulz emphasizes using on-chain data as a confluence for BTC positions. Soulz highlights that the spot market showed an uptrend before the perpetual futures contracts followed suit. 

The spot order book (OB) is stated to be increasing but expected to decrease, along with the perpetual market. If $36,000 indeed serves as a local top, the analyst suggests that both spot and perpetual should subsequently decrease.

Furthermore, Soulz highlighted that BTC successfully broke through key technical indicators, such as the 200-day simple moving average (SMA), the 200-week SMA, and the 365-day SMA, which is currently acting as support. 

Bitcoin

Ultimately, Soulz further states that there is no substantial liquidity available above $38,000. The analyst identifies two liquidity pools, as seen in the chart above: the first at $33,000, which he considers its initial target, and the second at $31,000, where a slight bounce may occur.

Bitcoin Potential As Store Of Value

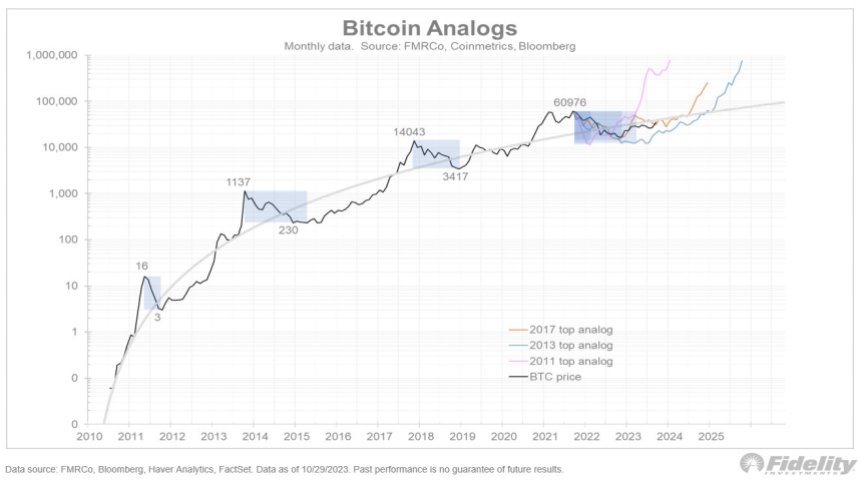
In another development, Jurrien Timmer, Fidelity’s Director of Global Macro, delved into the characteristics of Bitcoin and its potential to serve as a store of value and hedge against monetary debasement.

Drawing parallels to gold, Timmer highlighted Bitcoin’s “unique attributes” and its ability to potentially gain market share in times of inflation and excessive money supply growth.

Timmer acknowledged that Bitcoin had followed a pattern of “boom-bust cycles,” much like its previous market behavior. However, he also emphasized Bitcoin’s evolving role as a commodity currency that aspires to be a store of value. 

Bitcoin

Furthermore, Timmer described Bitcoin as “exponential gold,” suggesting that it shares similarities with gold but with additional growth potential.

While gold has traditionally been recognized as a store of value, Timmer noted its limitations as a medium of exchange due to its deflationary nature and lack of efficiency. 

Timmer drew attention to historical periods, such as the 1970s and 2000s, when gold exhibited strength and gained market share. These periods coincided with structural regimes marked by high inflation, negative real rates, and excessive money supply growth. 

Timmer hinted that Bitcoin, with its potential to serve as a hedge against inflation and debasement, could play a similar role in such environments.

Considering Bitcoin’s attributes and the changing macroeconomic landscape, Timmer expressed optimism about its potential to join the ranks of gold as a valuable asset. 

While acknowledging the volatility and speculative nature of cryptocurrencies, Timmer believes that Bitcoin’s unique characteristics position it as a viable contender in the store of value space.

Bitcoin

Currently, BTC is trading at $34,700, reflecting a 1.5% increase over the past 24 hours as it persists in reaching the $35,000 mark.

Featured image from Shutterstock, chart from TradingView.com 
Bitcoin Price Surge: Matrixport Forecasts $125,000 Price Target By December 2024

Bitcoin price (BTC) is currently displaying a significant uptrend, showing no signs of slowing down. The cryptocurrency has already begun its fifth bull run, with impressive price targets anticipated in the coming year. 

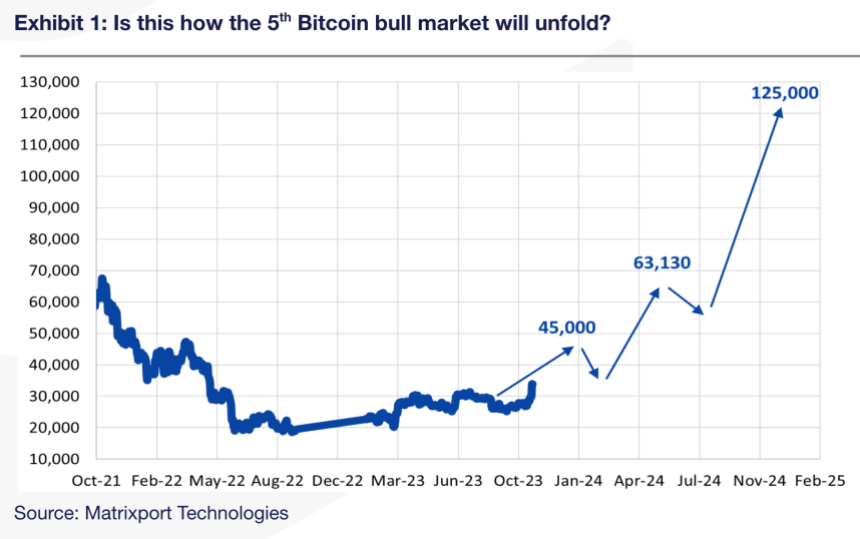
A recent report from Matrixport highlights BTC’s history of four distinct bull market cycles, each driven by a unique narrative. However, the latest bull market, which started on June 22, 2023, stands out due to its primary driving force: institutional adoption

Per the report, this surge in institutional interest can be attributed to Bitcoin’s characteristics, traditionally associated with safe-haven investments like Gold, as well as mounting concerns over the United States debt-to-GDP ratio. Matrixport’s report predicts that Bitcoin’s price could reach an impressive $125,000 by December 2024.

Bitcoin Price Rise Aligns With Mounting US Debt

Matrixport suggests its emergence as a new payment mechanism propelled the first Bitcoin bull market in 2011. The second cycle was driven by China, where Bitcoin gained recognition as an alternative form of money. 

The rise of initial coin offerings (ICOs) marked the third cycle, providing a novel means of establishing and funding companies. The fourth cycle saw the decentralized finance (DeFi) summer and the NFT craze dominating the market.

However, per the report, Bitcoin’s current bull market is driven by institutional adoption. Institutions are considering Bitcoin for diversifying their asset allocation due to its characteristics akin to safe-haven investments

Notably, the surge in Bitcoin’s value coincides with the United States’ escalating debt-to-GDP ratio, making it an attractive choice for institutions seeking to hedge against potential economic instability.

Based on historical price signals, Matrixport estimated that Bitcoin price could reach $125,000 by December 2024. 

Bitcoin Price

Interestingly, the report suggests that the onset of this bull market was officially recognized when BTC reached a new one-year high on June 22, 2023. 

Furthermore, Matrixport advises that the optimal entry point to buy Bitcoin is ideally 14-16 months before the next halving event. The report suggested that the end of October 2022 was an opportune time to enter the market when Bitcoin traded at $17,000.

Potential BTC Correction On The Horizon?

Despite the hype surrounding the current uptrend experienced by most cryptocurrencies on the market, crypto analyst “Crypto Soulz” presents a contrasting view on the future of Bitcoin price.

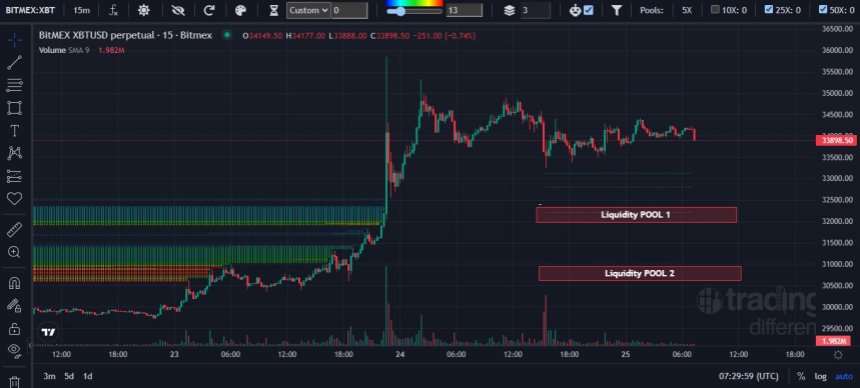
In a recent analysis of X (formerly Twitter), the analyst provides several reasons for considering a short position on BTC. According to Crypto Soulz, the next significant resistance level is at $37,330, but Soulz doubts the possibility of retesting it in the current market conditions. 

Bitcoin recently reached a local top at $35,300, leading Crypto Soulz to believe a price decline may follow. The analyst emphasizes retesting the $31,500 level as crucial support, which Bitcoin did not revisit during the recent price surge. 

Crypto Soulz notes that spot and perpetual contracts rose during the pump, indicating potential market instability. Additionally, the futures market experienced significant liquidations during the rally, similar to previous wipe-outs in January and August.

Bitcoin Price

Upon examining the liquidation heatmap, Crypto Soulz identifies liquidity below the current price, implying a potential downward movement. Soulz targets specific liquidity pools at $32,300 and $30,800 as potential areas for the price decline. 

Based on its analysis, Crypto Soulz expects Bitcoin to “cool off” from its current levels and target lower prices. 

Bitcoin Price

At the time of writing, the price of Bitcoin is currently at $34,000, experiencing a 2.5% retracement in the past 24 hours.

Featured image from Shutterstock, chart from TradingView.com 
Bitcoin Bullish Momentum Reignites: RSI Signals Potential Surge To $65,000

After experiencing a brief correction from its new yearly high of $35,300, Bitcoin (BTC), the leading cryptocurrency in the market, is showing signs of renewed bullish momentum. 

As the digital asset approaches the $35,000 mark again, a key indicator is following patterns observed in 2020, suggesting a potential surge that could propel Bitcoin to reclaim its previous peak of $65,000. 

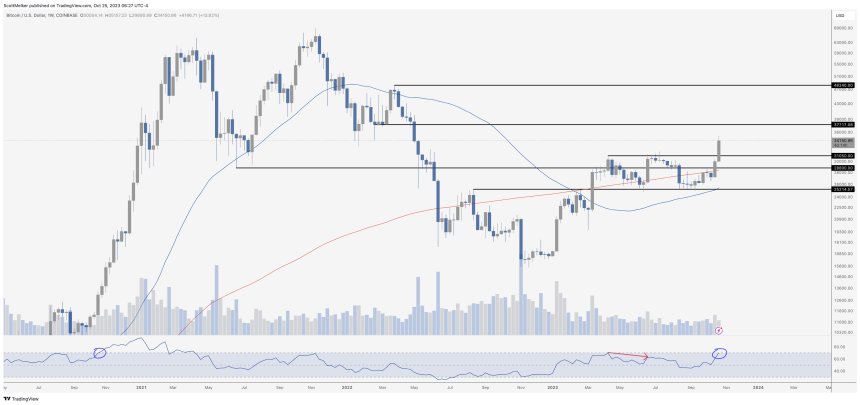
Scott Melker, a prominent crypto investor and host of the ‘Wolf of All Streets’ podcast, notes the significance of Bitcoin’s overbought Relative Strength Index (RSI) on both lower time frames and the weekly chart, hinting at a promising trajectory for the cryptocurrency’s price.

BTC’s 2020 RSI Flashback

Bitcoin’s RSI, a widely used technical indicator that measures the strength and speed of price movements, is currently flashing signs of extreme overbought conditions on various lower time frames. 

Notably, the daily RSI stands at 88, indicating a potential need for a healthy retracement. However, the weekly RSI garners attention as it has just entered the overbought zone, a range historically associated with substantial upward movements in a true bull market.

To gain insights into Bitcoin’s potential future trajectory, it is worth revisiting the patterns observed in 2020. 

Bitcoin

According to Melker, during that year, Bitcoin’s RSI went overbought on the weekly chart when the cryptocurrency was trading around $12,000, as indicated by a small blue circle on the bottom left of the chart above. 

Subsequently, Bitcoin embarked on an unprecedented rally, surging to $65,000. This historical precedent highlights the possibility of a similar price action if true bullish catalysts emerge.

With Bitcoin’s weekly RSI entering the overbought territory once again, there is a growing sentiment among market observers that the cryptocurrency has ample room to run. 

Scott Melker emphasizes that if significant bullish catalysts materialize, Bitcoin’s potential for further upside becomes virtually limitless. The current RSI readings hint at the potential for an extended price rally, potentially enabling Bitcoin to surpass its current highs and reach the coveted $65,000 level.

Bitcoin Market Dynamics Shift As Key Indicators Surge

Adding to Melker’s bullish outlook for BTC, crypto analyst Miles Deutscher has stated on X (formerly Twitter) that the Bitcoin market landscape has witnessed a notable shift in recent days, leading to a significant uptick in bullish sentiment. 

In particular, volume and open interest in Bitcoin-related futures and options on the Chicago Mercantile Exchange (CME) have risen to multi-month and multi-year highs, indicating growing interest and participation from institutional investors.

Moreover, call options open interest has surpassed the peak levels seen during the 2021 bull run. In tandem with these developments, average crypto-related stocks have experienced a substantial uptick, and public funds have seen a massive influx of $43 million into Bitcoin, equivalent to 10% of the year-to-date inflows, all within a single day.

These metrics reflect increased trading activity and liquidity in the Bitcoin derivatives market, indicating heightened institutional interest. Such a surge in trading volume often precedes significant price movements, leading some analysts to anticipate a potential bullish breakout shortly.

Another encouraging sign for Bitcoin’s prospects lies in the call options open interest, which has recently surpassed $10 billion. To put this into context, during the peak of the 2021 bull run, call options open interest reached $9.9 billion. 

This milestone suggests that market participants are increasingly positioning themselves for a potential rise in Bitcoin’s price. The growing number of call options indicates a bullish sentiment among traders, further fueling expectations of a potential price surge.

Bitcoin

As of the time of writing, Bitcoin is trading at $34,500, successfully reclaiming the level it briefly lost during a recent correction on Tuesday. Over the past 24 hours, Bitcoin has maintained gains of 1.4%.

Featured image from Shutterstock, chart from TradingView.com 
Time To Cash Out? Bitcoin’s 4-Hour RSI Triggers Sell Indicator

Bitcoin (BTC) has retraced to the $28,400 level following a failed breakout above $30,000, resulting in a high rate of liquidations for both long and short positions. 

Additionally, the recent fake news surrounding the approval of Blackrock’s spot Bitcoin Exchange-Traded Fund (ETF) by the US Securities and Exchange Commission has disrupted the upward trend and introduced new bearish indicators in the Bitcoin market.

RSI Screams Sell

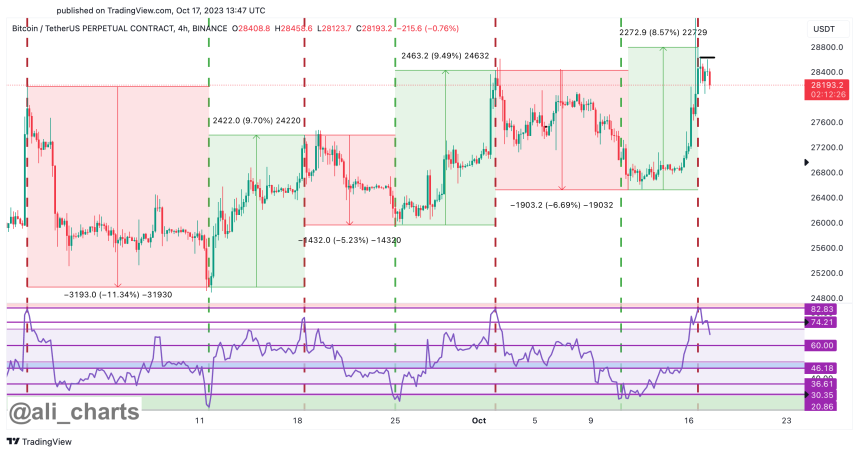
Renowned trader and crypto analyst Ali Martinez suggests selling BTC based on its 4-hour chart Relative Strength Index (RSI) indicator. His simple trading strategy advises selling BTC when the RSI exceeds 74.21 and buying when the RSI dips below 30.35.

Bitcoin

As seen in the chart above, BTC’s RSI stands at the 74 level, which is notably high considering that on October 16, after the spread of the fake news on various platforms, including X (Formerly Twitter), the RSI reached as high as 82.83.

While this indicator may seem straightforward, it has proven effective on BTC’s 4-hour chart. For instance, on October 1st, Bitcoin peaked at $28,500, but after the RSI climbed above 80, the leading cryptocurrency swiftly dropped to $27,150 within hours.

Although the effectiveness of these indicators is not always guaranteed, the combination of the recent false pump, the ongoing retrace evident in all BTC charts, the lack of bullish momentum, and the prevailing market sentiment of fear, doubt, and uncertainty could create the perfect storm for BTC to retest lower support levels before potentially embarking on another upward movement.

Bitcoin Pre-Halving Retracements Sound Alarm Bells

To further support Ali Martinez’s bearish thesis, renowned crypto analyst Rekt Capital recently shed light on Bitcoin’s historical retracements approximately 180 days before halving events

According to Rekt, in 2015/2016, approximately 180 days before the halving, Bitcoin experienced a retracement of -25%. Similarly, in 2019, around the same timeframe before the halving, Bitcoin retraced by -38%. 

While Rekt Capital identifies as a macro bull, he acknowledges that historical data favors bearish trends before halving events. 

This observation raises the question of whether history will repeat itself in 2023. Will Bitcoin witness a significant retracement similar to previous cycles, or will the market dynamics 2023 deviate from historical patterns?

What is certain is that as the crypto community eagerly anticipates the 2023 halving, uncertainty looms regarding Bitcoin’s price behavior leading up to the event.

Bitcoin

As of the current market conditions, BTC is trading at $28,400, indicating a profitable position across all time frames. In the past 24 hours, Bitcoin has experienced a modest increase of 1%.

Over the seven, fourteen, and thirty-day periods, BTC has recorded profits of 3.7%, 4%, and 7%, respectively, despite the earlier bearish factors. The sustainability of Bitcoin’s current price level remains uncertain, as it remains to be seen whether it will withstand potential retracements soon.

Featured image from Shutterstock, chart from TradingView.com 
Bitcoin Bloodbath: Fake Spot ETF Approval Sparks BTC Surge, Obliterates $78M Shorts At $30,000

In a flurry of market activity, false news surrounding the approval of a Bitcoin (BTC) Spot Exchange-Traded Fund (ETF) by the US Securities and Exchange Commission (SEC) sent shockwaves through the cryptocurrency community. 

False Rumors of BTC Spot ETF Approval Trigger Volatility

Initially reported by Cointelegraph, the news claimed that BlackRock’s iShares Bitcoin Spot ETF had received regulatory approval. 

However, Bloomberg analyst James Seyffart promptly cast doubt on the report’s authenticity, stating that he could not find any confirmation of the news at the time. Seyffart stated: 

I believe this to be fake news. While this would be positive for the things we’ve been saying. I can’t find anything that would confirm this at the moment. 

Subsequently, BlackRock confirmed to FOX reporter Eleanor Terret that the application was still under review, rendering the initial report false.

The repercussions of this misinformation were immediately evident in the market. BTC experienced a brief surge from $27,800 to $30,000 within minutes as traders reacted to the purported ETF approval news. However, as the truth emerged, the market corrected itself, causing a wave of liquidations.

According to data from Glassnode, the aftermath of the surge saw a significant increase in liquidations. Within four hours, $113.75 million in long positions and $78.87 million in short positions were liquidated, reflecting the volatility and sudden reversal prompted by the false news.

The incident also prompted Cointelegraph to apologize for a post that had disseminated inaccurate information regarding the BlackRock Bitcoin ETF. 

The media outlet announced that an internal investigation is underway to determine the source of the misinformation. Cointelegraph stated:

We apologize for a tweet that led to the dissemination of inaccurate information regarding the Blackrock Bitcoin ETF. An internal investigation is currently underway. We are committed to transparency and will share the findings of the investigation with the public once it is concluded within 3 hours.

False Breakout Fails To Dampen Bitcoin Profitable Streak

Despite the false breakout above $30,000, Bitcoin has retained significant profits within 24 hours. Currently trading at $28,100, it remains $1,000 higher than the initial price before disseminating the fake news across all platforms. This marks a 5.1% profit during this period.

Consequently, this positive turn of events has caused Bitcoin to shift from negative to positive figures across various time frames. In the past 7 days, Bitcoin has recorded a 2.6% profit, while over 30 days, it has seen a 6.4% increase. Only in the 14 days was a slight decrease of 0.4%.

Bitcoin

Furthermore, a closer examination of BTC’s 1-day chart reveals its ability to surpass significant resistance levels. Notably, Bitcoin successfully overcame two critical moving averages: the 50-day MA at $27,150 and the 200-day MA at $27,030. 

These moving averages posed major obstacles for Bitcoin’s price after initially dropping below this threshold.

In addition, Bitcoin managed to break through the $28,000 resistance level, which had previously acted as a significant barrier following the false breakout above this mark.

Moving forward, the sustainability of Bitcoin’s current price level and bullish momentum remains to be seen amidst the circulating rumors surrounding the long-awaited ETF decision by the applicants and the US SEC.

Featured image from Shutterstock, chart from TradingView.com 
Bitcoin Price Rally On The Horizon? BTC Spot ETFs May Get The Green Light Today

In what could be a pivotal day for the Bitcoin price, the last day for the US Securities and Exchange Commission (SEC) to appeal the Grayscale Bitcoin (BTC) spot Exchange-Traded Funds (ETF) decision is approaching, and the crypto community is eagerly awaiting the outcome.

The implications of this decision are significant, as it could pave the way for the approval of several other spot Bitcoin ETFs

Impending Approval Of All Proposed Bitcoin Spot ETFs? 

According to crypto YouTuber Crypto Rover, if the SEC does not appeal the court’s ruling by the end of the day, it would potentially lose its ability to deny future applications, resulting in the likely approval of all proposed spot ETFs.

The current list of applicants seeking approval includes prominent names such as Grayscale Bitcoin Trust, Ark/21 Shares Bitcoin Trust, Bitwise Bitcoin ETF Trust, BlackRock Bitcoin ETF Trust, VanEck Bitcoin Trust, WisdomTree Bitcoin Trust, Valkyrie Bitcoin Fund, Invesco Galaxy Bitcoin ETF, and Fidelity Wise Origin Bitcoin Trust.

If all Bitcoin spot ETFs are approved, the move would mark a significant milestone in the mainstream adoption of cryptocurrencies. 

Accepting these financial instruments would provide investors with a regulated and easily accessible avenue to gain exposure to Bitcoin’s price movements without directly owning the underlying asset. 

The approval would also vote for confidence in the cryptocurrency market, attracting institutional investors and potentially injecting fresh capital into the space.

The approval of Bitcoin spot ETFs also can ignite a renewed sense of optimism and investor sentiment. The anticipation of such a development has already fueled speculation of a Bitcoin rally, with market participants eyeing a new annual high. 

The thawing of the crypto winter and the approval of these ETFs could create a perfect storm for a Bitcoin price to surge, potentially breaching the $30,000 mark and beyond.

Bitcoin Price Awaiting ETF Relief

The largest cryptocurrency in the market is striving to reclaim the crucial $27,000 level, trading at $26,700. This level holds significant importance for bullish investors as it represents a key threshold to break the mid-term downtrend structure observed in BTC’s 1-day chart since its yearly high of $31,800 on July 13

Bitcoin price

Additionally, the failure of the Bitcoin price to hold its 200-day (yellow line) and 50-day (brown line) moving averages (MAs) as support lines is a cause for concern among bullish traders. These MAs, similar to the situation in March 2023, are currently converging.

However, the potential approval of a BTC spot ETF could provide much-needed relief to Bitcoin’s price. Forming a complete rally would require overcoming various resistance levels in such a scenario.

In the short term, Bitcoin’s price will likely face a significant obstacle at the $27,900 level, which was briefly surpassed on October 2nd. Furthermore, BTC encounters a 3-month resistance at $28,700, marking the final hurdle before reaching the $30,000 level, serving as another resistance line.

Nevertheless, the community anxiously awaits the approval of BTC spot ETFs, hoping that it will bring a sense of relief and bullish momentum for investors and Bitcoin’s price. 

Featured image from Shutterstock, chart from TradingView.com 
Bitcoin Dominates 2023: Surges Past Stocks And Bonds With 63% YTD Growth

Bitcoin (BTC), the world’s leading cryptocurrency, continues to face challenges in reclaiming the $28,000 level amid rising US treasury yields, a stronger dollar, and geopolitical uncertainties. 

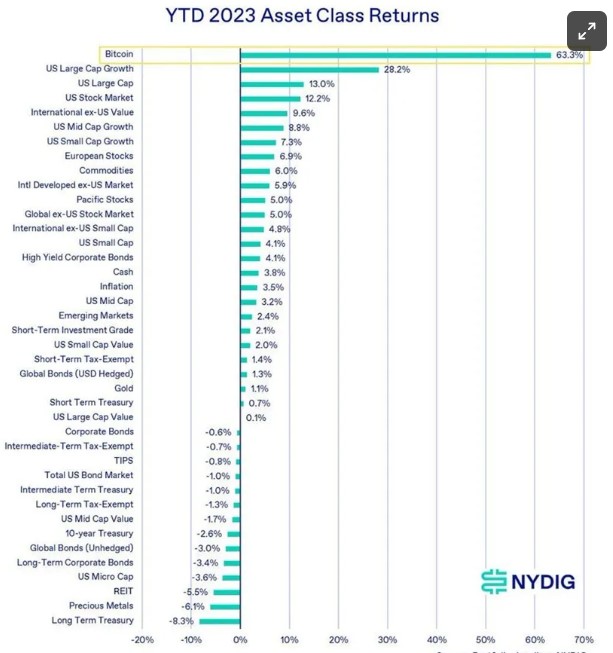
However, according to a report by the digital asset research firm Reflexivity, despite these obstacles, Bitcoin remains the standout performer among asset classes in 2023, with an impressive year-to-date (YTD) return of 63.3%. 

This exceptional performance has surpassed returns from US large-cap growth stocks (28%), US large-cap stocks (13%), bonds, commodities, and REITs, according to a report from New York-based Bitcoin investment firm NYDIG.

ETH/BTC Ratio Reflects Risk Appetite And BTC’s Strength

According to the firm’s latest analysis of the current state of the Bitcoin market, there is a notable importance in monitoring Bitcoin’s market cap dominance, which measures Bitcoin’s market capitalization as a percentage of the total crypto market capitalization.

Market participants often view this metric as a risk gauge for the broader crypto market. Just as traditional markets experience cycles, with early stages marked by capital concentration in a select few high-quality assets that gradually disperse into riskier assets, the crypto market follows a similar pattern

The cycle commences with capital concentrated in Bitcoin, then dispersion into Ethereum (ETH) and eventually other altcoins. The cycle concludes with capital flooding into high-risk assets, as witnessed in the memecoin frenzy of 2021.

Bitcoin

The report’s chart illustrates the rising dominance of Bitcoin, indicating a healthy concentration of capital into the leading asset. Bitcoin’s sustained dominance suggests that the crypto market is stable, with significant capital still flowing into Bitcoin. 

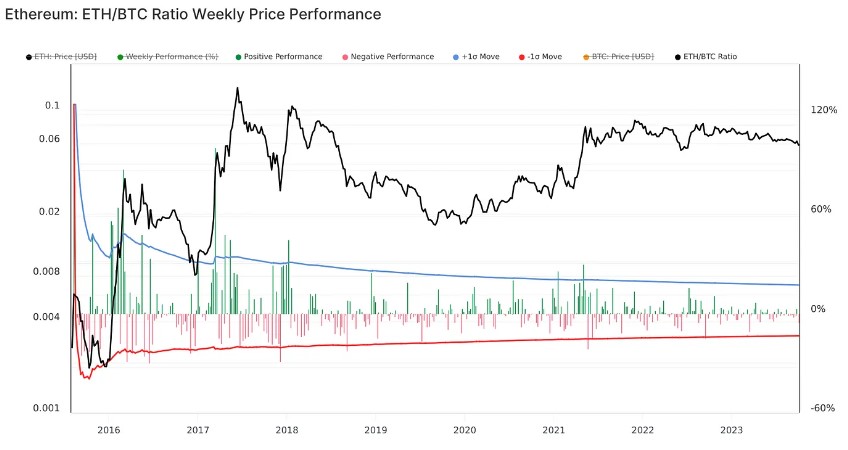
Alongside monitoring Bitcoin dominance, another key indicator of risk-taking behavior in the crypto market is the ETH/BTC ratio, which compares Bitcoin’s performance to Ethereum, the second-largest cryptocurrency by market capitalization. 

Bitcoin

The chart demonstrates a downward trend in the ETH/BTC ratio since the Merge in September 2022, which, according to the report, both Bitcoin dominance and the ETH/BTC ratio will be crucial to watch for any potential shift from a Bitcoin-dominated market regime into higher-risk assets. 

Bitcoin Eyes Bullish Momentum

After a two-month consolidation period between the $26,000 and $27,000 range, BTC finally experienced a surge of bullish momentum, breaking the pattern and climbing to the upside. 

However, the cryptocurrency’s upward trajectory was halted as it encountered a formidable resistance wall in the mid-term, reaching $28,600 on October 2nd and facing a significant hurdle at $28,700. 

This resistance level poses one of the final challenges preventing BTC from revisiting the $30,000 mark, last seen in August.

Despite the setback, Bitcoin currently trades above its crucial 50-day and 200-day moving averages (MAs), indicating the potential for another attempt to breach previously lost levels. 

Market analysts and enthusiasts are closely watching the $27,700 mark, as a successful break could signal the formation of a perfect ‘W’ pattern, with a target set at $28,100. 

On this matter, renowned crypto YouTuber and founder of Crypto Sea, known as ‘Crypto Rover,’ highlights the significance of the $27,700 level as a potential catalyst for Bitcoin’s next move. 

According to the analyst’s latest post on X (formerly Twitter), a successful breakthrough could reignite bullish sentiment and pave the way for a push toward the $28,100 target.

Bitcoin

BTC is trading at $27,300, experiencing a modest decline of 0.6% over the past 24 hours. However, the cryptocurrency has recorded notable gains of 4.4% and 6% over fourteen and thirty days, respectively.

Featured image from Shutterstock, chart from TradingView.com 
Bitcoin And XRP Set To Shine: Shock $8 Trillion Predicted Amid US Dollar ‘Collapse’

Despite initial expectations of a robust rally, major cryptocurrencies Bitcoin (BTC), Ethereum (ETH), and XRP have encountered a slowdown in momentum following a promising start in 2023. However, a prominent tech company’s leaked disclosure can alter this trajectory.

With the Federal Reserve (Fed) grappling with a staggering $33 trillion US “debt death spiral,” investment banking firm Jefferies analysts have warned that the Fed may be compelled to restart its money printing presses. 

This move could trigger the collapse of the US dollar and ignite a significant price boom for Bitcoin, rivaling the value of gold.

Expert Advocates For Bitcoin As An Inflationary Safeguard

A recent Forbes report indicates that Bitcoin’s highly anticipated halving event, expected to cause price volatility, is imminent. 

Christopher Wood, Jefferies’ global head of equity strategy, emphasized in a note to clients seen by CNBC that G7 central banks, including the Federal Reserve, are unlikely to withdraw from unconventional monetary policies smoothly. Notably, Wood considers Bitcoin and gold as “critical hedges” against the resurgence of inflation.

Since spring of 2022, the Federal Reserve embarked on reducing its ballooning balance sheet of nearly $9 trillion, which expanded significantly during the COVID-19 pandemic and subsequent economic downturn. 

This process, known as quantitative tightening, involves draining liquidity from the financial system and shifting the burden of newly issued debt onto the private sector.

US Dollar Caught In ‘Death Spiral’ 

In addition to balance sheet reductions, the Fed has implemented rapid interest rate hikes to rein in soaring inflation. However, this approach has raised concerns about a potential counterproductive “death spiral” for the US dollar, potentially bolstering the value of Bitcoin. 

Wood suggests that the Fed may be forced to adopt a more accommodating stance in response to a US recession. This shift would occur due to a larger-than-usual lag in the Fed’s interest rate hikes aimed at curbing inflation following the significant expansion of the money supply in 2020 and 2021. 

Wood further explains: 

Such a failure to exit from unorthodox monetary policy in a benign manner is likely to culminate in the collapse of the US dollar paper standard to the benefit of both gold bullion owners and also owners of Bitcoin. Meanwhile, Bitcoin, along with Ethereum and XRP to a lesser extent, has witnessed a surge in institutional interest, driven by the world’s largest asset manager, BlackRock. 

The CEO of BlackRock, Larry Fink, who had previously expressed skepticism towards Bitcoin, made a notable shift in June. Fink’s endorsement of Bitcoin sparked a rush among Wall Street investors toward cryptocurrencies. 

With custodian arrangements in place for digital assets, Bitcoin has gained credibility as an investable option for institutional investors, presenting itself as an alternative store of value to gold. 

In conclusion, the Federal Reserve’s monetary policy challenges and the growing institutional interest in Bitcoin and other major cryptocurrencies have created a perfect storm, propelling their prices to new heights. 

Per the report, investors increasingly turn to digital currencies as potential hedges against inflation and storehouses of value as the US dollar faces uncertainty.

Bitcoin

When writing, the leading cryptocurrency in the market is trading at $27,300, reflecting a decrease of over 2% in the past 24 hours. This decline follows an overall downtrend in the market since the beginning of the new trading week.

Notwithstanding the recent drop, BTC is positioned above its critical 50-day and 200-day Moving Averages (MAs). This favorable positioning may support a rebound in the cryptocurrency’s value and prevent further decline, helping it maintain the crucial $27,000 milestone.

Featured image from Shutterstock, chart from TradingView.com 
Bitcoin Price Projection Soars: BTC-Gold Ratio Indicator Proposes $120,000 Price Target

Over the past week, Bitcoin price has displayed a notable bullish momentum. This comes after a prolonged consolidation phase during which the leading cryptocurrency remained stagnant below the $27,000 mark for an entire month.

However, with the recent breakout and the resurgence of bullish sentiment in the market, experts are now predicting a potential surge that could propel Bitcoin’s price above $30,000.

Bitcoin Price Bullish Momentum Continues

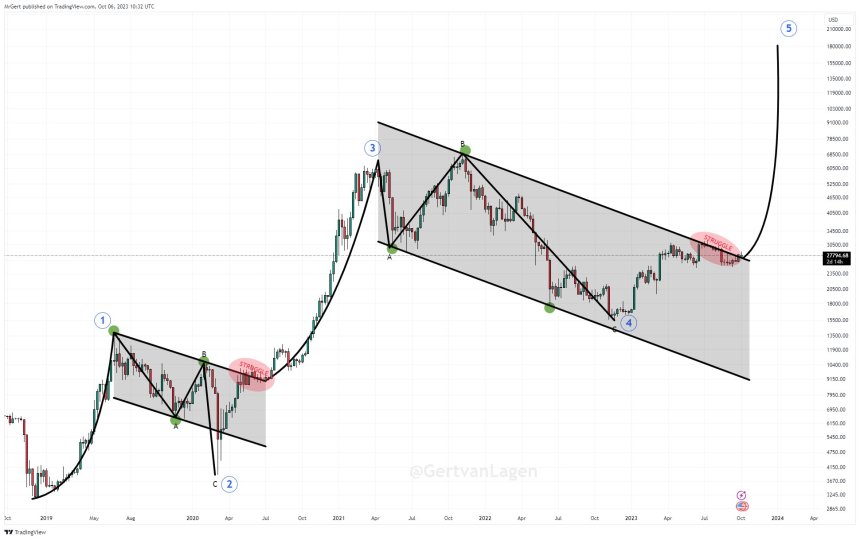
Technical analyst Gert Van Lagen highlights a significant breakout from a long-term descending channel, signifying the end of a corrective wave and paving the way for a parabolic surge in Wave 5. 

Gert Van Lagen emphasizes the monumental breakout of a 2.25-year descending channel, marking the end of an expanded flat corrective wave 4. 

Bitcoin price

The channel, determined by the green dots, has contained the ABC correction of wave 4. With wave five on the horizon, breaking 10% above the channel, around $30,000, is expected to trigger a parabolic surge. 

Notably, Gert believes that wave 5, a “blow-off wave,” may exhibit steep growth, with the final impulse indicating a significant upward movement.

While the potential for further upside gains is promising, remaining aware of key considerations and potential invalidation points is crucial. In this context, paying attention to $13,800 would be essential, as the invalidation point lies when wave four falls below wave 1. 

Bitcoin-Gold Ratio Indicator

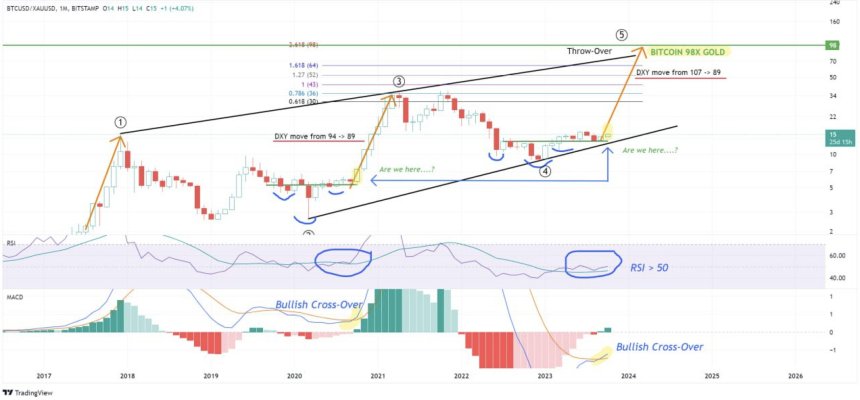
Prominent figures in the crypto analytics industry, the co-founders of Glassnode, have expressed their belief in Bitcoin’s potential to reach six figures. Drawing attention to the BTC-Gold ratio, they suggest that Bitcoin could rise to approximately 98 times the price of Gold. 

The BTC-Gold ratio serves as a critical metric for understanding the relative performance and value of Bitcoin compared to Gold. Analyzing this ratio, the Glassnode analysts note several positive indicators suggesting a Bitcoin price surge. 

Bitcoin price

The rising RSI (Relative Strength Index) and its position above 50 indicate increasing buying pressure and positive momentum. Additionally, the bullish MACD (Moving Average Convergence Divergence) crossover and a rising trend reinforce the bullish sentiment surrounding Bitcoin.

Using Fibonacci extensions provides further insight into potential price levels for Bitcoin. These extensions, derived from mathematical ratios, are often used to identify price targets during upward trends. 

Based on the analysis, the Fibonacci extensions suggest that Bitcoin could reach valuation levels around $120,000, while Gold maintains a price of around $1,200.

The Glassnode co-founders’ analysis fuels optimism within the crypto community. Bitcoin’s potential for six-figure valuations could attract more investors and solidify its status as a digital store of value. 

The predicted surge in Bitcoin’s price would likely have a ripple effect, generating increased interest and investment in the broader cryptocurrency market.

Bitcoin price

When writing, BTC is trading at $27,900, just below the significant psychological level of $28,000. This level currently represents a crucial threshold for bearish sentiment towards BTC.

BTC must maintain support at the $27,000 level to sustain its bullish momentum. By surpassing the current resistance line at its current trading level, BTC can reclaim the $30,000 mark and set its sights on the annual high of $31,800. 

This upward movement could position the cryptocurrency to challenge the 1-year resistance level at $39,000, with the potential for consolidation above the $40,000 mark.

Featured image from Shutterstock, chart from TradingView.com 
Analyst Says BTC Is Angling For Six Digit Rally In Next Year

A popular crypto analyst has predicted that Bitcoin (BTC) is on a bullish path to reach six figures in 2023. Known pseudonymously as Credible, the analyst made the prediction on his Twitter handle while addressing his over 300k followers. 

The recent bear market began in late 2021, with Bitcoin dropping over 60% from its previous high. However, Credible believes that the crypto giant is experiencing a correction period that’ll see it rally up to six figures.

Related Reading: Sam Bankman-Fried Eyes On Bidding For Celsius Assets

How The Crypto Market Has Been Faring

The entire crypto market experienced bullish moments during the pandemic. Many analysts attributed the high interest to excess money in circulation. However, the market has declined since the start of 2022 due to many macroeconomic factors. 

Bitcoin fell over 60% from its all-time high of $68,000, with altcoins following the trend. Inflation statistics and lending rate hikes are major causes of the market’s volatility. 

However, the market seems to be stabilizing in the past few weeks. BTC remained sturdy after the Feds announced another rate hike last Wednesday, seeing a minor price decrease. While it has enjoyed some short wins and nose-dives, it has remained in the $19,000 range.

Why Is Credible Bullish On BTC’s Growth Next Year?

Given the current market situation, some analysts believe the market could get worse before getting better. However, Credible believes that Bitcoin just completed a lengthy correction and is ready to spark a parabolic rally to hit $150k.

Momentum. Which is why estimates must be within a range- it can vary. I am expecting at least 100k, not 300k+, likely somewhere around 150k-ish. But will know more as PA develops and the move actually starts. – Credible.

BTC is currently trading at above $19,500. | Source: BTCUSD price chart from TradingView.com
Statistics Behind Credible’s Bullish Sentiments

Credible is widely known to practice the Elliott Wave theory. This sophisticated technical analysis approach attempts to forecast price movement by leveraging crowd psychology which usually moves in waves. The theory states that a significant uptrend consists of five waves. The first three of which are upswings, and the last two are corrective phases.

While we have gone lower than expected in terms of price, macro invalidation hasn’t been hit ($14,000) and time-wise we are still right on track for our fifth wave, despite what it may seem. Time-wise, wave four correction is proportional to third wave, just as wave two was to first wave. – Credible.

According to the expert’s chart, BTC might start rising sharply in price sometime next month. He claims that sometime next year, Bitcoin’s price will rally to around $150,000. Cryptocurrency analyst also expects BTC to go beyond $22,000 in the near future.

Focusing On The Charts

While answering some comments on his predictions, Credible explained that momentum is the key driver behind his prediction. He also added that the present sentiment is similar to the attitude of investors and traders during the Covid-19 outbreak.

Heard almost exactly the same during the Covid crash in March [2020]. We went 20x soon after.”

Related Reading: Cardano Price Misses Fireworks On Its Birthday, How Far Will ADA Fall?

As of writing, Bitcoin hovers above $19,500, trading at a 2.37% increase from its last 24-hour price.

Featured image from Pixabay and chart from TradingView.com

NYSE-Listed Investment Firm Says Bitcoin Will Crash To $12,000

On Monday, analysts Barry B. Bannister and Thomas R. Carroll at the equity trading desk of investment bank Stifel, predict in their call of the day that Bitcoin could fall to as low as $12,000 in the coming months.

In the financial market roundup article from MarketWatch, it is mentioned,

Other casualties that Bannister and Carroll expect to see are bitcoin BTCUSD… sensitive to slowing global liquidity and the stronger dollar. The strategists at Stifel see bitcoin falling from around $34,000 to $12,000 if global M2—a measure of the money supply—drops to low-single digits year-over-year, as they expect.

Source: Stifel Estimates, Bloomberg Data

As the global pandemic comes to an end, the M2 supply – or the total amount of “near money” akin to cash, checking deposits, saving deposits, mutual funds, and any less liquid assets – should drop again. From February to August during the pandemic, the M2 supply rose in the US by nearly 3 trillion dollars.

Related Reading | A Never Wrong Bearish Bitcoin Signal Just Triggered

This large increase reflected the tough economic period for citizens and the Federal Reserve’s actions of cutting interest rates to reduce the impact individuals felt. Now that the pandemic is nearly over, interest rates will go up again, and people could once again begin spending their money instead of investing it.

The price of BTC could see a significant drop as predicted by the analysts at Stifel since people will have less extra cash on hand that could be used to invest in crypto.

BTC Price Continues To Rise?

Although the analysts at Stifel have predicted a bearish trend over the coming weeks, the market does not seem to want to agree. Currently the price of BTC sits at around 36k, well over the 28k low from earlier this month. Even though Bitcoin does somewhat follow the M2 year over year trend, that movement could be short lived. Just because there will be less cash on hand as the pandemic comes to a close, does not mean that new or existing investors will suddenly shy away from BTC and crypto.

Related Reading | Ethereum Bulls Keeps Pushing, Why Rally Isn’t Over Yet

In fact, the more that traditional analysts talk about crypto, the more new investors will see it as viable. With the acceptance of both crypto and blockchain technology, investors will continue to see movement outside of normal trends because of events that these markets have never seen before such as a global pandemic.

But Will The Market Hold?

The crypto market will continue hold as new technology and big business comes into play. Plus, the cryptocurrency market will always see movement when market analyst like Bannister and Carroll from Stifel investment firm talk about the price. Simply having firms like this closely monitoring the price of BTC tells investors that blockchain technology is a force to be reckoned with.

Photo by Austin Distel on Unsplash

Pantera Capital CEO: Bitcoin Has Only Been This “Cheap” 20% Of The Last 11 Years

The best time to buy Bitcoin was a few years and when it first came around in the early 2010’s. The next best time to buy BTC? Right now according to Pantera Capital CEO Dan Morehead.

In a tweet sent out recently, Morehead laid out the facts for why the the market is below trend, making now one of the best times to buy.

Bitcoin Below Market Trend?

What Morehead explains about the price of Bitcoin is clear to see. Right now, Bitcoin is trading at 36% below its 11 year exponential trend. So, relative to this trend, or the overall direction of market price, it has only been this “cheap” to buy and under the trend for a little over 20% of the last decade plus.

This means that typically, people pay more for BTC relative to what they should have paid based on price movement. For those looking to buy bitcoin at a potential discount, now may be that time since Bitcoin is not normally under the trend in this way.

Although Bitcoin is trading at a lower price after the downturn in recent weeks, that doesn’t mean the market isn’t poised for a rebound. Investors should be bullish that the cryptocurrency is currently cheap relative to the trend. This along with the fact that it’s year over year return is up 281% shows that there should be no worry from crypto investors and those holding any digital assets.

Related Reading | BTC Extends Losses, Why $30K Holds The Key For Next Wave

Pantera Capital is the first U.S based institutional asset manager focused completely on blockchain technology. Since their first fund in 2013, they have continually been on the cutting edge of funding blockchain businesses, and investing in digital assets.

In Pantera Capital’s blockchain letter from 6/14/2021, they further clarify the reasons why holders should not worry about the recent losses:

It has averaged more than tripling annually for ten years. Anyone that has held bitcoin for 3.25 years has made money. Bitcoin has only printed one calendar year with a lower low. So, most of those investors are up big-time.  

Related Reading | BTC Dips From $40K, Here’s Why Uptrend Is Still Intact In BTC

Why Is The Crypto Market Below Trend?

Many factors play into the reasons that the crypto market is below trend right now. But the biggest comes from the large dip crypto prices took a few weeks ago. With that drop, many investors were scared into liquidation and fears that the market could completely bottom out. The prevailing side effect, Bitcoin trades at a lower price relative to it’s decades long trend.

If you were thinking about dipping your toe into the cryptocurrency market, there is no better time like today to get a good deal on the price of Bitcoin relative to its history.

Feature photo by Chronis Yan on Unsplash